Antiseptic Soaps Market Analysis and Global Forecast 2024-2034

$ 1,390.00$ 5,520.00

Antiseptic Soaps Market Research Report: Information By Product Type (Bar Soaps, Liquid Soaps), By Application (Household, Hospitals), By Ingredients (Natural Antiseptic Ingredients, Chemical Antiseptic Ingredients), By End User (Supermarkets and Hypermarkets, Convenience Stores, Pharmacies, E-commerce), and by Region — Forecast till 2034

Page: 165

Report Published on: April 18, 2025
$ 3,470.00
$ 5,520.00
$ 1,390.00
Report Code: EBI79945 Category:
Description

Antiseptic Soaps Market Overview

The Antiseptic Soaps Market size accounted for USD 1.54 Billion in 2023 and is estimated to account for 3.52 Billion in 2024. The Market is expected to reah USD 5.87 Billion by 2034 growing at a compound annual growth rate (CAGR) of 6.14% from 2024 to 2034. The Antiseptic Soaps Market is driven by increasing awareness of personal hygiene, rising concerns about infectious diseases, and growing demand for antibacterial products in healthcare, household, and commercial settings. Consumers are increasingly seeking antiseptic soaps with herbal extracts and essential oils, viewing them as safer alternatives.

The antiseptic soaps market is poised for continued growth, driven by a heightened focus on hygiene and ongoing product innovation. Manufacturers are adapting to consumer preferences for natural ingredients, sustainable products, and convenient purchasing options through online channels.

Global Antiseptic Soaps Market Synopsis
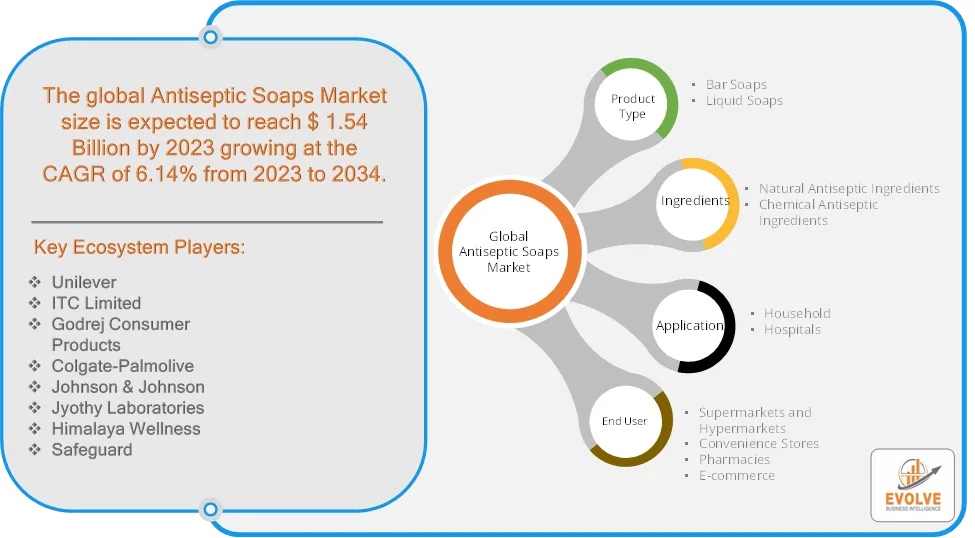
Antiseptic Soaps Market AnalysisAntiseptic Soaps Market Dynamics

The major factors that have impacted the growth of Antiseptic Soaps Market are as follows:

Drivers:

Ø  Growing Prevalence of Infectious Diseases

The spread of diseases such as influenza, skin infections, and gastrointestinal illnesses has boosted demand for antiseptic soaps. Healthcare organizations promote regular handwashing with antiseptic soaps to prevent infections. The availability of antiseptic soaps through online platforms and supermarkets has increased consumer accessibility. Discounts, promotions, and subscription-based hygiene product delivery services have boosted sales. Manufacturers are introducing herbal, organic, and skin-friendly antiseptic soaps with natural antibacterial ingredients like neem, tea tree oil, and aloe vera and dermatologist-recommended and pH-balanced antiseptic soaps are gaining traction among consumers with sensitive skin.

Restraint:

  • High Skin Irritation and Allergic Reactions and High Production Costs

Some antiseptic soaps contain harsh chemicals (e.g., triclosan, chlorhexidine) that may cause skin dryness, irritation, or allergic reactions, leading consumers to seek milder alternatives. Increasing consumer preference for organic and chemical-free soaps is limiting the growth of conventional antiseptic soaps. The cost of raw materials (e.g., essential oils, antibacterial agents, and packaging) can fluctuate, affecting profit margins and supply chain disruptions, especially in sourcing herbal and organic ingredients, can lead to price volatility and limited availability.

Opportunity:

⮚     Growing Demand for Natural & Organic Antiseptic Soaps

Consumers are shifting toward herbal and plant-based antiseptic soaps containing natural antibacterial agents like neem, tea tree oil, and aloe vera. Brands focusing on chemical-free, biodegradable, and skin-friendly formulations can attract health-conscious consumers. Hospitals, clinics, and elderly care facilities require antiseptic soaps for infection prevention. Regulatory bodies, such as the WHO and CDC, are emphasizing hand hygiene compliance, driving demand for medical-grade antiseptic soaps. Online platforms provide an easy purchasing experience, allowing manufacturers to reach a global audience and subscription-based models for hygiene products offer a steady revenue stream.

Antiseptic Soaps Market Segment Overview

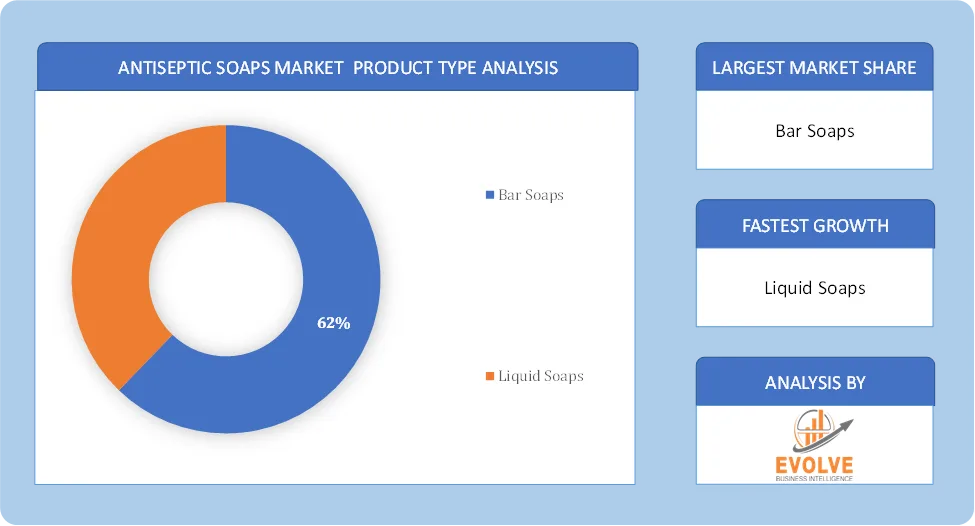
Antiseptic Soaps Market Product Type AnalysisBy Product Type

Based on Product Type, the market is segmented based on Bar Soaps, Liquid Soaps. The Liquid Soaps segment dominant the market. Consumers prefer liquid soaps due to their ease of use and convenient dispensing mechanisms like pump bottles, which reduce direct contact and minimize contamination. Liquid soaps are available in various formulations catering to different needs, including hand wash and body wash, and can incorporate moisturizing and other beneficial ingredients.

By Application

Based on Application, the market segment has been divided into Household, Hospitals. The Hospitals segment dominant the market. Antiseptic soaps are vital for preoperative handwashing and skin preparation, reducing the risk of surgical site infections. Hospitals prioritize antiseptic soaps with proven antimicrobial efficacy against a broad spectrum of pathogens.

By Ingredients

Based on Application, the market segment has been divided into Natural Antiseptic Ingredients, Chemical Antiseptic Ingredients. The Natural Antiseptic Ingredients segment dominant the market. Manufacturers are increasingly incorporating natural antiseptic ingredients into their soap formulations, often combining them with moisturizing agents to create balanced products. The market is witnessing a diversification of products with various natural antiseptic ingredients, catering to specific consumer needs and preferences.

By End User

Based on End User, the market segment has been divided into Supermarkets and Hypermarkets, Convenience Stores, Pharmacies, E-commerce. The Supermarkets and Hypermarkets segment dominant the market. Supermarkets and hypermarkets offer a broad range of antiseptic soap brands, formulations (liquid, bar), and sizes, catering to diverse consumer preferences. Supermarkets and hypermarkets strategically place antiseptic soaps in high-traffic areas, such as near the hygiene and personal care sections, to maximize sales.

Global Antiseptic Soaps Market Regional Analysis

Based on region, the global Antiseptic Soaps Market has been divided into North America, Europe, Asia-Pacific, the Middle East & Africa, and Latin America. North America is projected to dominate the use of the Antiseptic Soaps Market followed by the Asia-Pacific and Europe regions.
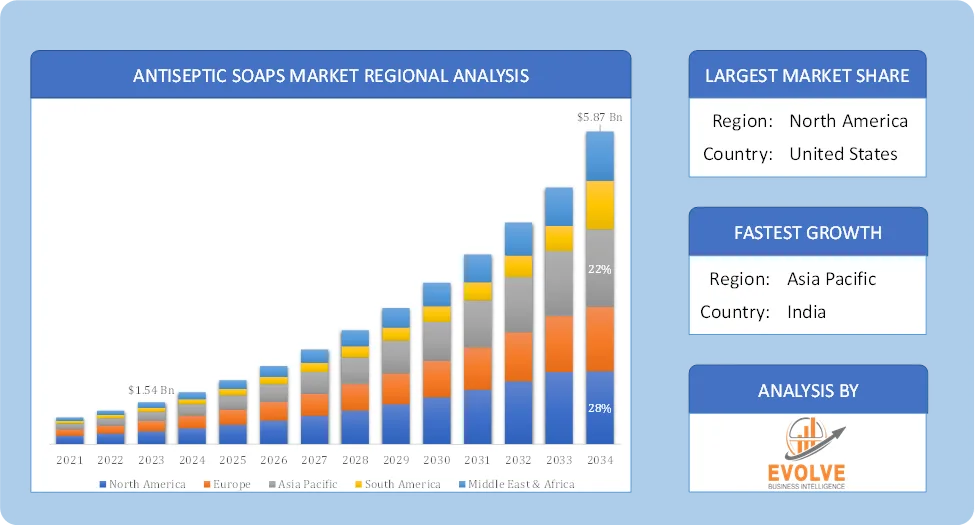
Global Antiseptic Soaps Market Regional AnalysisNorth America Antiseptic Soaps Market

North America holds a dominant position in the Antiseptic Soaps Market. North America is a mature market for antiseptic soaps, driven by high hygiene standards, stringent regulations, and a well-established healthcare sector. High hygiene standards, well-established healthcare infrastructure, increasing prevalence of healthcare-associated infections (HAIs), and significant healthcare expenditure drive the market in this region. A strong preference for liquid soaps, increasing demand for natural and organic antiseptic products, and a focus on advanced formulations are notable trends and Well-developed e-commerce channels, boosting online sales.

Asia-Pacific Antiseptic Soaps Market

The Asia-Pacific region has indeed emerged as the fastest-growing market for the Antiseptic Soaps Market industry. It’s driven by increasing hygiene awareness, rising disposable income, and expanding retail & e-commerce sectors. Rapid economic development, increased healthcare investments, a large population base, and rising awareness about personal hygiene and cleanliness, especially in densely populated countries like China and India, are fueling market growth. Increasing demand for hand soaps and body washes, growing availability of diligently formulated products through online portals, and the emergence of local companies offering antiseptic and antibacterial products are key trends.

Competitive Landscape

The global Antiseptic Soaps Market is highly competitive, with numerous players offering a wide range of software solutions. The competitive landscape is characterized by the presence of established companies, as well as emerging startups and niche players. To increase their market position and attract a wide consumer base, the businesses are employing various strategies, such as product launches, and strategic alliances.

Prominent Players:

  • Reckitt Benckiser Group Plc
  • Procter & Gamble (Lifebuoy)
  • Unilever
  • ITC Limited
  • Godrej Consumer Products
  • Colgate-Palmolive
  • Johnson & Johnson
  • Jyothy Laboratories
  • Himalaya Wellness

Scope of the Report

Global Antiseptic Soaps Market, by Product Type
  • Bar Soaps
  • Liquid Soaps
Global Antiseptic Soaps Market, by Ingredients
  • Natural Antiseptic Ingredients
  • Chemical Antiseptic Ingredients
Global Antiseptic Soaps Market, by Application
  • Household
  • Hospitals
Global Antiseptic Soaps Market, by End User
  • Supermarkets and Hypermarkets
  • Convenience Stores
  • Pharmacies
  • E-commerce
Global Antiseptic Soaps Market, by Region
  • North America
    • US
    • Canada
    • Mexico
  • Europe
    • UK
    • Germany
    • France
    • Italy
    • Spain
    • Benelux
    • Nordic
    • Rest of Europe
  • Asia Pacific
    • China
    • Japan
    • South Korea
    • Indonesia
    • Austalia
    • Malaysia
    • India
    • Rest of Asia Pacific
  • South America
    • Brazil
    • Argentina
    • Rest of South America
  • Middle East & Africa
    • Saudi Arabia
    • UAE
    • Egypt
    • South Africa
    • Rest of Middle East & Africa


Parameters Indicators
Market Size 2034: USD 5.87 Billion
CAGR (2024-2034) 6.14%
Base year 2022
Forecast Period 2024-2034
Historical Data 2021 (2017 to 2020 On Demand)
Report Coverage Revenue Forecast, Competitive Landscape, Growth Factors, and Trends
Key Segmentations Product Type, Ingredient, Application, End User
Geographies Covered North America, Europe, Asia-Pacific, South America, Middle East, Africa
Key Vendors Reckitt Benckiser Group Plc, Procter & Gamble (Lifebuoy), Unilever, ITC Limited, Godrej Consumer Products, Colgate-Palmolive, Johnson & Johnson, Jyothy Laboratories, Himalaya Wellness and Safeguard.
Key Market Opportunities ·        Growing Demand for Natural & Organic Antiseptic Soaps

·        Increasing Use in the Healthcare Sector

Key Market Drivers ·       Growing Prevalence of Infectious Diseases

·       Innovation in Product Formulation


REPORT CONTENT BRIEF:

  • High-level analysis of the current and future Antiseptic Soaps Market trends and opportunities
  • Detailed analysis of current market drivers, restraining factors, and opportunities in the future
  • Antiseptic Soaps Market historical market size for the year 2021, and forecast from 2023 to 2033
  • Antiseptic Soaps Market share analysis at each product level
  • Competitor analysis with detailed insight into its product segment, Government & Defense strength, and strategies adopted.
  • Identifies key strategies adopted including product launches and developments, mergers and acquisitions, joint ventures, collaborations, and partnerships as well as funding taken and investment done, among others.
  • To identify and understand the various factors involved in the global Antiseptic Soaps Market affected by the pandemic
  • To provide a detailed insight into the major companies operating in the market. The profiling will include the Government & Defense health of the company’s past 2-3 years with segmental and regional revenue breakup, product offering, recent developments, SWOT analysis, and key strategies.

Frequently Asked Questions (FAQ)

The global Antiseptic Soaps Market is growing at a CAGR of 6.14% over the next 10 years

Asia Pacific is expected to register the highest CAGR during 2024-2034

Reckitt Benckiser Group Plc, Procter & Gamble (Lifebuoy), Unilever, ITC Limited, Godrej Consumer Products, Colgate-Palmolive, Johnson & Johnson, Jyothy Laboratories, Himalaya Wellness and Safeguard. etc. are the major companies operating in the market.

Yes, we offer 16 hours of analyst support to solve the queries

Yes, we provide regional as well as country-level reports. Other than this we also provide a sectional report. Please get in contact with our sales representatives.

For more details mail us at

Ask a question / additional requirement

Table of Content

Table of Content

CHAPTER 1.         Executive Summary

CHAPTER 2.         Scope of the Study

2.1.       Market Definition

2.2.       Market Scope & Segmentation

2.2.1.        Objective of Report

CHAPTER 3.         Evolve BI Methodology

3.1.       Data Collection & Validation Approach

3.2.       Market Size Estimation and Forecast

CHAPTER 4.         Exclusive Analysis

4.1.       Market Opportunity Score

4.1.1.        Product Type Segement – Market Opportunity Score

4.1.2.        Ingredients Segment – Market Opportunity Score

4.1.3.        Application Segment – Market Opportunity Score

4.1.4.        End User Segment – Market Opportunity Score

4.2.       Key Market Influencing Indicators

CHAPTER 5.         Market Insights and Trends

5.1.       Value Chain Analysis

5.1.1.        Raw Material

5.1.2.        Manufacturing Process

5.1.3.        Distribution Channel

5.1.4.        End User

5.2.       Porter’s Five Forces Analysis

5.2.1.        Bargaining Power of Buyers

5.2.2.        Bargaining Power of Suppliers

5.2.3.        Threat of New Entrant

5.2.4.        Threat of Substitute

5.2.5.        Industry Rivalry

5.3.       COVID-19 Impact and Post COVID Scenario on Antiseptic Soaps Market

5.3.1.        Impact of COVID-19

5.3.2.        Government Support and Industry Revival Policies

5.3.3.        Measures Taken by Companies to Mitigate Negative Impact

5.3.4.        Post COVID Trend

CHAPTER 6.         MArket Dynamics

6.1.       Introduction

6.2.       Drivers

6.2.1.        Driver 1

6.2.2.        Driver 2

6.2.3.        Driver 3

6.3.       Restraints

6.3.1.        Restraint 1

6.3.2.        Restraint 2

6.4.       Opportunity

6.4.1.        Opportunity 1

CHAPTER 7.         Antiseptic Soaps Market, By  Product Type

7.1.       Introduction

 7.1.1. Bar Soaps

 7.1.2.  Liquid Soaps

CHAPTER 8.         Antiseptic Soaps Market, By Ingredients

8.1.       Introduction

8.1.1.  Natural Antiseptic Ingredients

8.1.2.  Chemical Antiseptic Ingredients

CHAPTER 9.         Antiseptic Soaps Market, By Application

9.1.       Introduction

      9.1.1.  Household

      9.1.2.  Hospitals

CHAPTER 10.    Antiseptic Soaps Market, By End User

10.1.Introduction

10.1.1.  Supermarkets and Hypermarkets

10.1.2.  Convenience Stores

 10.1.3.  Pharmacies

10.1.4.  E-commerce

CHAPTER 11.       Antiseptic Soaps Market, By Region

11.1.     Introduction

11.2.     NORTH AMERICA

11.2.1.      North America: Market Size and Forecast, By Country, 2024 – 2034  ($ Million)

11.2.2.      North America: Market Size and Forecast, By Product Type, 2024 – 2034  ($ Million)

11.2.3.      North America: Market Size and Forecast, By Ingredients, 2024 – 2034  ($ Million)

11.2.4.      North America: Market Size and Forecast, By Application, 2024 – 2034  ($ Million)

11.2.5.      North America: Market Size and Forecast, By End User, 2024 – 2034  ($ Million)

11.2.6.      US

11.2.6.1.       US: Market Size and Forecast, By Product Type, 2024 – 2034  ($ Million)

11.2.6.2.       US: Market Size and Forecast, By Ingredients, 2024 – 2034  ($ Million)

11.2.6.3.       US: Market Size and Forecast, By Application, 2024 – 2034  ($ Million)

11.2.6.4.       US: Market Size and Forecast, By End User, 2024 – 2034  ($ Million)

11.2.7.      CANADA

11.2.7.1.       Canada: Market Size and Forecast, By Product Type, 2024 – 2034  ($ Million)

11.2.7.2.       Canada: Market Size and Forecast, By Ingredients, 2024 – 2034  ($ Million)

11.2.7.3.       Canada: Market Size and Forecast, By Application, 2024 – 2034  ($ Million)

11.2.7.4.       Canada: Market Size and Forecast, By End User, 2024 – 2034  ($ Million)

11.2.8.      MEXICO

11.2.8.1.       Mexico: Market Size and Forecast, By Product Type, 2024 – 2034  ($ Million)

11.2.8.2.       Mexico: Market Size and Forecast, By Ingredients, 2024 – 2034  ($ Million)

11.2.8.3.       Mexico: Market Size and Forecast, By Application, 2024 – 2034  ($ Million)

11.2.8.4.       Mexico: Market Size and Forecast, By End User, 2024 – 2034  ($ Million)

11.3.     Europe

11.3.1.      Europe: Market Size and Forecast, By Country, 2024 – 2034  ($ Million)

11.3.2.      Europe: Market Size and Forecast, By Product Type, 2024 – 2034  ($ Million)

11.3.3.      Europe: Market Size and Forecast, By Ingredients, 2024 – 2034  ($ Million)

11.3.4.      Europe: Market Size and Forecast, By Application, 2024 – 2034  ($ Million)

11.3.5.      Europe: Market Size and Forecast, By End User, 2024 – 2034  ($ Million)

11.3.6.      U.K.

11.3.6.1.       U.K.: Market Size and Forecast, By Product Type, 2024 – 2034  ($ Million)

11.3.6.2.       U.K.: Market Size and Forecast, By Ingredients, 2024 – 2034  ($ Million)

11.3.6.3.       U.K.: Market Size and Forecast, By Application, 2024 – 2034  ($ Million)

11.3.6.4.       U.K.: Market Size and Forecast, By End User, 2024 – 2034  ($ Million)

11.3.7.      GERMANY

11.3.7.1.       Germany: Market Size and Forecast, By Product Type, 2024 – 2034  ($ Million)

11.3.7.2.       Germany: Market Size and Forecast, By Ingredients, 2024 – 2034  ($ Million)

11.3.7.3.       Germany: Market Size and Forecast, By Application, 2024 – 2034  ($ Million)

11.3.7.4.       Germany: Market Size and Forecast, By End User, 2024 – 2034  ($ Million)

11.3.8.      FRANCE

11.3.8.1.       France: Market Size and Forecast, By Product Type, 2024 – 2034  ($ Million)

11.3.8.2.       France: Market Size and Forecast, By Ingredients, 2024 – 2034  ($ Million)

11.3.8.3.       France: Market Size and Forecast, By Application, 2024 – 2034  ($ Million)

11.3.8.4.       France: Market Size and Forecast, By End User, 2024 – 2034  ($ Million)

11.3.9.      ITALY

11.3.9.1.       Italy: Market Size and Forecast, By Product Type, 2024 – 2034  ($ Million)

11.3.9.2.       Italy: Market Size and Forecast, By Ingredients, 2024 – 2034  ($ Million)

11.3.9.3.       Italy: Market Size and Forecast, By Application, 2024 – 2034  ($ Million)

11.3.9.4.       Italy: Market Size and Forecast, By End User, 2024 – 2034  ($ Million)

11.3.10.        SPAIN

11.3.10.1.    Spain: Market Size and Forecast, By Product Type, 2024 – 2034  ($ Million)

11.3.10.2.    Spain: Market Size and Forecast, By Ingredients, 2024 – 2034  ($ Million)

11.3.10.3.    Spain: Market Size and Forecast, By Application, 2024 – 2034  ($ Million)

11.3.10.4.    Spain: Market Size and Forecast, By End User, 2024 – 2034  ($ Million)

11.3.11.        BENELUX

11.3.11.1.    BeNeLux: Market Size and Forecast, By Product Type, 2024 – 2034  ($ Million)

11.3.11.2.    BeNeLux: Market Size and Forecast, By Ingredients, 2024 – 2034  ($ Million)

11.3.11.3.    BeNeLux: Market Size and Forecast, By Application, 2024 – 2034  ($ Million)

11.3.11.4.    BeNeLux: Market Size and Forecast, By End User, 2024 – 2034  ($ Million)

11.3.12.        RUSSIA

11.3.12.1.    Russia: Market Size and Forecast, By Product Type, 2024 – 2034  ($ Million)

11.3.12.2.    Russia: Market Size and Forecast, By Ingredients, 2024 – 2034  ($ Million)

11.3.12.3.    Russia: Market Size and Forecast, By Application, 2024 – 2034  ($ Million)

11.3.12.4.    Russia: Market Size and Forecast, By End User, 2024 – 2034  ($ Million)

11.3.13.        REST OF EUROPE

11.3.13.1.    Rest of Europe: Market Size and Forecast, By Product Type, 2024 – 2034  ($ Million)

11.3.13.2.    Rest of Europe: Market Size and Forecast, By Ingredients, 2024 – 2034  ($ Million)

11.3.13.3.    Rest of Europe: Market Size and Forecast, By Application, 2024 – 2034  ($ Million)

11.3.13.4.    Rest of Europe: Market Size and Forecast, By End User, 2024 – 2034  ($ Million)

11.4.     Asia Pacific

11.4.1.      Asia Pacific: Market Size and Forecast, By Country, 2024 – 2034  ($ Million)

11.4.2.      Asia Pacific: Market Size and Forecast, By Product Type, 2024 – 2034  ($ Million)

11.4.3.      Asia Pacific: Market Size and Forecast, By Ingredients, 2024 – 2034  ($ Million)

11.4.4.      Asia Pacific: Market Size and Forecast, By Application, 2024 – 2034  ($ Million)

11.4.5.      Asia Pacific: Market Size and Forecast, By End User, 2024 – 2034  ($ Million)

11.4.6.      CHINA

11.4.6.1.       China: Market Size and Forecast, By Product Type, 2024 – 2034  ($ Million)

11.4.6.2.       China: Market Size and Forecast, By Ingredients, 2024 – 2034  ($ Million)

11.4.6.3.       China: Market Size and Forecast, By Application, 2024 – 2034  ($ Million)

11.4.6.4.       China: Market Size and Forecast, By End User, 2024 – 2034  ($ Million)

11.4.7.      JAPAN

11.4.7.1.       Japan: Market Size and Forecast, By Product Type, 2024 – 2034  ($ Million)

11.4.7.2.       Japan: Market Size and Forecast, By Ingredients, 2024 – 2034  ($ Million)

11.4.7.3.       Japan: Market Size and Forecast, By Application, 2024 – 2034  ($ Million)

11.4.7.4.       Japan: Market Size and Forecast, By End User, 2024 – 2034  ($ Million)

11.4.8.      INDIA

11.4.8.1.       India: Market Size and Forecast, By Product Type, 2024 – 2034  ($ Million)

11.4.8.2.       India: Market Size and Forecast, By Ingredients, 2024 – 2034  ($ Million)

11.4.8.3.       India: Market Size and Forecast, By Application, 2024 – 2034  ($ Million)

11.4.8.4.       India: Market Size and Forecast, By End User, 2024 – 2034  ($ Million)

11.4.9.      SOUTH KOREA

11.4.9.1.       South Korea: Market Size and Forecast, By Product Type, 2024 – 2034  ($ Million)

11.4.9.2.       South Korea: Market Size and Forecast, By Ingredients, 2024 – 2034  ($ Million)

11.4.9.3.       South Korea: Market Size and Forecast, By Application, 2024 – 2034  ($ Million)

11.4.9.4.       South Korea: Market Size and Forecast, By End User, 2024 – 2034  ($ Million)

11.4.10.        THAILAND

11.4.10.1.    Thailand: Market Size and Forecast, By Product Type, 2024 – 2034  ($ Million)

11.4.10.2.    Thailand: Market Size and Forecast, By Ingredients, 2024 – 2034  ($ Million)

11.4.10.3.    Thailand: Market Size and Forecast, By Application, 2024 – 2034  ($ Million)

11.4.10.4.    Thailand: Market Size and Forecast, By End User, 2024 – 2034  ($ Million)

11.4.11.        INDONESIA

11.4.11.1.    Indonesia: Market Size and Forecast, By Product Type, 2024 – 2034  ($ Million)

11.4.11.2.    Indonesia: Market Size and Forecast, By Ingredients, 2024 – 2034  ($ Million)

11.4.11.3.    Indonesia: Market Size and Forecast, By Application, 2024 – 2034  ($ Million)

11.4.11.4.    Indonesia: Market Size and Forecast, By End User, 2024 – 2034  ($ Million)

11.4.12.        MALAYSIA

11.4.12.1.    Malaysia: Market Size and Forecast, By Product Type, 2024 – 2034  ($ Million)

11.4.12.2.    Malaysia: Market Size and Forecast, By Ingredients, 2024 – 2034  ($ Million)

11.4.12.3.    Malaysia: Market Size and Forecast, By Application, 2024 – 2034  ($ Million)

11.4.12.4.    Malaysia: Market Size and Forecast, By End User, 2024 – 2034  ($ Million)

11.4.13.        AUSTRALIA

11.4.13.1.    Australia: Market Size and Forecast, By Product Type, 2024 – 2034  ($ Million)

11.4.13.2.    Australia: Market Size and Forecast, By Ingredients, 2024 – 2034  ($ Million)

11.4.13.3.    Australia: Market Size and Forecast, By Application, 2024 – 2034  ($ Million)

11.4.13.4.    Australia: Market Size and Forecast, By End User, 2024 – 2034  ($ Million)

11.4.14.        REST FO ASIA PACIFIC

11.4.14.1.    Rest fo Asia Pacific: Market Size and Forecast, By Product Type, 2024 – 2034  ($ Million)

11.4.14.2.    Rest fo Asia Pacific: Market Size and Forecast, By Ingredients, 2024 – 2034  ($ Million)

11.4.14.3.    Rest fo Asia Pacific: Market Size and Forecast, By Application, 2024 – 2034  ($ Million)

11.4.14.4.    Rest fo Asia Pacific: Market Size and Forecast, By End User, 2024 – 2034  ($ Million)

11.5.     South America

11.5.1.      South America: Market Size and Forecast, By Country, 2024 – 2034  ($ Million)

11.5.2.      South America: Market Size and Forecast, By Product Type, 2024 – 2034  ($ Million)

11.5.3.      South America: Market Size and Forecast, By Ingredients, 2024 – 2034  ($ Million)

11.5.4.      South America: Market Size and Forecast, By Application, 2024 – 2034  ($ Million)

11.5.5.      South America: Market Size and Forecast, By End User, 2024 – 2034  ($ Million)

11.5.6.      BRAZIL

11.5.6.1.       Brazil: Market Size and Forecast, By Product Type, 2024 – 2034  ($ Million)

11.5.6.2.       Brazil: Market Size and Forecast, By Ingredients, 2024 – 2034  ($ Million)

11.5.6.3.       Brazil: Market Size and Forecast, By Application, 2024 – 2034  ($ Million)

11.5.6.4.       Brazil: Market Size and Forecast, By End User, 2024 – 2034  ($ Million)

11.5.7.      ARGENTINA

11.5.7.1.       Argentina: Market Size and Forecast, By Product Type, 2024 – 2034  ($ Million)

11.5.7.2.       Argentina: Market Size and Forecast, By Ingredients, 2024 – 2034  ($ Million)

11.5.7.3.       Argentina: Market Size and Forecast, By Application, 2024 – 2034  ($ Million)

11.5.7.4.       Argentina: Market Size and Forecast, By End User, 2024 – 2034  ($ Million)

11.5.8.      REST OF SOUTH AMERICA

11.5.8.1.       Rest of South America: Market Size and Forecast, By Product Type, 2024 – 2034  ($ Million)

11.5.8.2.       Rest of South America: Market Size and Forecast, By Ingredients, 2024 – 2034  ($ Million)

11.5.8.3.       Rest of South America: Market Size and Forecast, By Application, 2024 – 2034  ($ Million)

11.5.8.4.       Rest of South America: Market Size and Forecast, By End User, 2024 – 2034  ($ Million)

11.6.     Middle East & Africa

11.6.1.      Middle East & Africa: Market Size and Forecast, By Country, 2024 – 2034  ($ Million)

11.6.2.      Middle East & Africa: Market Size and Forecast, By Product Type, 2024 – 2034  ($ Million)

11.6.3.      Middle East & Africa: Market Size and Forecast, By Ingredients, 2024 – 2034  ($ Million)

11.6.4.      Middle East & Africa: Market Size and Forecast, By Application, 2024 – 2034  ($ Million)

11.6.5.      Middle East & Africa: Market Size and Forecast, By End User, 2024 – 2034  ($ Million)

11.6.6.      SAUDI ARABIA

11.6.6.1.       Saudi Arabia: Market Size and Forecast, By Product Type, 2024 – 2034  ($ Million)

11.6.6.2.       Saudi Arabia: Market Size and Forecast, By Ingredients, 2024 – 2034  ($ Million)

11.6.6.3.       Saudi Arabia: Market Size and Forecast, By Application, 2024 – 2034  ($ Million)

11.6.6.4.       Saudi Arabia: Market Size and Forecast, By End User, 2024 – 2034  ($ Million)

11.6.7.      UAE

11.6.7.1.       UAE: Market Size and Forecast, By Product Type, 2024 – 2034  ($ Million)

11.6.7.2.       UAE: Market Size and Forecast, By Ingredients, 2024 – 2034  ($ Million)

11.6.7.3.       UAE: Market Size and Forecast, By Application, 2024 – 2034  ($ Million)

11.6.7.4.       UAE: Market Size and Forecast, By End User, 2024 – 2034  ($ Million)

11.6.8.      EGYPT

11.6.8.1.       Egypt: Market Size and Forecast, By Product Type, 2024 – 2034  ($ Million)

11.6.8.2.       Egypt: Market Size and Forecast, By Ingredients, 2024 – 2034  ($ Million)

11.6.8.3.       Egypt: Market Size and Forecast, By Application, 2024 – 2034  ($ Million)

11.6.8.4.       Egypt: Market Size and Forecast, By End User, 2024 – 2034  ($ Million)

11.6.9.      SOUTH AFRICA

11.6.9.1.       South Africa: Market Size and Forecast, By Product Type, 2024 – 2034  ($ Million)

11.6.9.2.       South Africa: Market Size and Forecast, By Ingredients, 2024 – 2034  ($ Million)

11.6.9.3.       South Africa: Market Size and Forecast, By Application, 2024 – 2034  ($ Million)

11.6.9.4.       South Africa: Market Size and Forecast, By End User, 2024 – 2034  ($ Million)

11.6.10.        REST OF MIDDLE EAST & AFRICA

11.6.10.1.    Rest of Middle East & Africa: Market Size and Forecast, By Product Type, 2024 – 2034  ($ Million)

11.6.10.2.    Rest of Middle East & Africa: Market Size and Forecast, By Ingredients, 2024 – 2034  ($ Million)

11.6.10.3.    Rest of Middle East & Africa: Market Size and Forecast, By Application, 2024 – 2034  ($ Million)

11.6.10.4.    Rest of Middle East & Africa: Market Size and Forecast, By End User, 2024 – 2034  ($ Million)

CHAPTER 12.       Competitive Landscape

12.1.     Competitior Benchmarking 2024

12.2.     Market Share Analysis

12.3.     Key Developments Analysis By Top 5 Companies

12.4.     Market Share Acquisition Strategies: Analysis of Key Approaches Employed by Top Players

CHAPTER 13.       Company Profiles

13.1.     Reckitt Benckiser Group Plc

13.1.1. Business Overview

13.1.2. Financial Analysis

13.1.2.1. Business Segment Revenue, 2018, 2019, 2020, $ Million

13.1.2.2. Geographic Revenue Mix, 2020 (% Share)

13.1.3. Product Portfolio

13.1.4. Recent Development and Strategies Adopted

13.1.5. SWOT Analysis

13.2.     Procter & Gamble (Lifebuoy)

13.3.     Unilever

13.4.    ITC Limited

13.5.     Godrej Consumer Products

13.6.    Colgate-Palmolive

13.7.     Johnson & Johnson

13.8.     Jyothy Laboratories

13.9.    Himalaya Wellness

13.10.  Safeguard.

Connect to Analyst

Connect to Analyst

Research Methodology

Research Methodology