
Virtual Car Key Market Analysis and Forecast 2020-2032
Price range: $ 1,390.00 through $ 5,520.00
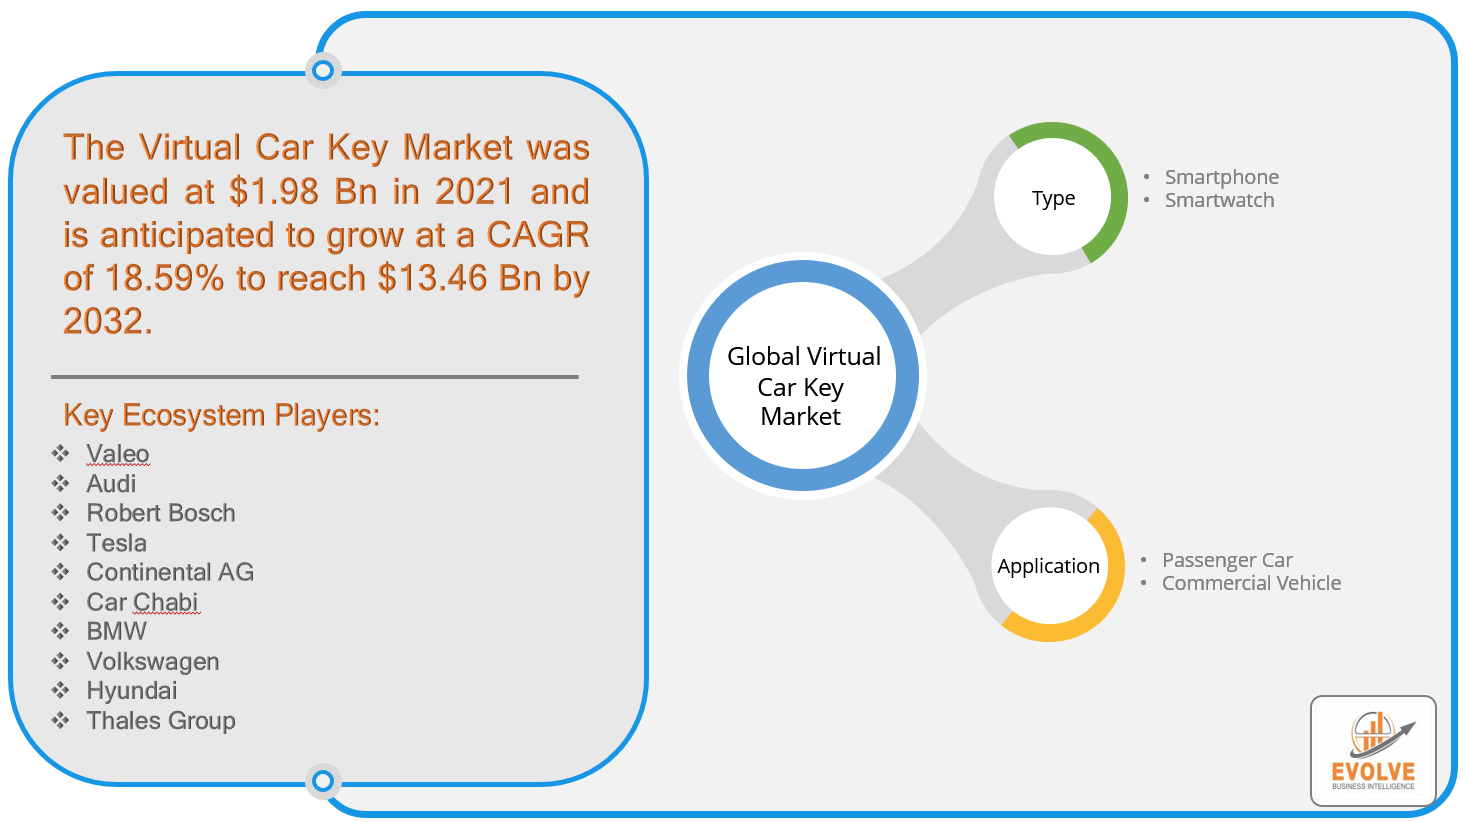
Virtual Car Key Market Research Report: Information ByType (Smartphone, Smartwatch), By Application (Passenger Car, Commercial Vehicle),and Region — Forecast till 2032
PRESS RELEASE:https://evolvebi.com/the-global-virtual-car-key-market-is-estimated-to-record-a-cagr-of-around-18-59-during-the-forecast-period/
Virtual Car KeyMarket Overview
Virtual Car Key Market Size is expected to reach USD 13,465.8 Million by 2032. The Virtual Car Key industry size accounted for USD D 1,988.4 Million in 2021 and is expected to expand at a compound annual growth rate (CAGR) of 18.59% from 2020 to 2032.The virtual car key market encompasses the creation and acceptance of electronic keys for automobiles, which can be accessed and utilized through mobile devices like smartphones or smartwatches. These keys serve as a substitute for traditional physical keys and offer advantages like augmented safety features, remote access and sharing, and other benefits. The market comprises enterprises engaged in producing, developing, and distributing virtual car keys, as well as those involved in related technologies and services like connected cars and mobile apps. With the expanding adoption of connected cars and the rising popularity of mobile-based services, the market is poised to experience substantial growth in the foreseeable future.
 COVID-19 Impact and Post-COVID Scenario
The virtual car key market has experienced a Negative impact due to the COVID-19 pandemic. While the pandemic has accelerated the adoption of contactless technology, including virtual car keys, as people strive to reduce physical contact and prevent the spread of the virus, it has also disrupted supply chains and manufacturing operations, affecting the development and production of virtual car keys. The shutdown of car manufacturing plants and reduced demand for new vehicles have further slowed down the adoption of virtual car keys, particularly in the short term.
Global Virtual Car Key Market Growth Factors
Increasing adoption of connected cars
The virtual car key market is being driven by the increasing adoption of connected cars, which offer several advantages such as enhanced safety and security, improved convenience, and access to a wide range of features and services. As connected cars become more popular, virtual car keys are becoming an essential part of the connected car ecosystem, enabling users to access and manage their vehicles remotely through their mobile devices. With virtual car keys, users can lock and unlock their cars, start the engine, adjust temperature and lighting settings, and perform other functions, all from their smartphones or other mobile devices. The convenience and ease of use provided by virtual car keys have made them an attractive option for many consumers and are expected to drive the growth of the virtual car key market in the forecasted period.
Global Scoliosis Market Restraining Factors
- Deficiency Of Awareness About The Mobile App Among Consumer
The deficiency of awareness among consumers about virtual car keys and the associated mobile app is a significant challenge for the market. Many people do not realize the importance of the mobile app and how it can enhance their lifestyle by providing convenient access to their vehicles. While the mobile app for virtual car keys is available on the Google Play Store and app store in Apple iOS, the lack of promotion among users in developing countries is expected to limit the market growth.
Global Scoliosis Market Opportunity Analysis
Increasing demand for contactless solutions
The increasing demand for contactless solutions due to the COVID-19 pandemic has created an opportunity for virtual car key manufacturers. As people look for ways to reduce physical contact and limit the spread of the virus, virtual car keys have become a more appealing option for consumers. The convenience and safety of virtual car keys have become more apparent, and this trend is expected to continue even after the pandemic subsides. Virtual car key manufacturers can leverage this opportunity by developing and promoting their touchless solutions to a wider audience.
Global Scoliosis Market Segment Analysis
 The Smartphone segment is expected to hold the largest market share
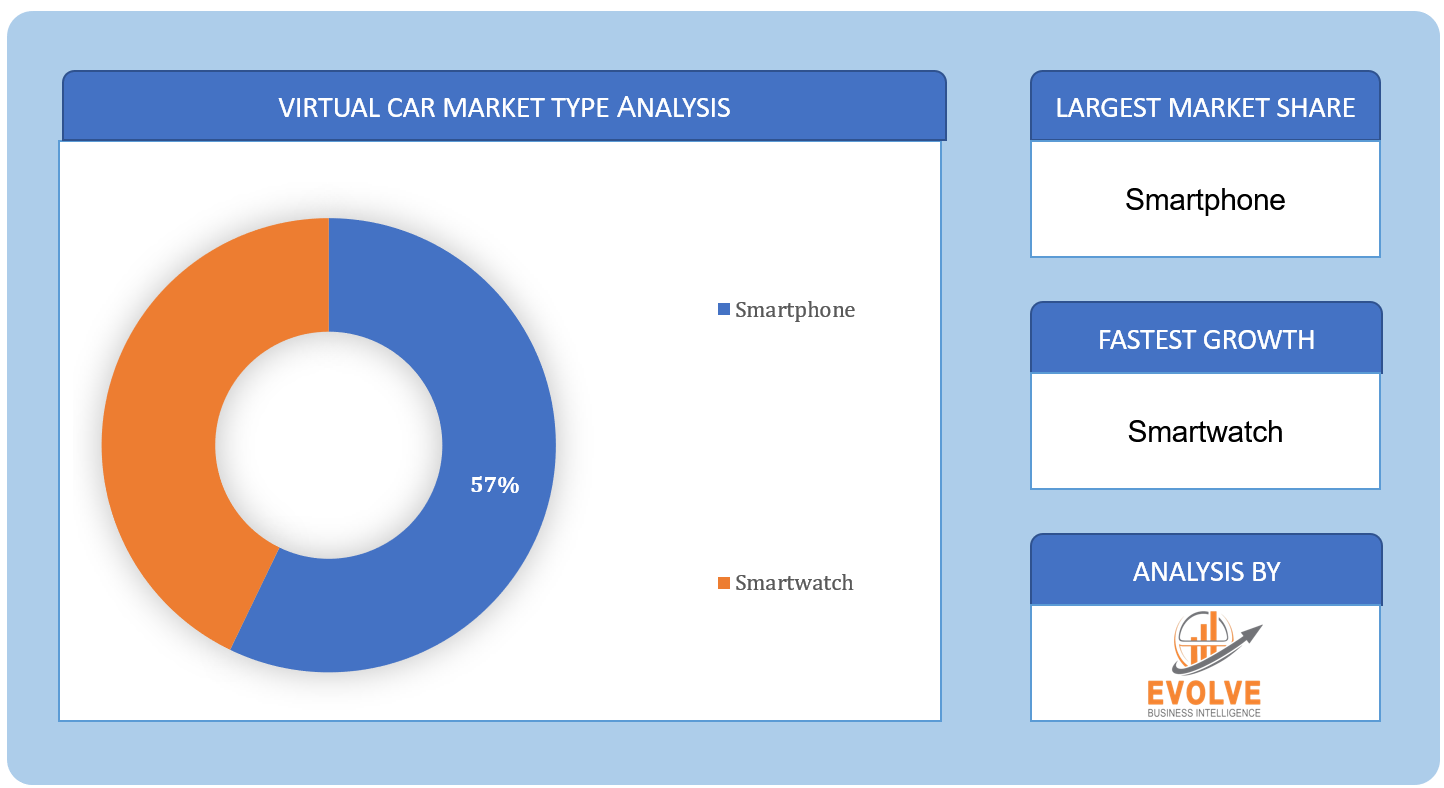
Based on the Type, the Virtual Car Key market is segmented based on Smartphone, and Smartwatch. The Smartphonesegmentis expected to hold the largest market share, This is due to the widespread adoption of smartphones globally, as well as the greater functionality and larger screen size of smartphones compared to smartwatches. Smartphones offer greater convenience and accessibility, allowing users to access and manage virtual car keys more easily. Additionally, the development of mobile apps for virtual car keys has also contributed to the growing popularity of smartphone-based virtual car keys. The increasing demand for connected cars and smart mobility solutions is expected to further boost the adoption of virtual car keys via smartphones in the imminent years.
The passenger car segment is expected to hold the largest market share
Based on Application, the global Virtual Car Key market has been divided intoPassenger Car and Commercial Vehicle. The passenger car segment is expected to hold the largest market share. This is due to the higher adoption of virtual car keys in the passenger car segment, driven by the increasing demand for connected cars and smart mobility solutions among consumers. Virtual car keys offer several advantages in passenger cars, such as convenience, ease of use, enhanced security, and the ability to remotely access and share keys. Moreover, the rising popularity of ride-sharing and car-sharing services is also expected to drive the growth of virtual car keys in the passenger car segment. The commercial vehicle segment is also expected to witness significant growth in the forecasting years.
Global Virtual Car Key Market, Segmental Chart
Virtual Car Key Market Regional Analysis
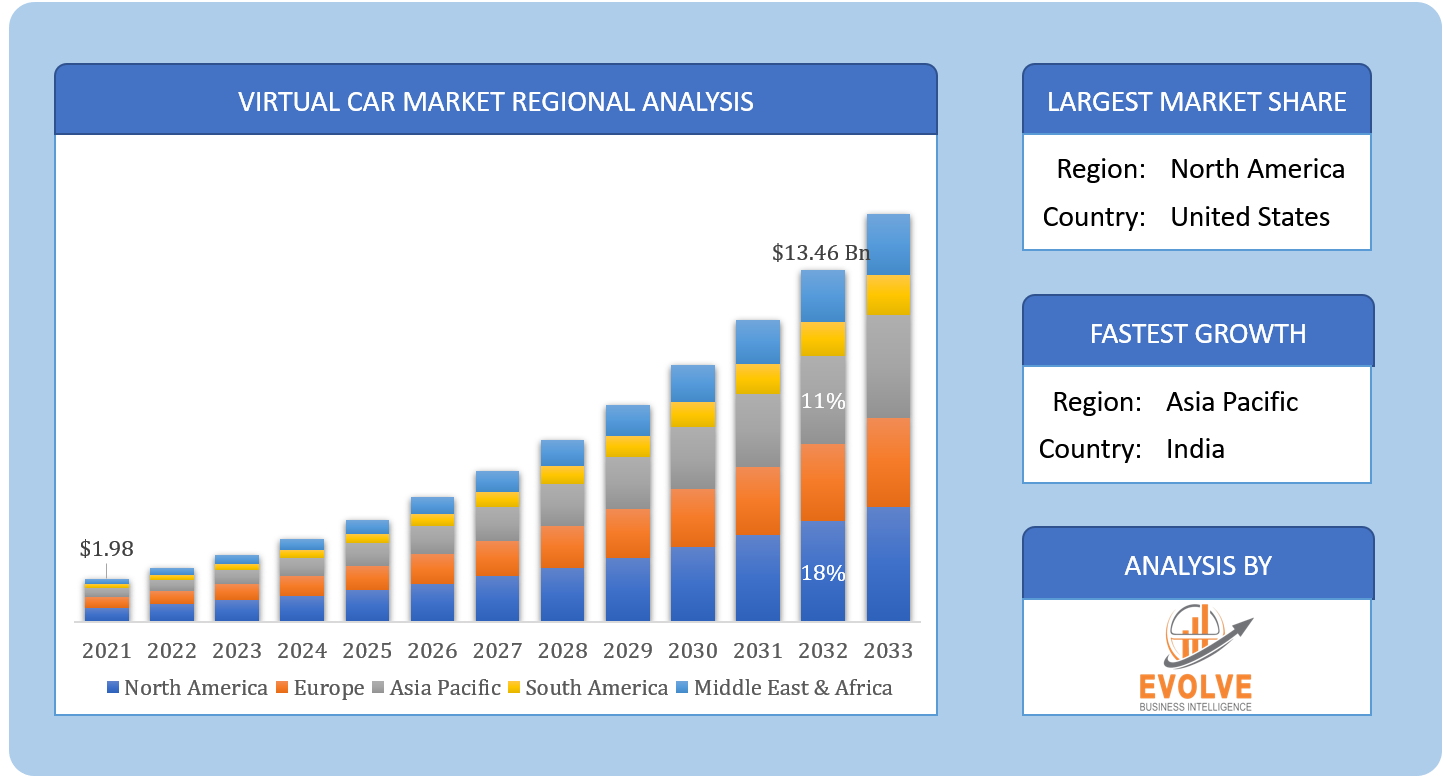
Based on region, the global Virtual Car Key market has been divided into North America, Europe, Asia-Pacific, theMiddle East & Africa, and Latin America. North America is projected to dominate the use of the Virtual Car Key market followed by the Asia-Pacific and Europe regions.
Regional Coverage:
- North America
- US
- Canada
- Mexico
- Europe
- UK
- Germany
- France
- Italy
- Spain
- Benelux
- Russia
- Rest of Europe
- Asia Pacific
- China
- Japan
- South Korea
- Indonesia
- Austalia
- Malaysia
- India
- Thailand
- Rest of Asia Pacific
- Latin America
- Brazil
- Argentina
- Rest of Latin America
- Middle East & Africa
- Saudi Arabia
- UAE
- Egypt
- South Africa
- Rest of Middle East & Africa
Asia Pacific Market
The Asia Pacific region is one of the dominant regions in the Virtual Car Key market. The region has a large population and a growing middle class with increasing purchasing power. This has led to a significant increase in demand for vehicles in the region. Additionally, many countries in the Asia Pacific region are investing heavily in infrastructure development, including smart cities and connected vehicles, which are expected to further drive the demand for virtual car keys. Moreover, the increasing adoption of mobile-based services and the growing smartphone and smartwatch penetration in the region are also contributing to the growth of the Virtual Car Key market in Asia Pacific.
North America Market
North America is one of the major regions in the global Virtual Car Key market and holds a significant market share. The region is home to several key players in the virtual car key market and has a high adoption rate of connected cars and mobile-based services. The increasing demand for contactless solutions and advanced security features in the region is also driving the growth of the virtual car key market. Additionally, the region has a strong focus on technological advancements and innovation, which is expected to contribute to the growth of the virtual car key market in the coming years.
Competitive Landscape
The competitive Landscape include key players (tier 1, tier 2, and local) having their presence across the globe. Companies such as Valeo, Audi, Robert Bosch, Tesla, and Continental AG are some of the leading players in global Virtual Car Key market. These players have adopted partnership, acquisition, expansion, new product development, among others as their key strategy.
Key Market Players:
- Valeo
- Audi
- Robert Bosch
- Tesla
- Continental AG
- Car Chabi
- BMW
- Volkswagen
- Hyundai
- Thales Group
Market Share Acquisition Strategies: Analysis of Key Approaches Employed by Top Players:
In August 2021,Continental AG announced that it had acquired a Stake in Kopernikus Automotive,Artificial Intelligence Specialist for Automated Parking.
In November 2021, Volkswagen has a partnership with EIT InnoEnergy to help innovate technologies and businessmodels accomplish economic breakthroughs that will contribute tothe decarbonization of the transport segment and accelerate theshift to electromobility.
Report Scope:
Global Virtual Car Key Market, by Type
- Smartphone
- Smartwatch
Global Virtual Car Key Market, by Application
- Passenger Car
- Commercial Vehicle
Global Scoliosis Treatment Market Synopsis:
| PARAMETER | VALUE |
Market Size | · 2021: USD 1,988.4Million· 2033: USD 13,465.8Million |
Growth Rate | · First 5 Years CAGR (2022–2026): XX%· Last 5 Years CAGR (2027–2032): XX%· 10 Years CAGR (2022–2032): 18.59% |
Key Market Drivers | · Increasing adoption of connected cars |
Key Market Restraints | · Deficiency Of Awareness About The Mobile App Among Consumer |
Market Opportunities | · Increasing demand for contactless solutions· |
Key Market Players | · Valeo· Audi· Robert Bosch· Tesla· Continental AG· Car Chabi· BMW· Volkswagen· Hyundai· Thales Group· Thales Group· International Business Machines Corporation |
REPORT CONTENT BRIEF:
- High-level analysis of the current and future Virtual Car Key market trends and opportunities
- Detailed analysis of current market drivers, restraining factors, and opportunities analysis in the future
- Historical market size for the year 2021, and forecast from 2022 to 2032
- Virtual Car Key market share analysis for each segment
- Competitor analysis with a comprehensive insight into its product segment, financial strength, and strategies adopted.
- Identifies key strategies adopted by the key players including new product development, mergers and acquisitions, joint ventures, collaborations, and partnerships.
- To identify and understand the various factors involved in the global Virtual Car Key market affected by the pandemic
- To provide year-on-year growth from 2022 to 2032
- To provide short-term, long-term, and overall CAGR comparison from 2022 to 2033.
- Provide Total Addressable Market (TAM) for the Global Virtual Car Key Market
Press Release

Global Pharmaceutical Manufacturing Market to Reach $1.38 Trillion by 2035 with 7.35% CAGR, New Research Shows
The Global Mammography Market Is Estimated To Record a CAGR of Around 10.29% During The Forecast Period
Glue Stick Market to Reach USD 2.35 Billion by 2034
Podiatry Service Market to Reach USD 11.88 Billion by 2034
Microfluidics Technology Market to Reach USD 32.58 Billion by 2034
Ferric Chloride Market to Reach USD 10.65 Billion by 2034
Family Practice EMR Software Market to Reach USD 21.52 Billion by 2034
Electric Hairbrush Market to Reach USD 15.95 Billion by 2034
Daily Bamboo Products Market to Reach USD 143.52 Billion by 2034
Cross-border E-commerce Logistics Market to Reach USD 112.65 Billion by 2034
Hydrogen Fuel Cell Market Analysis and Global Forecast 2023-2035
Hydrogen Fuel Cell Market Research Report: Information by Type (Proton Exchange Membrane Fuel cells, Phosphoric Acid Fuel Cells, Solid Oxide Fuel Cells, Molten Carbonate Fuel Cells, Others), By Application (Stationary, Transportation, Portable), By End-Use (Fuel Cell Vehicles, Utilities, Defense), and by Region — Forecast till 2033
Page: 116
HoReCa Market Analysis and Global Forecast 2023-2035
HoReCa Market Research Report: Information By Service Type (Hotels, Restaurants, Cafés, Pubs), By Category (Single Outlet, HoReCa Chain), and by Region — Forecast till 2035
Page: 116
Medical Nitrile Gloves Market Analysis and Global Forecast 2023-2033
Medical Nitrile Gloves Market Research Report: Information By Type (Powdered gloves, Non-powdered gloves), By Usage (Disposable, Reusable), By Application (Medical & Healthcare, Food Industry, Cleaning Industry, Others), By End Use (Ambulatory Surgery Centers, Diagnostic Centers, Rehabilitation Centers), and by Region — Forecast till 2033
Page: 116
Bidets Market Analysis and US Forecast 2023-2033
US Bidets Market By Type (Ceramic Bidets, Over the Rim Bidets, Handheld Bidets, Others), By Category (Electronics, Manual), By Distribution Channel (Store-Based, Non-Store-Based), By End Use (Residential, Commercial) and By Geography – COVID-19 Impact Analysis, Post COVID Analysis, Opportunities, Trends and Forecast from 2021 to 2028
Report Code: EB_LS_1279 | Page: 59 | Published Date: April 2022
Semiconductor Rectifiers Market Analysis and Global Forecast 2023-2033
Semiconductor Rectifiers Market Research Report: Information By Type (Half Wave, Full Wave), By Industry Vertical (Communication, Consumer Electronics, Automotive, Manufacturing), and by Region — Forecast till 2033
Page: 165


Frequently Asked Questions (FAQ)
What is the 10 Years CAGR (2021 to 2032) of the global Virtual Car Key market?
The global Virtual Car Key market is growing at a CAGR of ~ 59% over the next 10 years
Which region has the highest growth rate in the global Virtual Car Key market?
Asia Pacific is expected to register the highest CAGR during 2022-2032
Which region accounted for the largest share in the global Virtual Car Key market?
North America holds the largest share in 2022
Majort Key Players in the Global Virtual Car Key Market?
Valeo, Audi, Robert Bosch, Volkswagen AG, Continental AG, Car Chabi, BMW, Tesla, and Hyundaiare the major companies operating in the global Virtual Car Key
Do you offer Post Sale Support?
Yes, we offer 16 hours of analyst support to solve the queries
Do you deliver particular sections of a report?
Yes, we do provide regional as well as country-level reports. Other than this we also provide a sectional report. Please get in contact with our sales representatives.
Table of Contents
Table of Contents CHAPTER 1. Executive Summary CHAPTER 2. Scope of the Study 2.1. Market Definition 2.2. Market Scope & Segmentation 2.2.1. Objective of Report CHAPTER 3. Evolve BI Methodology 3.1. Data Collection & Validation Approach 3.2. Market Size Estimation and Forecast CHAPTER 4. Exclusive Analysis 4.1. Market Opportunity Score 4.1.1. Type Segement – Market Opportunity Score 4.1.2. Application Segment – Market Opportunity Score 4.2. Key Market Influencing Indicators CHAPTER 5. Market Insights and Trends 5.1. Value Chain Analysis 5.1.1. Raw Material 5.1.2. Manufacturing Process 5.1.3. Distribution Channel 5.1.4. End User 5.2. Porter’s Five Forces Analysis 5.2.1. Bargaining Power of Buyers 5.2.2. Bargaining Power of Suppliers 5.2.3. Threat of New Entrant 5.2.4. Threat of Substitute 5.2.5. Industry Rivalry 5.3. COVID-19 Impact and Post COVID Scenario on Online Picture Frames Market 5.3.1. Impact of COVID-19 5.3.2. Government Support and Industry Revival Policies 5.3.3. Measures Taken by Companies to Mitigate Negative Impact 5.3.4. Post COVID Trend CHAPTER 6. MArket Dynamics 6.1. Introduction 6.2. Drivers 6.2.1. Driver 1 6.2.2. Driver 2 6.2.3. Driver 3 6.3. Restraints 6.3.1. Restraint 1 6.3.2. Restraint 2 6.4. Opportunity 6.4.1. Opportunity 1 CHAPTER 7. Global Online Picture Frames Market, By Type 7.1. Introduction 7.1.1. Smartphone 7.1.2. Smartwatch CHAPTER 8. Global Online Picture Frames Market, By Application 8.1. Introduction 8.1.1. Passenger Car 8.1.2. Commercial Vehicle CHAPTER 10. Global Online Picture Frames Market, By Region 10.1. Introduction 10.2. NORTH AMERICA 10.2.1. North America: Market Size and Forecast, By Country, 2021 – 2030 ($ Million) 10.2.2. North America: Market Size and Forecast, By Type, 2021 – 2030 ($ Million) 10.2.3. North America: Market Size and Forecast, By Application, 2021 – 2030 ($ Million) 10.2.4. US 10.2.4.1. US: Market Size and Forecast, By Type, 2021 – 2030 ($ Million) 10.2.4.2. US: Market Size and Forecast, By Application, 2021 – 2030 ($ Million) 10.2.5. CANADA 10.2.5.1. Canada: Market Size and Forecast, By Type, 2021 – 2030 ($ Million) 10.2.5.2. Canada: Market Size and Forecast, By Application, 2021 – 2030 ($ Million) 10.2.6. MEXICO 10.2.6.1. Mexico: Market Size and Forecast, By Type, 2021 – 2030 ($ Million) 10.2.6.2. Mexico: Market Size and Forecast, By Application, 2021 – 2030 ($ Million) 10.3. Europe 10.3.1. Europe: Market Size and Forecast, By Country, 2021 – 2030 ($ Million) 10.3.2. Europe: Market Size and Forecast, By Type, 2021 – 2030 ($ Million) 10.3.3. Europe: Market Size and Forecast, By Application, 2021 – 2030 ($ Million) 10.3.4. U.K. 10.3.4.1. U.K.: Market Size and Forecast, By Type, 2021 – 2030 ($ Million) 10.3.4.2. U.K.: Market Size and Forecast, By Application, 2021 – 2030 ($ Million) 10.3.5. GERMANY 10.3.5.1. Germany: Market Size and Forecast, By Type, 2021 – 2030 ($ Million) 10.3.5.2. Germany: Market Size and Forecast, By Application, 2021 – 2030 ($ Million) 10.3.6. FRANCE 10.3.6.1. France: Market Size and Forecast, By Type, 2021 – 2030 ($ Million) 10.3.6.2. France: Market Size and Forecast, By Application, 2021 – 2030 ($ Million) 10.3.7. ITALY 10.3.7.1. Italy: Market Size and Forecast, By Type, 2021 – 2030 ($ Million) 10.3.7.2. Italy: Market Size and Forecast, By Application, 2021 – 2030 ($ Million) 10.3.8. SPAIN 10.3.8.1. Spain: Market Size and Forecast, By Type, 2021 – 2030 ($ Million) 10.3.8.2. Spain: Market Size and Forecast, By Application, 2021 – 2030 ($ Million) 10.3.9. BENELUX 10.3.9.1. BeNeLux: Market Size and Forecast, By Type, 2021 – 2030 ($ Million) 10.3.9.2. BeNeLux: Market Size and Forecast, By Application, 2021 – 2030 ($ Million) 10.3.10. RUSSIA 10.3.10.1. Russia: Market Size and Forecast, By Type, 2021 – 2030 ($ Million) 10.3.10.2. Russia: Market Size and Forecast, By Application, 2021 – 2030 ($ Million) 10.3.11. REST OF EUROPE 10.3.11.1. Rest of Europe: Market Size and Forecast, By Type, 2021 – 2030 ($ Million) 10.3.11.2. Rest of Europe: Market Size and Forecast, By Application, 2021 – 2030 ($ Million) 10.4. Asia Pacific 10.4.1. Asia Pacific: Market Size and Forecast, By Country, 2021 – 2030 ($ Million) 10.4.2. Asia Pacific: Market Size and Forecast, By Type, 2021 – 2030 ($ Million) 10.4.3. Asia Pacific: Market Size and Forecast, By Application, 2021 – 2030 ($ Million) 10.4.54 CHINA 10.4.4.1. China: Market Size and Forecast, By Type, 2021 – 2030 ($ Million) 10.4.4.2. China: Market Size and Forecast, By Application, 2021 – 2030 ($ Million) 10.4.5. JAPAN 10.4.5.1. Japan: Market Size and Forecast, By Type, 2021 – 2030 ($ Million) 10.4.5.2. Japan: Market Size and Forecast, By Application, 2021 – 2030 ($ Million) 10.4.6. INDIA 10.4.6.1. India: Market Size and Forecast, By Type, 2021 – 2030 ($ Million) 10.4.6.2. India: Market Size and Forecast, By Application, 2021 – 2030 ($ Million) 10.4.7. SOUTH KOREA 10.4.7.1. South Korea: Market Size and Forecast, By Type, 2021 – 2030 ($ Million) 10.4.7.2. South Korea: Market Size and Forecast, By Application, 2021 – 2030 ($ Million) 10.4.8. THAILAND 10.4.8.1. Thailand: Market Size and Forecast, By Type, 2021 – 2030 ($ Million) 10.4.8.2. Thailand: Market Size and Forecast, By Application, 2021 – 2030 ($ Million) 10.4.9. INDONESIA 10.4.9.1. Indonesia: Market Size and Forecast, By Type, 2021 – 2030 ($ Million) 10.4.9.2. Indonesia: Market Size and Forecast, By Application, 2021 – 2030 ($ Million) 10.4.10. MALAYSIA 10.4.10.1. Malaysia: Market Size and Forecast, By Type, 2021 – 2030 ($ Million) 10.4.10.2. Malaysia: Market Size and Forecast, By Application, 2021 – 2030 ($ Million) 10.4.11. AUSTRALIA 10.4.11.1. Australia: Market Size and Forecast, By Type, 2021 – 2030 ($ Million) 10.4.11.2. Australia: Market Size and Forecast, By Application, 2021 – 2030 ($ Million) 10.4.12. REST FO ASIA PACIFIC 10.4.12.1. Rest fo Asia Pacific: Market Size and Forecast, By Type, 2021 – 2030 ($ Million) 10.4.12.2. Rest fo Asia Pacific: Market Size and Forecast, By Application, 2021 – 2030 ($ Million) 10.5. South America 10.5.1. South America: Market Size and Forecast, By Country, 2021 – 2030 ($ Million) 10.5.2. South America: Market Size and Forecast, By Type, 2021 – 2030 ($ Million) 10.5.3. South America: Market Size and Forecast, By Application, 2021 – 2030 ($ Million) 10.5.4. BRAZIL 10.5.4.1. Brazil: Market Size and Forecast, By Type, 2021 – 2030 ($ Million) 10.5.4.2. Brazil: Market Size and Forecast, By Application, 2021 – 2030 ($ Million) 10.5.5. ARGENTINA 10.5.5.1. Argentina: Market Size and Forecast, By Type, 2021 – 2030 ($ Million) 10.5.5.2. Argentina: Market Size and Forecast, By Application, 2021 – 2030 ($ Million) 10.5.6. REST OF SOUTH AMERICA 10.5.6.1. Rest of South America: Market Size and Forecast, By Type, 2021 – 2030 ($ Million) 10.5.6.2. Rest of South America: Market Size and Forecast, By Application, 2021 – 2030 ($ Million) 10.6. Middle East & Africa 10.6.1. Middle East & Africa: Market Size and Forecast, By Country, 2021 – 2030 ($ Million) 10.6.2. Middle East & Africa: Market Size and Forecast, By Type, 2021 – 2030 ($ Million) 10.6.3. Middle East & Africa: Market Size and Forecast, By Application, 2021 – 2030 ($ Million) 10.6.4. SAUDI ARABIA 10.6.4.1. Saudi Arabia: Market Size and Forecast, By Type, 2021 – 2030 ($ Million) 10.6.4.2. Saudi Arabia: Market Size and Forecast, By Application, 2021 – 2030 ($ Million) 10.6.5. UAE 10.6.5.1. UAE: Market Size and Forecast, By Type, 2021 – 2030 ($ Million) 10.6.5.2. UAE: Market Size and Forecast, By Application, 2021 – 2030 ($ Million) 10.6.6. EGYPT 10.6.6.1. Egypt: Market Size and Forecast, By Type, 2021 – 2030 ($ Million) 10.6.6.2. Egypt: Market Size and Forecast, By Application, 2021 – 2030 ($ Million) 10.6.7. SOUTH AFRICA 10.6.7.1. South Africa: Market Size and Forecast, By Type, 2021 – 2030 ($ Million) 10.6.7.2. South Africa: Market Size and Forecast, By Application, 2021 – 2030 ($ Million) 10.6.8. REST OF MIDDLE EAST & AFRICA 10.6.8.1. Rest of Middle East & Africa: Market Size and Forecast, By Type, 2021 – 2030 ($ Million) 10.6.8.2. Rest of Middle East & Africa: Market Size and Forecast, By Application, 2021 – 2030 ($ Million) CHAPTER 12. Competitive Landscape 12.1. Competitior Benchmarking 2023 12.2. Market Share Analysis 12.3. Key Developments Analysis By Top 5 Companies 12.4. Market Share Acquisition Strategies: Analysis of Key Approaches Employed by Top Players CHAPTER 13. Company Profiles 13.1. Valeo 13.1.1. Business Overview 13.1.2. Financial Analysis 13.1.2.1. Business Segment Revenue, 2020, 2021, 2022, $ Million 13.1.2.2. Geographic Revenue Mix, 2022 (% Share) 13.1.3. Type Portfolio 13.1.4. Recent Development and Strategies Adopted 13.1.5. SWOT Analysis 13.2. Audi 13.3. Robert Bosch 13.4. Tesla 13.5. Continental AG 13.6. Car Chabi 13.7. BMW 13.8. Volkswagen 13.9. Hyundai 13.10. Thales Group
Connect to Analyst
Research Methodology

Our Most Viewed Report and gain instant expertise

Advanced Driver Assistance Systems (ADAS) Market Analysis and Global Forecast 2023-2033
All-Terrain Vehicle Market Analysis Analysis and Global Forecast 2023-2033

Automotive Fuel Cell Vehicle Market Analysis and Global Forecast 2023-2033
Automotive Glazing Market Analysis and Global Forecast 2023-2033
Automotive Powertrain Market Analysis and Global Forecast 2023-2033
Automotive Sensors Market Analysis and Global Forecast 2023-2033

