Vending Machine Market Analysis and Global Forecast 2024-2034

$ 1,390.00$ 5,520.00

Vending Machine Market Research Report: Information By Type (Beverages Vending Machine, Tobacco Vending Machine, Others Vending Machine, Food Vending Machine), By Application (Hotels and Restaurants, Corporate Offices, Public Places, Others), By Technology (Semi-Automatic Machine, Smart Machine, Automatic Machine), By Payment Mode (Cash and Cashless) and by Region — Forecast till 2034

Page: 165

Report Published on: April 11, 2025
$ 3,470.00
$ 5,520.00
$ 1,390.00
Report Code: EBI99978 Category:
Description

Vending Machine Market Overview

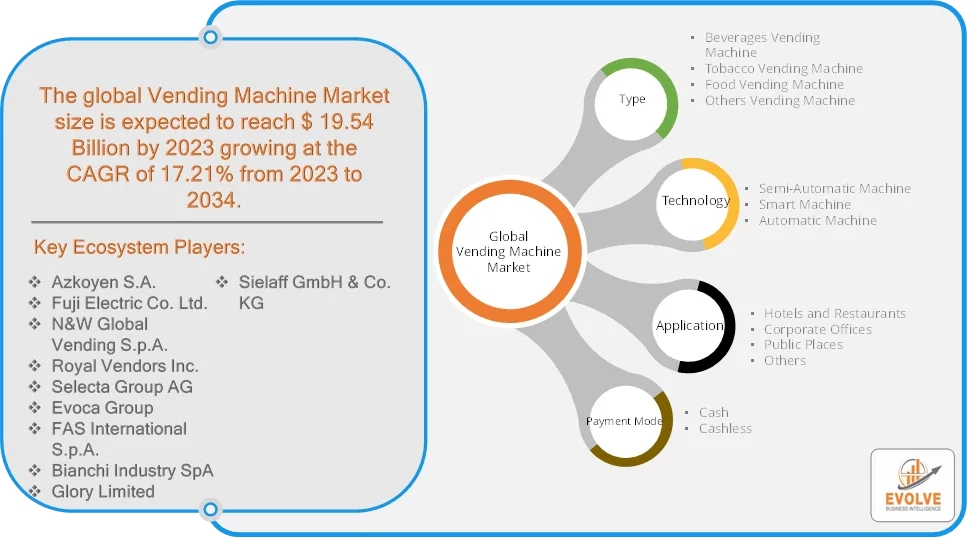
The Vending Machine Market size accounted for USD 19.54 Billion in 2023 and is estimated to account for 21.51 Billion in 2024. The Market is expected to reah USD 33.98 Billion by 2034 growing at a compound annual growth rate (CAGR) of 17.21% from 2024 to 2034. The global vending machine market is experiencing significant growth and transformation, driven by technological advancements, changing consumer lifestyles, and increasing demand for convenient and on-the-go solutions. Businesses are installing vending machines in offices, manufacturing facilities, hotels, and public places to enhance employee and customer convenience.

The vending machine market is poised for continued growth, driven by convenience, technological advancements, and expanding applications. Adapting to trends like smart machines, cashless payments, and healthier options will be crucial for businesses to succeed in this evolving landscape.

Global Vending Machine Market Synopsis

Vending Machine Market AnalysisVending Machine Market Dynamics

The major factors that have impacted the growth of Vending Machine Market are as follows:

Drivers:

Ø  Increasing Demand for Contactless & Cashless Transactions

Growing preference for digital payments (NFC, mobile wallets, QR codes, and credit/debit cards). COVID-19 accelerated the shift towards cashless vending machines for hygiene and convenience. Consumers seek quick and efficient purchasing options, especially in high-traffic locations like airports, offices, and metro stations. 24/7 availability of vending machines makes them a popular choice for busy lifestyles. AI-powered vending machines enable personalized recommendations based on user preferences and IoT integration allows real-time tracking of inventory and machine maintenance, reducing downtime.

Restraint:

  • High Initial Investment & Maintenance Costs

Advanced vending machines with smart features (AI, IoT, cashless payments) require a significant upfront investment. Regular maintenance and refilling add to operational costs, especially for machines in remote areas. Increased use of cashless payments exposes vending machines to cyber threats and hacking risks. Consumers may be hesitant to use digital payment systems if security measures are inadequate. Outdoor vending machines are prone to theft and damage, leading to financial losses for operators and additional security measures, such as surveillance cameras and tamper-proof designs, increase costs.

Opportunity:

⮚     Expansion of Smart & AI-Powered Vending Machines

AI-driven vending machines can analyze consumer behavior and offer personalized product recommendations. IoT integration enables real-time monitoring of inventory, reducing stockouts and improving operational efficiency. Voice-activated and touchscreen vending machines enhance the user experience. Consumers are shifting towards organic, gluten-free, and sugar-free snacks, creating demand for specialized vending machines and companies can partner with health brands to offer fresh salads, protein bars, and functional beverages and Vending machines equipped with digital screens can display advertisements, promotions, and interactive content to engage customers.

Vending Machine Market Segment Overview

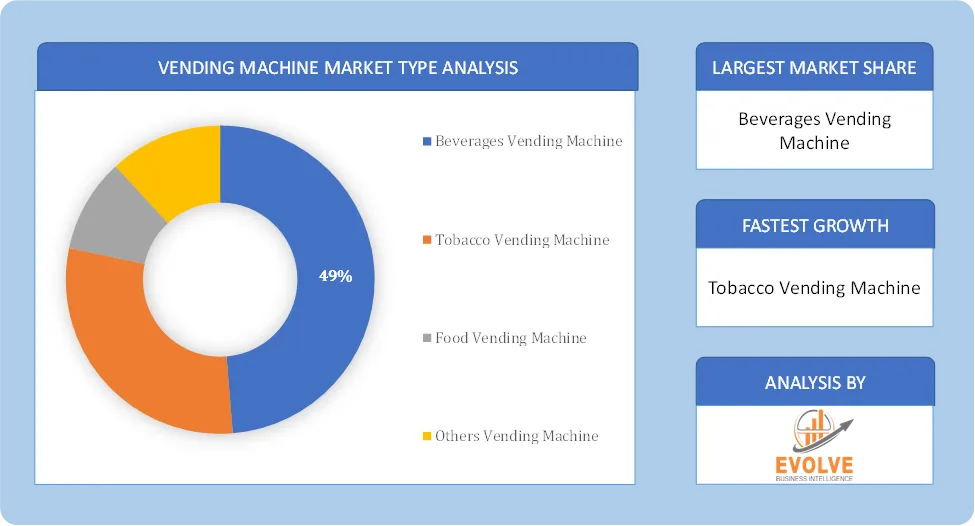
Vending Machine Market Type AnalysisBy Type

Based on Type, the market is segmented based on Beverages Vending Machine, Tobacco Vending Machine, Others Vending Machine, Food Vending Machine. The Beverages Vending Machine segment dominant the market. The beverages vending machines is leaning toward healthier choices, including low-sugar beverages, infused waters, and specialty coffees. Additionally, there’s a growing focus on letting customers customize their drink selections, allowing them to pick flavors, types of milk, and sugar levels. These trends reflect changing consumer preferences for healthier and more personalized drink options in the vending machine industry.

By Application

Based on Application, the market segment has been divided into Hotels and Restaurants, Corporate Offices, Public Places, Others. The Hotels and Restaurants segment dominant the market. The hotels and restaurants application category refers to the placement of vending machines within hospitality establishments to offer a range of snacks, beverages, and convenience items to guests. The trends in this sector include an increased emphasis on offering premium and customized vending options to enhance the guest experience.

By Technology

Based on Technology, the market segment has been divided into Semi-Automatic Machine, Smart Machine, Automatic Machine. The Automatic Machine segment dominant the market. Automatic vending machines constitute a substantial portion of the market for vending machines. These devices carry out tasks automatically. They usually offer a wide range of snacks, drinks, and convenience items with little user interaction. Automatic vending machines are common in companies, schools, and public spaces where product access is quick.

By Payment Mode

Based on Payment Mode, the market segment has been divided into Cash and Cashless. Cash segment dominant the market. Cash-based vending machines continue to hold a substantial market share, appealing to users who may not have access to digital payment options and those who prefer traditional payment methods. The cash-based segment continues to be especially prevalent in regions where currency transactions are more prevalent or where digital payment infrastructure is less developed.

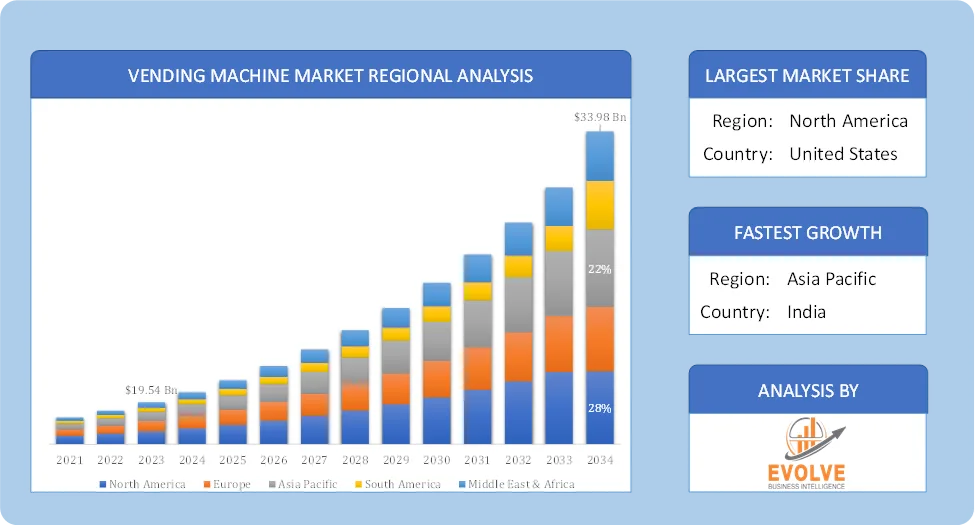
Global Vending Machine Market Regional Analysis

Based on region, the global Vending Machine Market has been divided into North America, Europe, Asia-Pacific, the Middle East & Africa, and Latin America. North America is projected to dominate the use of the Vending Machine Market followed by the Asia-Pacific and Europe regions.

Global Vending Machine Market Regional AnalysisNorth America Vending Machine Market

North America holds a dominant position in the Vending Machine Market. The United States is a key regional market and a particularly lucrative country, holding the largest market share within North America. Canada is also a significant and fast-growing market in the region. It widespread adoption of cashless payments, AI-powered machines, and smart vending solutions and demand for healthy snack vending machines is rising in workplaces, schools, and gyms.

Asia-Pacific Vending Machine Market

The Asia-Pacific region has indeed emerged as the fastest-growing market for the Vending Machine Market industry. Due to urbanization, rising disposable income, and tech adoption. Japan is a global leader in vending machines, offering everything from food to electronics. China and India are seeing a boom in cashless vending with QR code-based payments. It has high demand for automated retail and convenience shopping and integration of facial recognition & AI-powered vending solutions.

Competitive Landscape

The global Vending Machine Market is highly competitive, with numerous players offering a wide range of software solutions. The competitive landscape is characterized by the presence of established companies, as well as emerging startups and niche players. To increase their market position and attract a wide consumer base, the businesses are employing various strategies, such as product launches, and strategic alliances.

Prominent Players:

  • Azkoyen S.A.
  • Fuji Electric Co. Ltd.
  • N&W Global Vending S.p.A.
  • Royal Vendors Inc.
  • Selecta Group AG
  • Evoca Group
  • FAS International S.p.A.
  • Bianchi Industry SpA
  • Glory Limited
  • Sielaff GmbH & Co. KG.

Key Development

In December 2021, SandenVendo America, Inc. forged a partnership with Vendekin Technologies, a leading provider of diverse vending machine solutions. This collaboration empowers SandenVendo to integrate Vendekin’s intelligent vending machine controller, enhancing its product offerings and capabilities.

In March 2022, Fastcorp Vending LLC announcing a strategic alliance with ABsea Change Inc. This partnership is designed to accelerate the adoption of Fastcorp’s innovative smart vending platforms and technologies within the retail sector.

Scope of the Report

Global Vending Machine Market, by Type
  • Beverages Vending Machine
  • Tobacco Vending Machine
  • Food Vending Machine
  • Others Vending Machine
Global Vending Machine Market, by Technology
  • Semi-Automatic Machine
  • Smart Machine
  • Automatic Machine
Global Vending Machine Market, by Application
  • Hotels and Restaurants
  • Corporate Offices
  • Public Places
  • Others
Global Vending Machine Market, by Payment Mode
  • Cash
  • Cashless
Global Vending Machine Market, by Region
  • North America
    • US
    • Canada
    • Mexico
  • Europe
    • UK
    • Germany
    • France
    • Italy
    • Spain
    • Benelux
    • Nordic
    • Rest of Europe
  • Asia Pacific
    • China
    • Japan
    • South Korea
    • Indonesia
    • Austalia
    • Malaysia
    • India
    • Rest of Asia Pacific
  • South America
    • Brazil
    • Argentina
    • Rest of South America
  • Middle East & Africa
    • Saudi Arabia
    • UAE
    • Egypt
    • South Africa
    • Rest of Middle East & Africa


Parameters Indicators
Market Size 2034: USD 33.98 Billion
CAGR (2024-2034) 17.21%
Base year 2022
Forecast Period 2024-2034
Historical Data 2021 (2017 to 2020 On Demand)
Report Coverage Revenue Forecast, Competitive Landscape, Growth Factors, and Trends
Key Segmentations Type, Technology, Application, Payment Mode
Geographies Covered North America, Europe, Asia-Pacific, South America, Middle East, Africa
Key Vendors Azkoyen S.A., Fuji Electric Co. Ltd., N&W Global Vending S.p.A., Royal Vendors Inc., Selecta Group AG, Evoca Group, FAS International S.p.A., Bianchi Industry SpA, Glory Limited and Sielaff GmbH & Co. KG.
Key Market Opportunities ·       Expansion of Smart & AI-Powered Vending Machines

·        Rising Demand for Healthy & Organic Vending Options

Key Market Drivers ·       Increasing Demand for Contactless & Cashless Transactions

·       Rising Demand for Convenience & On-the-Go Consumption


REPORT CONTENT BRIEF:

  • High-level analysis of the current and future Vending Machine Market trends and opportunities
  • Detailed analysis of current market drivers, restraining factors, and opportunities in the future
  • Vending Machine Market historical market size for the year 2021, and forecast from 2023 to 2033
  • Vending Machine Market share analysis at each product level
  • Competitor analysis with detailed insight into its product segment, Government & Defense strength, and strategies adopted.
  • Identifies key strategies adopted including product launches and developments, mergers and acquisitions, joint ventures, collaborations, and partnerships as well as funding taken and investment done, among others.
  • To identify and understand the various factors involved in the global Vending Machine Market affected by the pandemic
  • To provide a detailed insight into the major companies operating in the market. The profiling will include the Government & Defense health of the company’s past 2-3 years with segmental and regional revenue breakup, product offering, recent developments, SWOT analysis, and key strategies.

Frequently Asked Questions (FAQ)

The global Vending Machine Market is growing at a CAGR of 17.21% over the next 10 years

Asia Pacific is expected to register the highest CAGR during 2024-2034

Azkoyen S.A., Fuji Electric Co. Ltd., N&W Global Vending S.p.A., Royal Vendors Inc., Selecta Group AG, Evoca Group, FAS International S.p.A., Bianchi Industry SpA, Glory Limited and Sielaff GmbH & Co. KG. are the major companies operating in the market.

Yes, we offer 16 hours of analyst support to solve the queries

Yes, we provide regional as well as country-level reports. Other than this we also provide a sectional report. Please get in contact with our sales representatives.

For more details mail us at

Ask a question / additional requirement

Table of Content

Table of Content

CHAPTER 1. Executive Summary CHAPTER 2. Scope of the Study 2.1. Market Definition 2.2. Market Scope & Segmentation 2.2.1. Objective of Report CHAPTER 3. Evolve BI Methodology 3.1. Data Collection & Validation Approach 3.2. Market Size Estimation and Forecast CHAPTER 4. Exclusive Analysis 4.1. Market Opportunity Score 4.1.1. Type Segement – Market Opportunity Score 4.1.2. Technology Segment – Market Opportunity Score 4.1.3. Application Segment – Market Opportunity Score 4.1.4. Payment Mode Segment – Market Opportunity Score 4.2. Key Market Influencing Indicators CHAPTER 5. Market Insights and Trends 5.1. Value Chain Analysis 5.1.1. Raw Material 5.1.2. Manufacturing Process 5.1.3. Distribution Channel 5.1.4. End User 5.2. Porter’s Five Forces Analysis 5.2.1. Bargaining Power of Buyers 5.2.2. Bargaining Power of Suppliers 5.2.3. Threat of New Entrant 5.2.4. Threat of Substitute 5.2.5. Industry Rivalry 5.3. COVID-19 Impact and Post COVID Scenario on Vending Machine Market 5.3.1. Impact of COVID-19 5.3.2. Government Support and Industry Revival Policies 5.3.3. Measures Taken by Companies to Mitigate Negative Impact 5.3.4. Post COVID Trend CHAPTER 6. MArket Dynamics 6.1. Introduction 6.2. Drivers 6.2.1. Driver 1 6.2.2. Driver 2 6.2.3. Driver 3 6.3. Restraints 6.3.1. Restraint 1 6.3.2. Restraint 2 6.4. Opportunity 6.4.1. Opportunity 1 CHAPTER 7. Vending Machine Market, By Technology 7.1. Introduction 7.1.1. Semi-Automatic Machine 7.1.2. Smart Machine 7.1.3. Automatic Machine CHAPTER 8. Vending Machine Market, By Type 8.1. Introduction 8.1.1. Beverages Vending Machine 8.1.2. Tobacco Vending Machine 8.1.3. Others Vending Machine 8.1.4. Food Vending Machine CHAPTER 9. Vending Machine Market, By Application 9.1. Introduction 9.1.1. Hotels and Restaurants 9.1.2. Corporate Offices 9.1.3. Public Places 9.1.4. Others CHAPTER 10. Vending Machine Market, By Payment Mode 10.1.Introduction 10.1.1. Cash 10.1.2. Cashless CHAPTER 11. Vending Machine Market, By Region 11.1. Introduction 11.2. NORTH AMERICA 11.2.1. North America: Market Size and Forecast, By Country, 2024 – 2034 ($ Million) 11.2.2. North America: Market Size and Forecast, By Technology, 2024 – 2034 ($ Million) 11.2.3. North America: Market Size and Forecast, By Type, 2024 – 2034 ($ Million) 11.2.4. North America: Market Size and Forecast, By Application, 2024 – 2034 ($ Million) 11.2.5. North America: Market Size and Forecast, By Payment Mode, 2024 – 2034 ($ Million) 11.2.6. US 11.2.6.1. US: Market Size and Forecast, By Technology, 2024 – 2034 ($ Million) 11.2.6.2. US: Market Size and Forecast, By Type, 2024 – 2034 ($ Million) 11.2.6.3. US: Market Size and Forecast, By Application, 2024 – 2034 ($ Million) 11.2.6.4. US: Market Size and Forecast, By Payment Mode, 2024 – 2034 ($ Million) 11.2.7. CANADA 11.2.7.1. Canada: Market Size and Forecast, By Technology, 2024 – 2034 ($ Million) 11.2.7.2. Canada: Market Size and Forecast, By Type, 2024 – 2034 ($ Million) 11.2.7.3. Canada: Market Size and Forecast, By Application, 2024 – 2034 ($ Million) 11.2.7.4. Canada: Market Size and Forecast, By Payment Mode, 2024 – 2034 ($ Million) 11.2.8. MEXICO 11.2.8.1. Mexico: Market Size and Forecast, By Technology, 2024 – 2034 ($ Million) 11.2.8.2. Mexico: Market Size and Forecast, By Type, 2024 – 2034 ($ Million) 11.2.8.3. Mexico: Market Size and Forecast, By Application, 2024 – 2034 ($ Million) 11.2.8.4. Mexico: Market Size and Forecast, By Payment Mode, 2024 – 2034 ($ Million) 11.3. Europe 11.3.1. Europe: Market Size and Forecast, By Country, 2024 – 2034 ($ Million) 11.3.2. Europe: Market Size and Forecast, By Technology, 2024 – 2034 ($ Million) 11.3.3. Europe: Market Size and Forecast, By Type, 2024 – 2034 ($ Million) 11.3.4. Europe: Market Size and Forecast, By Application, 2024 – 2034 ($ Million) 11.3.5. Europe: Market Size and Forecast, By Payment Mode, 2024 – 2034 ($ Million) 11.3.6. U.K. 11.3.6.1. U.K.: Market Size and Forecast, By Technology, 2024 – 2034 ($ Million) 11.3.6.2. U.K.: Market Size and Forecast, By Type, 2024 – 2034 ($ Million) 11.3.6.3. U.K.: Market Size and Forecast, By Application, 2024 – 2034 ($ Million) 11.3.6.4. U.K.: Market Size and Forecast, By Payment Mode, 2024 – 2034 ($ Million) 11.3.7. GERMANY 11.3.7.1. Germany: Market Size and Forecast, By Technology, 2024 – 2034 ($ Million) 11.3.7.2. Germany: Market Size and Forecast, By Type, 2024 – 2034 ($ Million) 11.3.7.3. Germany: Market Size and Forecast, By Application, 2024 – 2034 ($ Million) 11.3.7.4. Germany: Market Size and Forecast, By Payment Mode, 2024 – 2034 ($ Million) 11.3.8. FRANCE 11.3.8.1. France: Market Size and Forecast, By Technology, 2024 – 2034 ($ Million) 11.3.8.2. France: Market Size and Forecast, By Type, 2024 – 2034 ($ Million) 11.3.8.3. France: Market Size and Forecast, By Application, 2024 – 2034 ($ Million) 11.3.8.4. France: Market Size and Forecast, By Payment Mode, 2024 – 2034 ($ Million) 11.3.9. ITALY 11.3.9.1. Italy: Market Size and Forecast, By Technology, 2024 – 2034 ($ Million) 11.3.9.2. Italy: Market Size and Forecast, By Type, 2024 – 2034 ($ Million) 11.3.9.3. Italy: Market Size and Forecast, By Application, 2024 – 2034 ($ Million) 11.3.9.4. Italy: Market Size and Forecast, By Payment Mode, 2024 – 2034 ($ Million) 11.3.10. SPAIN 11.3.10.1. Spain: Market Size and Forecast, By Technology, 2024 – 2034 ($ Million) 11.3.10.2. Spain: Market Size and Forecast, By Type, 2024 – 2034 ($ Million) 11.3.10.3. Spain: Market Size and Forecast, By Application, 2024 – 2034 ($ Million) 11.3.10.4. Spain: Market Size and Forecast, By Payment Mode, 2024 – 2034 ($ Million) 11.3.11. BENELUX 11.3.11.1. BeNeLux: Market Size and Forecast, By Technology, 2024 – 2034 ($ Million) 11.3.11.2. BeNeLux: Market Size and Forecast, By Type, 2024 – 2034 ($ Million) 11.3.11.3. BeNeLux: Market Size and Forecast, By Application, 2024 – 2034 ($ Million) 11.3.11.4. BeNeLux: Market Size and Forecast, By Payment Mode, 2024 – 2034 ($ Million) 11.3.12. RUSSIA 11.3.12.1. Russia: Market Size and Forecast, By Technology, 2024 – 2034 ($ Million) 11.3.12.2. Russia: Market Size and Forecast, By Type, 2024 – 2034 ($ Million) 11.3.12.3. Russia: Market Size and Forecast, By Application, 2024 – 2034 ($ Million) 11.3.12.4. Russia: Market Size and Forecast, By Payment Mode, 2024 – 2034 ($ Million) 11.3.13. REST OF EUROPE 11.3.13.1. Rest of Europe: Market Size and Forecast, By Technology, 2024 – 2034 ($ Million) 11.3.13.2. Rest of Europe: Market Size and Forecast, By Type, 2024 – 2034 ($ Million) 11.3.13.3. Rest of Europe: Market Size and Forecast, By Application, 2024 – 2034 ($ Million) 11.3.13.4. Rest of Europe: Market Size and Forecast, By Payment Mode, 2024 – 2034 ($ Million) 11.4. Asia Pacific 11.4.1. Asia Pacific: Market Size and Forecast, By Country, 2024 – 2034 ($ Million) 11.4.2. Asia Pacific: Market Size and Forecast, By Technology, 2024 – 2034 ($ Million) 11.4.3. Asia Pacific: Market Size and Forecast, By Type, 2024 – 2034 ($ Million) 11.4.4. Asia Pacific: Market Size and Forecast, By Application, 2024 – 2034 ($ Million) 11.4.5. Asia Pacific: Market Size and Forecast, By Payment Mode, 2024 – 2034 ($ Million) 11.4.6. CHINA 11.4.6.1. China: Market Size and Forecast, By Technology, 2024 – 2034 ($ Million) 11.4.6.2. China: Market Size and Forecast, By Type, 2024 – 2034 ($ Million) 11.4.6.3. China: Market Size and Forecast, By Application, 2024 – 2034 ($ Million) 11.4.6.4. China: Market Size and Forecast, By Payment Mode, 2024 – 2034 ($ Million) 11.4.7. JAPAN 11.4.7.1. Japan: Market Size and Forecast, By Technology, 2024 – 2034 ($ Million) 11.4.7.2. Japan: Market Size and Forecast, By Type, 2024 – 2034 ($ Million) 11.4.7.3. Japan: Market Size and Forecast, By Application, 2024 – 2034 ($ Million) 11.4.7.4. Japan: Market Size and Forecast, By Payment Mode, 2024 – 2034 ($ Million) 11.4.8. INDIA 11.4.8.1. India: Market Size and Forecast, By Technology, 2024 – 2034 ($ Million) 11.4.8.2. India: Market Size and Forecast, By Type, 2024 – 2034 ($ Million) 11.4.8.3. India: Market Size and Forecast, By Application, 2024 – 2034 ($ Million) 11.4.8.4. India: Market Size and Forecast, By Payment Mode, 2024 – 2034 ($ Million) 11.4.9. SOUTH KOREA 11.4.9.1. South Korea: Market Size and Forecast, By Technology, 2024 – 2034 ($ Million) 11.4.9.2. South Korea: Market Size and Forecast, By Type, 2024 – 2034 ($ Million) 11.4.9.3. South Korea: Market Size and Forecast, By Application, 2024 – 2034 ($ Million) 11.4.9.4. South Korea: Market Size and Forecast, By Payment Mode, 2024 – 2034 ($ Million) 11.4.10. THAILAND 11.4.10.1. Thailand: Market Size and Forecast, By Technology, 2024 – 2034 ($ Million) 11.4.10.2. Thailand: Market Size and Forecast, By Type, 2024 – 2034 ($ Million) 11.4.10.3. Thailand: Market Size and Forecast, By Application, 2024 – 2034 ($ Million) 11.4.10.4. Thailand: Market Size and Forecast, By Payment Mode, 2024 – 2034 ($ Million) 11.4.11. INDONESIA 11.4.11.1. Indonesia: Market Size and Forecast, By Technology, 2024 – 2034 ($ Million) 11.4.11.2. Indonesia: Market Size and Forecast, By Type, 2024 – 2034 ($ Million) 11.4.11.3. Indonesia: Market Size and Forecast, By Application, 2024 – 2034 ($ Million) 11.4.11.4. Indonesia: Market Size and Forecast, By Payment Mode, 2024 – 2034 ($ Million) 11.4.12. MALAYSIA 11.4.12.1. Malaysia: Market Size and Forecast, By Technology, 2024 – 2034 ($ Million) 11.4.12.2. Malaysia: Market Size and Forecast, By Type, 2024 – 2034 ($ Million) 11.4.12.3. Malaysia: Market Size and Forecast, By Application, 2024 – 2034 ($ Million) 11.4.12.4. Malaysia: Market Size and Forecast, By Payment Mode, 2024 – 2034 ($ Million) 11.4.13. AUSTRALIA 11.4.13.1. Australia: Market Size and Forecast, By Technology, 2024 – 2034 ($ Million) 11.4.13.2. Australia: Market Size and Forecast, By Type, 2024 – 2034 ($ Million) 11.4.13.3. Australia: Market Size and Forecast, By Application, 2024 – 2034 ($ Million) 11.4.13.4. Australia: Market Size and Forecast, By Payment Mode, 2024 – 2034 ($ Million) 11.4.14. REST FO ASIA PACIFIC 11.4.14.1. Rest fo Asia Pacific: Market Size and Forecast, By Technology, 2024 – 2034 ($ Million) 11.4.14.2. Rest fo Asia Pacific: Market Size and Forecast, By Type, 2024 – 2034 ($ Million) 11.4.14.3. Rest fo Asia Pacific: Market Size and Forecast, By Application, 2024 – 2034 ($ Million) 11.4.14.4. Rest fo Asia Pacific: Market Size and Forecast, By Payment Mode, 2024 – 2034 ($ Million) 11.5. South America 11.5.1. South America: Market Size and Forecast, By Country, 2024 – 2034 ($ Million) 11.5.2. South America: Market Size and Forecast, By Technology, 2024 – 2034 ($ Million) 11.5.3. South America: Market Size and Forecast, By Type, 2024 – 2034 ($ Million) 11.5.4. South America: Market Size and Forecast, By Application, 2024 – 2034 ($ Million) 11.5.5. South America: Market Size and Forecast, By Payment Mode, 2024 – 2034 ($ Million) 11.5.6. BRAZIL 11.5.6.1. Brazil: Market Size and Forecast, By Technology, 2024 – 2034 ($ Million) 11.5.6.2. Brazil: Market Size and Forecast, By Type, 2024 – 2034 ($ Million) 11.5.6.3. Brazil: Market Size and Forecast, By Application, 2024 – 2034 ($ Million) 11.5.6.4. Brazil: Market Size and Forecast, By Payment Mode, 2024 – 2034 ($ Million) 11.5.7. ARGENTINA 11.5.7.1. Argentina: Market Size and Forecast, By Technology, 2024 – 2034 ($ Million) 11.5.7.2. Argentina: Market Size and Forecast, By Type, 2024 – 2034 ($ Million) 11.5.7.3. Argentina: Market Size and Forecast, By Application, 2024 – 2034 ($ Million) 11.5.7.4. Argentina: Market Size and Forecast, By Payment Mode, 2024 – 2034 ($ Million) 11.5.8. REST OF SOUTH AMERICA 11.5.8.1. Rest of South America: Market Size and Forecast, By Technology, 2024 – 2034 ($ Million) 11.5.8.2. Rest of South America: Market Size and Forecast, By Type, 2024 – 2034 ($ Million) 11.5.8.3. Rest of South America: Market Size and Forecast, By Application, 2024 – 2034 ($ Million) 11.5.8.4. Rest of South America: Market Size and Forecast, By Payment Mode, 2024 – 2034 ($ Million) 11.6. Middle East & Africa 11.6.1. Middle East & Africa: Market Size and Forecast, By Country, 2024 – 2034 ($ Million) 11.6.2. Middle East & Africa: Market Size and Forecast, By Technology, 2024 – 2034 ($ Million) 11.6.3. Middle East & Africa: Market Size and Forecast, By Type, 2024 – 2034 ($ Million) 11.6.4. Middle East & Africa: Market Size and Forecast, By Application, 2024 – 2034 ($ Million) 11.6.5. Middle East & Africa: Market Size and Forecast, By Payment Mode, 2024 – 2034 ($ Million) 11.6.6. SAUDI ARABIA 11.6.6.1. Saudi Arabia: Market Size and Forecast, By Technology, 2024 – 2034 ($ Million) 11.6.6.2. Saudi Arabia: Market Size and Forecast, By Type, 2024 – 2034 ($ Million) 11.6.6.3. Saudi Arabia: Market Size and Forecast, By Application, 2024 – 2034 ($ Million) 11.6.6.4. Saudi Arabia: Market Size and Forecast, By Payment Mode, 2024 – 2034 ($ Million) 11.6.7. UAE 11.6.7.1. UAE: Market Size and Forecast, By Technology, 2024 – 2034 ($ Million) 11.6.7.2. UAE: Market Size and Forecast, By Type, 2024 – 2034 ($ Million) 11.6.7.3. UAE: Market Size and Forecast, By Application, 2024 – 2034 ($ Million) 11.6.7.4. UAE: Market Size and Forecast, By Payment Mode, 2024 – 2034 ($ Million) 11.6.8. EGYPT 11.6.8.1. Egypt: Market Size and Forecast, By Technology, 2024 – 2034 ($ Million) 11.6.8.2. Egypt: Market Size and Forecast, By Type, 2024 – 2034 ($ Million) 11.6.8.3. Egypt: Market Size and Forecast, By Application, 2024 – 2034 ($ Million) 11.6.8.4. Egypt: Market Size and Forecast, By Payment Mode, 2024 – 2034 ($ Million) 11.6.9. SOUTH AFRICA 11.6.9.1. South Africa: Market Size and Forecast, By Technology, 2024 – 2034 ($ Million) 11.6.9.2. South Africa: Market Size and Forecast, By Type, 2024 – 2034 ($ Million) 11.6.9.3. South Africa: Market Size and Forecast, By Application, 2024 – 2034 ($ Million) 11.6.9.4. South Africa: Market Size and Forecast, By Payment Mode, 2024 – 2034 ($ Million) 11.6.10. REST OF MIDDLE EAST & AFRICA 11.6.10.1. Rest of Middle East & Africa: Market Size and Forecast, By Technology, 2024 – 2034 ($ Million) 11.6.10.2. Rest of Middle East & Africa: Market Size and Forecast, By Type, 2024 – 2034 ($ Million) 11.6.10.3. Rest of Middle East & Africa: Market Size and Forecast, By Application, 2024 – 2034 ($ Million) 11.6.10.4. Rest of Middle East & Africa: Market Size and Forecast, By Payment Mode, 2024 – 2034 ($ Million) CHAPTER 12. Competitive Landscape 12.1. Competitior Benchmarking 2024 12.2. Market Share Analysis 12.3. Key Developments Analysis By Top 5 Companies 12.4. Market Share Acquisition Strategies: Analysis of Key Approaches Employed by Top Players CHAPTER 13. Company Profiles 13.1. Azkoyen S.A. 13.1.1. Business Overview 13.1.2. Financial Analysis 13.1.2.1. Business Segment Revenue, 2018, 2019, 2020, $ Million 13.1.2.2. Geographic Revenue Mix, 2020 (% Share) 13.1.3. Product Portfolio 13.1.4. Recent Development and Strategies Adopted 13.1.5. SWOT Analysis 13.2. Fuji Electric Co. Ltd. 13.3. N&W Global Vending S.p.A. 13.4. Royal Vendors Inc. 13.5. Selecta Group AG 13.6. Evoca Group 13.7. FAS International S.p.A. 13.8. Bianchi Industry SpA 13.9. Glory Limited 13.10. Sielaff GmbH & Co. KG.
Connect to Analyst

Connect to Analyst

Research Methodology

Research Methodology