Smart Meter Market Analysis and Global Forecast 2023-2033
$ 1,390.00 – $ 5,520.00Price range: $ 1,390.00 through $ 5,520.00
Smart Meter Market Research Report: Information By Product (Smart Electricity Meter, Smart Gas Meter, and Smart Water Meter) By End Use (Residential, Commercial, Industrial), and By Region — Forecast till 2033
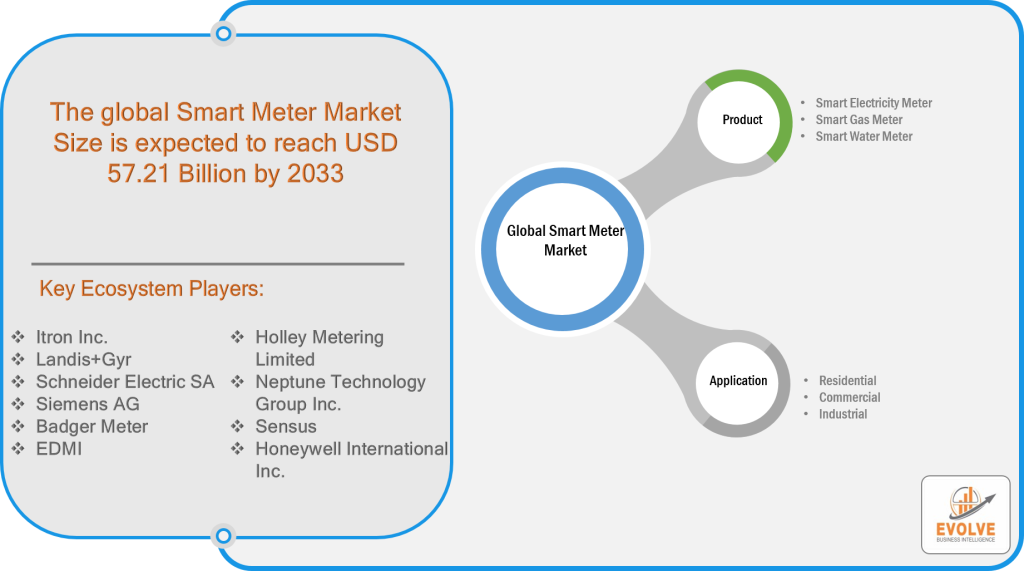
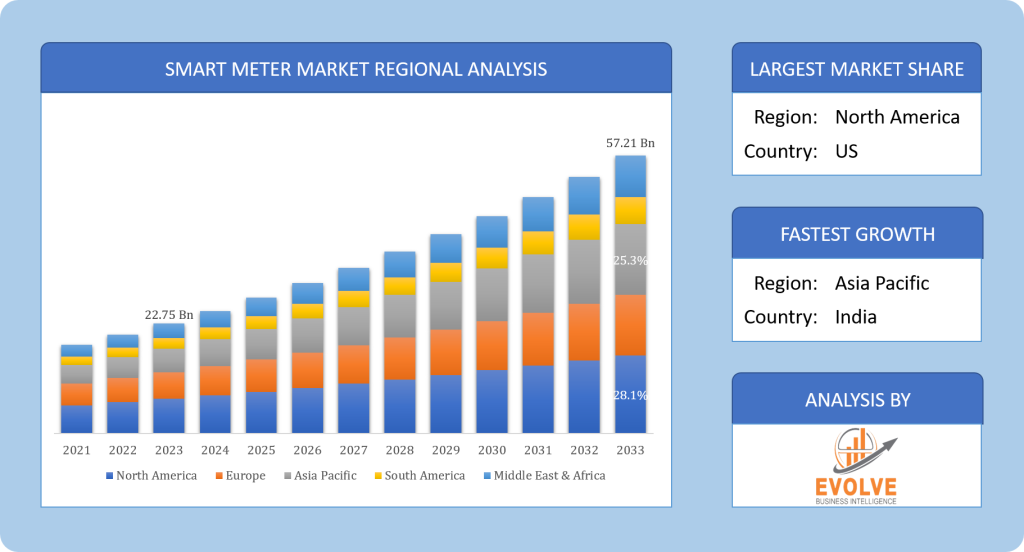
The global Smart Meter Market Size is expected to reach USD 57.21 Billion by 2033. The global Smart Meter industry size accounted for USD 22.75 Billion in 2023 and is expected to expand at a compound annual growth rate (CAGR) of 9.66% from 2023 to 2033. The Smart Meter Market has witnessed significant growth in recent years, driven by the increasing need for efficient energy management and the integration of advanced technologies. Smart meters are digital devices that measure, record, and communicate energy consumption data to utility companies and consumers in real-time. They provide a range of benefits, including accurate billing, enhanced monitoring capabilities, and improved energy efficiency. With applications across electricity, gas, and water sectors, smart meters are transforming the way energy is consumed and managed.
Global Smart Meter Market Synopsis
COVID-19 Impact Analysis
The COVID-19 pandemic had a profound impact on various industries, and the smart meter market was no exception. During the lockdowns, the installation of smart meters faced delays due to restrictions on physical access to premises. Additionally, economic uncertainties and reduced consumer spending led to a temporary dcline in market growth. However, as the world transitions into a post-pandemic scenario, the smart meter market is expected to regain momentum. The increasing focus on digitalization and the need for remote monitoring solutions have accelerated the demand for smart meters.
Smart Meter Market Dynamics
The major factors that have impacted the growth of Smart Meter are as follows:
Drivers:
Growing Emphasis on Energy Conservation
One of the key driving factors for the smart meter market is the growing emphasis on energy conservation. As governments, organizations, and consumers become increasingly aware of the environmental impact of energy consumption, there is a rising demand for technologies that enable sustainable practices. Smart meters play a vital role in this regard by providing real-time insights into energy usage, allowing consumers to make informed decisions about their consumption patterns. By promoting energy conservation, smart meters contribute to reducing carbon footprints and fostering a greener future.
Restraint:
- High Initial Deployment Costs
Despite their numerous benefits, the high initial deployment costs associated with smart meters pose a significant challenge to market penetration. The installation and infrastructure expenses, including retrofitting existing systems and implementing communication networks, can be substantial. These costs are particularly burdensome for residential consumers and small-scale businesses. As a result, the adoption of smart meters may be limited in certain regions or demographics, hindering the overall market growth. However, ongoing advancements in technology and economies of scale are gradually reducing these barriers.
Opportunity:
⮚ Expanding End Uses and Product Innovation
An opportunity factor that holds immense potential for the smart meter market is the integration with the Internet of Things (IoT). Smart meters can be connected to IoT platforms, enabling seamless communication and data exchange between various devices. This integration opens up possibilities for innovative applications such as demand response systems, smart grids, and home automation. By harnessing the power of IoT, smart meters can optimize energy usage, improve grid stability, and enhance the overall efficiency of energy management systems.
Smart Meter Segment Overview
By Product
Based on the Product, the market is segmented based on Smart Electricity Meter, Smart Gas Meter, and Smart Water Meter. smart electricity meters currently hold the largest market share, owing to the increasing focus on electricity consumption monitoring and demand management. In terms of end-use, the market serves residential, commercial, and industrial sectors. The residential segment is anticipated to witness substantial growth due to the rising need for energy conservation and the implementation of smart home solutions.
By End Use
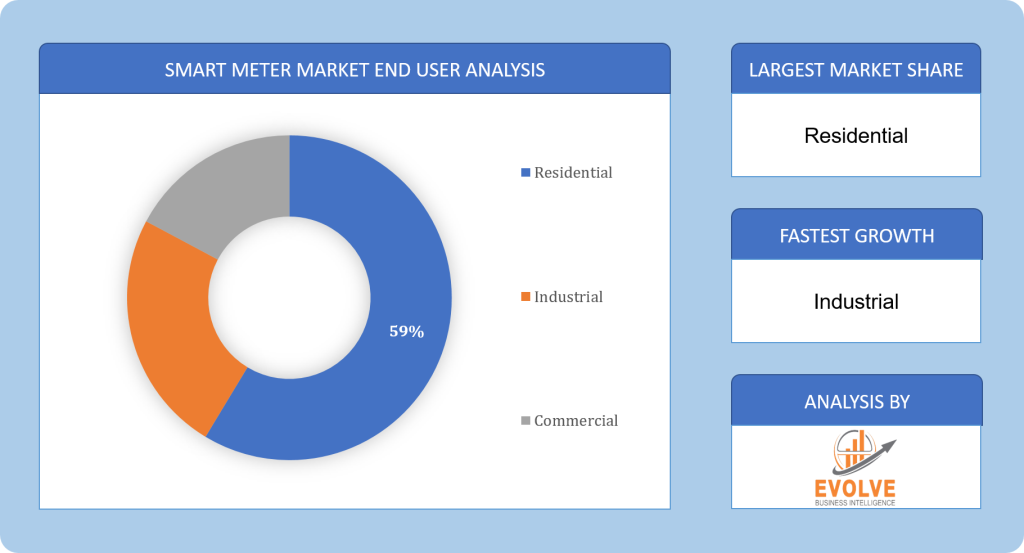
 Based on End Use, the market has been divided into Residential, Commercial, and and Industrial. the residential sector currently holds the largest share in the smart meter market. The increasing focus on energy conservation and sustainable practices has propelled the adoption of smart meters in residential buildings. These meters enable homeowners to monitor their energy consumption in real-time, identify energy-saving opportunities, and make informed decisions regarding their usage patterns. By providing accurate data and personalized insights, smart meters empower individuals to actively participate in energy conservation efforts, resulting in reduced energy bills and environmental impact.
Global Smart Meter Market Regional Analysis
Based on region, the global Smart Meter market has been divided into North America, Europe, Asia-Pacific, South America and Middle East & Africa. North America is projected to dominate the use of the market followed by the Europe and Asia-Pacific regions.
North America Market
North America has emerged as a prominent market for smart meters, driven by favorable government initiatives and regulations promoting energy efficiency. The United States, in particular, has witnessed widespread deployment of smart meters across residential, commercial, and industrial sectors. Initiatives such as the Energy Policy Act of 2005 and the Smart Grid Investment Grant program have incentivized utility companies to invest in smart meter infrastructure. Furthermore, the region’s well-established energy infrastructure and advanced communication networks have facilitated the seamless integration of smart meters. As a result, North America is expected to continue experiencing substantial growth in the smart meter market.
Asia Pacific Market
Asia Pacific, with its rapidly growing economies and increasing energy demand, presents significant opportunities for the smart meter market. Countries such as China, Japan, South Korea, and India are witnessing a surge in infrastructure development and urbanization. Governments in the region are actively promoting energy conservation and the adoption of smart grid technologies. China, in particular, has witnessed widespread deployment of smart meters, driven by the government’s emphasis on energy efficiency and grid modernization. Additionally, the region’s large population and rising middle class contribute to the growing demand for smart meters in residential and commercial sectors. As the region continues to invest in smart grid infrastructure and urban development, the smart meter market in Asia Pacific is poised for robust growth.
Competitive Landscape
The global Smart Meter market is highly competitive, with numerous players offering a wide range of software solutions. The competitive landscape is characterized by the presence of established companies, as well as emerging startups and niche players. To increase their market position and attract a wide consumer base, the businesses are employing various strategies, such as product launches, and strategic alliances.
Prominent Players:
- Itron Inc.
- Landis+Gyr
- Schneider Electric SA
- Siemens AG
- Badger Meter
- EDMI
- Holley Metering Limited
- Neptune Technology Group Inc.
- Sensus
- Honeywell International Inc.
Key Development:
June 2021: Itron Inc. has realized SAP certification for its interface software ISAIM 2.0 for Itron Enterprise Edition’s (IEE) Meter Data Management System (MDMS). The integration helps utilities to decrease the total cost of ownership and lower project implementation costs.
Scope of the Report
Global Smart Meter Market, by Product
- Smart Electricity Meter
- Smart Gas Meter
- Smart Water Meter
Global Smart Meter Market, by End Use
- Residential
- Commercial
- Industrial
Global Smart Meter Market, by Region
- North America
- US
- Canada
- Mexico
- Europe
- UK
- Germany
- France
- Italy
- Spain
- Benelux
- Nordic
- Rest of Europe
- Asia Pacific
- China
- Japan
- South Korea
- Indonesia
- Australia
- Malaysia
- India
- Rest of Asia Pacific
- South America
- Brazil
- Argentina
- Rest of SouthAmerica
- Middle East &Africa
- Saudi Arabia
- UAE
- Egypt
- SouthAfrica
- Rest of Middle East & Africa
| Parameters | Indicators |
|---|---|
| Market Size | 2033: $57.21 Billion |
| CAGR | 9.66% CAGR (2023-2033) |
| Base year | 2022 |
| Forecast Period | 2023-2033 |
| Historical Data | 2021 |
| Report Coverage | Revenue Forecast, Competitive Landscape, Growth Factors, and Trends |
| Key Segmentations | Product, End Use |
| Geographies Covered | North America, Europe, Asia-Pacific, Latin America, Middle East, Africa |
| Key Vendors | Itron Inc., Landis+Gyr, Schneider Electric SA, Siemens AG, Badger Meter, EDMI, Holley Metering Limited, Neptune Technology Group Inc., Sensus, and Honeywell International Inc. |
| Key Market Opportunities | Integration with Internet of Things (IoT) |
| Key Market Drivers | Growing Emphasis on Energy Conservation |
REPORT CONTENT BRIEF:
- High-level analysis of the current and future Smart Meter market trends and opportunities
- Detailed analysis of current market drivers, restraining factors, and opportunities in the future
- Smart Meter market historical market size for the year 2021, and forecast from 2023 to 2033
- Smart Meter market share analysis at each product level
- Competitor analysis with a detailed insight into its product segment, Commercial Use strength, and strategies adopted.
- Identifies key strategies adopted including product launches and developments, mergers and acquisitions, joint ventures, collaborations, and partnerships as well as funding taken and investment done, among others.
- To identify and understand the various factors involved in the global Smart Meter market affected by the pandemic
- To provide a detailed insight into the major companies operating in the market. The profiling will include the Commercial Use health of the company’s past 2-3 years with segmental and regional revenue breakup, product offering, recent developments, SWOT analysis, and key strategies.
Press Release

Global Pharmaceutical Manufacturing Market to Reach $1.38 Trillion by 2035 with 7.35% CAGR, New Research Shows

The Global Mammography Market Is Estimated To Record a CAGR of Around 10.29% During The Forecast Period

Glue Stick Market to Reach USD 2.35 Billion by 2034

Podiatry Service Market to Reach USD 11.88 Billion by 2034

Microfluidics Technology Market to Reach USD 32.58 Billion by 2034

Ferric Chloride Market to Reach USD 10.65 Billion by 2034

Family Practice EMR Software Market to Reach USD 21.52 Billion by 2034

Electric Hairbrush Market to Reach USD 15.95 Billion by 2034

Daily Bamboo Products Market to Reach USD 143.52 Billion by 2034

Cross-border E-commerce Logistics Market to Reach USD 112.65 Billion by 2034
Frequently Asked Questions (FAQ)
What is the study period of this market?
The study period of the global Smart Meter market is 2021- 2033
What is the growth rate of the global Smart Meter market?
The global Smart Meter market is growing at a CAGR of 11.5% over the next 10 years
Which region has the highest growth rate in the market of Smart Meter?
North America is expected to register the highest CAGR during 2023-2033
Which region has the largest share of the global Smart Meter market?
Asia Pacific holds the largest share in 2022
Who are the key players in the global Smart Meter market?
Itron Inc., Landis+Gyr, Schneider Electric SA, Siemens AG, Badger Meter, EDMI, Holley Metering Limited, Neptune Technology Group Inc., Sensus, and Honeywell International Inc. the major companies operating in the market.
Do you offer Post Sale Support?
Yes, we offer 16 hours of analyst support to solve the queries
Table of Content
Chapter 1. Executive Summary Chapter 2. Scope Of The Study 2.1. Market Definition 2.2. Scope Of The Study 2.2.1. Objectives of Report 2.2.2. Limitations 2.3. Market Structure Chapter 3. Evolve BI Methodology Chapter 4. Market Insights and Trends 4.1. Supply/ Value Chain Analysis 4.1.1. Raw End Users Providers 4.1.2. Manufacturing Process 4.1.3. Distributors/Retailers 4.1.4. End-Use Industry 4.2. Porter’s Five Forces Analysis 4.2.1. Threat Of New Entrants 4.2.2. Bargaining Power Of Buyers 4.2.3. Bargaining Power Of Suppliers 4.2.4. Threat Of Substitutes 4.2.5. Industry Rivalry 4.3. Impact Of COVID-19 on the Smart Meter Market 4.3.1. Impact on Market Size 4.3.2. End-Use Industry Trend, Preferences, and Budget Impact 4.3.3. Regulatory Framework/Government Policies 4.3.4. Key Players' Strategy to Tackle Negative Impact 4.3.5. Opportunity Window 4.4. Technology Overview 4.5. Macro factor 4.6. Micro Factor 4.7.Demand Supply Gap Analysis of the Smart Meter Market 4.8.Import Analysis of the Smart Meter Market 4.9.Export Analysis of the Smart Meter Market Chapter 5. Market Dynamics 5.1. Introduction 5.2. DROC Analysis 5.2.1. Drivers 5.2.2. Restraints 5.2.3. Opportunities 5.2.4. Challenges 5.3. Patent Analysis 5.4. Industry Roadmap 5.5. Parent/Peer Market Analysis Chapter 6. Global Smart Meter Market, By Product 6.1. Introduction 6.2. Smart Electricity Meter 6.3. Smart Gas Meter Chapter 7. Global Smart Meter Market, By End Use 7.1. Introduction 7.2. Residential 7.3. Commercial Chapter 8. Global Smart Meter Market, By Region 8.1. Introduction 8.2. North America 8.2.1. Introduction 8.2.2. Driving Factors, Opportunity Analyzed, and Key Trends 8.2.3. Market Size and Forecast, By Country, 2023-2033 8.2.4. Market Size and Forecast, By Product, 2023-2033 8.2.5. Market Size and Forecast, By End Use, 2023-2033 8.2.6. US 8.2.6.1. Introduction 8.2.6.2. Driving Factors, Opportunity Analyzed, and Key Trends 8.2.6.3. Market Size and Forecast, By Product, 2023-2033 8.2.6.4. Market Size and Forecast, By End Use, 2023-2033 8.2.7. Canada 8.2.7.1. Introduction 8.2.7.2. Driving Factors, Opportunity Analyzed, and Key Trends 8.2.7.4. Market Size and Forecast, By Product, 2023-2033 8.2.7.5. Market Size and Forecast, By End Use, 2023-2033 8.3. Europe 8.3.1. Introduction 8.3.2. Driving Factors, Opportunity Analyzed, and Key Trends 8.3.3. Market Size and Forecast, By Country, 2023-2033 8.3.4. Market Size and Forecast, By Product, 2023-2033 8.3.5. Market Size and Forecast, By End Use, 2023-2033 8.3.6. Germany 8.3.6.1. Introduction 8.3.6.2. Driving Factors, Opportunity Analyzed, and Key Trends 8.3.6.3. Market Size and Forecast, By Product, 2023-2033 8.3.6.4. Market Size and Forecast, By End Use, 2023-2033 8.3.7. France 8.3.7.1. Introduction 8.3.7.2. Driving Factors, Opportunity Analyzed, and Key Trends 8.3.7.3. Market Size and Forecast, By Product, 2023-2033 8.3.7.4. Market Size and Forecast, By End Use, 2023-2033 8.3.8. UK 8.3.8.1. Introduction 8.3.8.2. Driving Factors, Opportunity Analyzed, and Key Trends 8.3.8.3. Market Size and Forecast, By Product, 2023-2033 8.3.8.4. Market Size and Forecast, By End Use, 2023-2033 8.3.9. Italy 8.3.9.1. Introduction 8.3.9.2. Driving Factors, Opportunity Analyzed, and Key Trends 8.3.9.3. Market Size and Forecast, By Product, 2023-2033 8.3.9.4. Market Size and Forecast, By End Use, 2023-2033 8.3.11. Rest Of Europe 8.3.11.1. Introduction 8.3.11.2. Driving Factors, Opportunity Analyzed, and Key Trends 8.3.11.3. Market Size and Forecast, By Product, 2023-2033 8.3.11.4. Market Size and Forecast, By End Use, 2023-2033 8.4. Asia-Pacific 8.4.1. Introduction 8.4.2. Driving Factors, Opportunity Analyzed, and Key Trends 8.4.3. Market Size and Forecast, By Country, 2023-2033 8.4.4. Market Size and Forecast, By Product, 2023-2033 8.4.5. Market Size and Forecast, By End Use, 2023-2033 8.4.6. China 8.4.6.1. Introduction 8.4.6.2. Driving Factors, Opportunity Analyzed, and Key Trends 8.4.6.3. Market Size and Forecast, By Product, 2023-2033 8.4.6.4. Market Size and Forecast, By End Use, 2023-2033 8.4.7. India 8.4.7.1. Introduction 8.4.7.2. Driving Factors, Opportunity Analyzed, and Key Trends 8.4.7.3. Market Size and Forecast, By Product, 2023-2033 8.4.7.4. Market Size and Forecast, By End Use, 2023-2033 8.4.8. Japan 8.4.8.1. Introduction 8.4.8.2. Driving Factors, Opportunity Analyzed, and Key Trends 8.4.8.3. Market Size and Forecast, By Product, 2023-2033 8.4.8.4. Market Size and Forecast, By End Use, 2023-2033 8.4.9. South Korea 8.4.9.1. Introduction 8.4.9.2. Driving Factors, Opportunity Analyzed, and Key Trends 8.4.9.3. Market Size and Forecast, By Product, 2023-2033 8.4.9.4. Market Size and Forecast, By End Use, 2023-2033 8.4.10. Rest Of Asia-Pacific 8.4.10.1. Introduction 8.4.10.2. Driving Factors, Opportunity Analyzed, and Key Trends 8.4.10.3. Market Size and Forecast, By Product, 2023-2033 8.4.10.4. Market Size and Forecast, By End Use, 2023-2033 8.5. Rest Of The World (RoW) 8.5.1. Introduction 8.5.2. Driving Factors, Opportunity Analyzed, and Key Trends 8.5.3. Market Size and Forecast, By Product, 2023-2033 8.5.4. Market Size and Forecast, By End Use, 2023-2033 Chapter 9. Company Landscape 9.1. Introduction 9.2. Vendor Share Analysis 9.3. Key Development Analysis 9.4. Competitor Dashboard Chapter 10. Company Profiles 10.1. Itron Inc. 10.1.1. Business Overview 10.1.2. Commercial Use Analysis 10.1.2.1. Commercial Use – Existing/Funding 10.1.3. Product Portfolio 10.1.4. Recent Development and Strategies Adopted 10.1.5. SWOT Analysis 10.2. Landis+Gyr 10.2.1. Business Overview 10.2.2. Commercial Use Analysis 10.2.2.1. Commercial Use – Existing/Funding 10.2.3. Product Portfolio 10.2.4. Recent Development and Strategies Adopted 10.2.5. SWOT Analysis 10.3. Schneider Electric SA 10.3.1. Business Overview 10.3.2. Commercial Use Analysis 10.3.2.1. Commercial Use – Existing/Funding 10.3.3. Product Portfolio 10.3.4. Recent Development and Strategies Adopted 10.3.5. SWOT Analysis 10.4. Siemens AG 10.4.1. Business Overview 10.4.2. Commercial Use Analysis 10.4.2.1. Commercial Use – Existing/Funding 10.4.3. Product Portfolio 10.4.4. Recent Development and Strategies Adopted 10.4.5. SWOT Analysis 10.5. Badger Meter 10.5.1. Business Overview 10.5.2. Commercial Use Analysis 10.5.2.1. Commercial Use – Existing/Funding 10.5.3. Product Portfolio 10.5.4. Recent Development and Strategies Adopted 10.5.5. SWOT Analysis 10.6. EDMI 10.6.1. Business Overview 10.6.2. Commercial Use Analysis 10.6.2.1. Commercial Use – Existing/Funding 10.6.3. Product Portfolio 10.6.4. Recent Development and Strategies Adopted 10.6.5. SWOT Analysis 10.7. Holley Metering Limited 10.7.1. Business Overview 10.7.2. Commercial Use Analysis 10.7.2.1. Commercial Use – Existing/Funding 10.7.3. Product Portfolio 10.7.4. Recent Development and Strategies Adopted 10.7.5. SWOT Analysis 10.8. Neptune Technology Group Inc. 10.8.1. Business Overview 10.8.2. Molson Coors Beverage Company 10.8.2.1. Commercial Use – Existing/Funding 10.8.3. Product Portfolio 10.8.4. Recent Development and Strategies Adopted 10.8.5. SWOT Analysis 10.9. Sensus 10.9.1. Business Overview 10.9.2. Commercial Use Analysis 10.9.2.1. Commercial Use – Existing/Funding 10.9.3. Product Portfolio 10.9.4. Recent Development and Strategies Adopted 10.9.5. SWOT Analysis 10.10. Honeywell International Inc. 10.10.1. Business Overview 10.10.2. Commercial Use Analysis 10.10.2.1. Commercial Use – Existing/Funding 10.10.3. Product Portfolio 10.10.4. Recent Development and Strategies Adopted 10.10.5. SWOT Analysis
Connect to Analyst
Report Type and Pricing


