
Road Freight Market Analysis and Global Forecast 2023-2033
Price range: $ 1,390.00 through $ 5,520.00
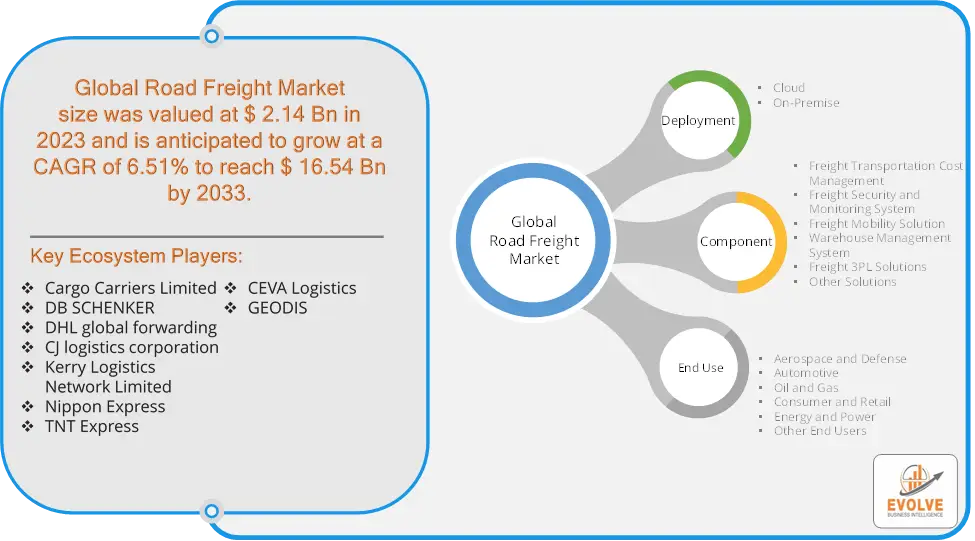
Road Freight Market Research Report: Information By Deployment (Cloud, On-Premise), By Component (Freight Transportation Cost Management, Freight Security and Monitoring System, Freight Mobility Solution, Warehouse Management System, Freight 3PL Solutions, Other Solutions), By End-use (Aerospace and Defense, Automotive, Oil and Gas, Consumer and Retail, Energy and Power, Other End Users), and by Region — Forecast till 2033
Page: 161
Road Freight Market Overview
The Road Freight Market Size is expected to reach USD 16.54 Billion by 2033. The Road Freight Market industry size accounted for USD 2.14 Billion in 2023 and is expected to expand at a compound annual growth rate (CAGR) of 6.51% from 2023 to 2033. The Road Freight Market refers to the sector of the transportation industry that involves the movement of goods by road. This market is a crucial component of the supply chain and logistics industry, facilitating the delivery of goods from manufacturers to consumers or businesses.
Key factors influencing the Road Freight Market include fuel prices, regulatory changes, technological advancements, and economic conditions. The market is also shaped by trends like the rise of e-commerce, which increases demand for efficient and flexible freight services.
Global Road Freight Market Synopsis
 COVID-19 Impact Analysis
The COVID-19 pandemic had a significant impact on the Road Freight Market. The pandemic led to the closure of manufacturing plants, disruptions in supply chains, and a sharp decline in production, which reduced the volume of goods needing transport. Restrictions on movement and the closure of borders slowed down cross-border freight transport, causing delays and added complexity in logistics. As more consumers shifted to online shopping during lockdowns, the demand for road freight services in the e-commerce sector surged, particularly for last-mile delivery. The implementation of strict health and safety measures, including sanitization, social distancing, and the use of PPE, increased operational costs and complexity. The pandemic accelerated the adoption of digital technologies, such as route optimization software, real-time tracking, and contactless delivery, to enhance efficiency and safety. As economies began to recover, the Road Freight Market also rebounded, driven by the ongoing growth in e-commerce, the resumption of industrial activities, and the global demand for efficient logistics solutions.
Road Freight Market Dynamics
The major factors that have impacted the growth of Road Freight Market are as follows:
Drivers:
Ø Technological Advancements
The adoption of technologies such as route optimization, real-time tracking, and automated freight management systems enhances efficiency and reduces costs, making road freight more competitive. The development and deployment of electric and autonomous vehicles are driving changes in the road freight market, offering potential cost savings and environmental benefits. The rapid expansion of e-commerce has significantly boosted the demand for efficient and timely road freight services, particularly for last-mile deliveries to consumers. E-commerce often requires frequent, smaller shipments rather than bulk transport, increasing the overall demand for road freight services.
Restraint:
- Perception of Rising Fuel Costs and High Costs of Technology Adoption
The road freight industry is highly sensitive to fluctuations in fuel prices, which can significantly impact operating costs. High fuel prices can reduce profit margins and increase transportation costs for goods. The industry’s reliance on fossil fuels also makes it vulnerable to environmental regulations and the push for decarbonization. While technological advancements can improve efficiency, the initial investment required for adopting new technologies such as electric or autonomous vehicles, telematics, and digital logistics platforms can be a significant barrier, especially for smaller operators.
Opportunity:
⮚ Green Logistics Solutions
Growing awareness of environmental issues is driving demand for eco-friendly transportation solutions. Companies that adopt sustainable practices, such as using electric trucks or optimizing routes to reduce emissions, can attract environmentally conscious clients and gain a competitive advantage. Offering customized services, such as specialized handling for temperature-sensitive goods or just-in-time delivery, can differentiate road freight companies and cater to specific industry needs. Road freight operators can expand their offerings to include value-added services like warehousing, inventory management, packaging, and reverse logistics, creating additional revenue streams and enhancing customer loyalty.
Road Freight Market Segment Overview
By Deployment
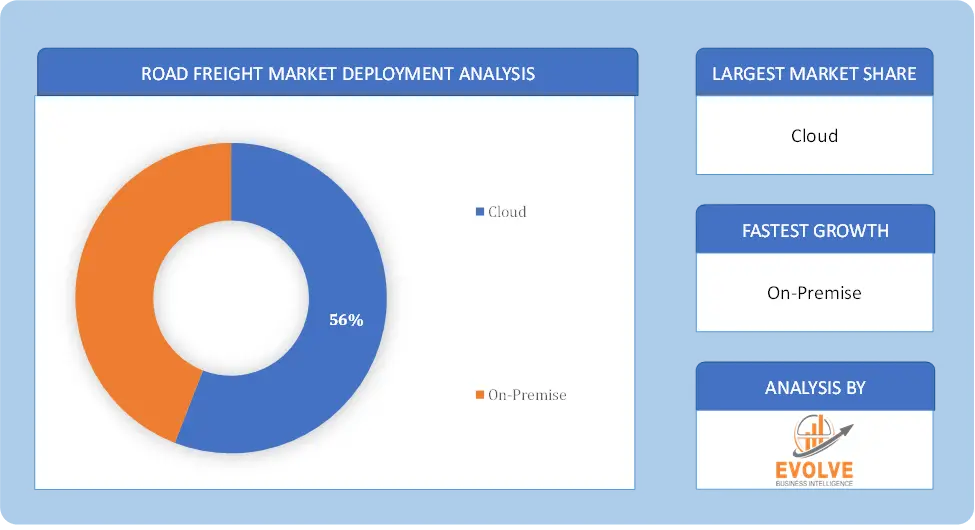 Based on Deployment, the market is segmented based on Cloud and On-Premise. The On-Premise segment dominant the market. On-premise solutions offer companies full control over their data, which is crucial for businesses handling sensitive information or operating in highly regulated industries. This control allows for better customization and integration with existing systems. On-premise systems can be highly customized to meet the specific needs of the company. This flexibility is important for businesses with unique logistics requirements that may not be fully addressed by standardized cloud solutions.
By Component
Based on Component, the market segment has been divided into Freight Transportation Cost Management, Freight Security and Monitoring System, Freight Mobility Solution, Warehouse Management System, Freight 3PL Solutions and Other Solutions. The Freight Transportation Cost Management segment dominant the market. The use of Transportation Management Systems (TMS) and other software solutions enables companies to automate and optimize freight cost management. These technologies provide real-time visibility into transportation expenses, support better decision-making, and enhance overall efficiency.
By End Use
Based on End Use, the market segment has been divided into Aerospace and Defense, Automotive, Oil and Gas, Consumer and Retail, Energy and Power and Other End Users. The Consumer and Retail segment dominant the market. The Consumer and Retail segment involves the movement of large volumes of goods, often on a daily basis. This includes everything from perishable items like food and beverages to electronics, clothing, and household goods. Retailers increasingly rely on just-in-time inventory systems to minimize stock levels and reduce warehousing costs. This requires road freight providers to offer reliable and timely delivery services to meet retail demand without delays.
Global Road Freight Market Regional Analysis
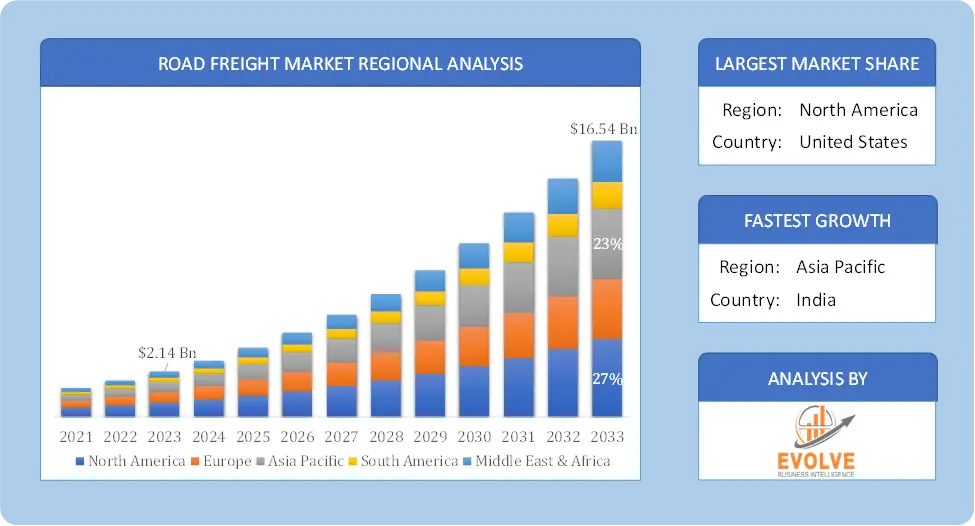
Based on region, the global Road Freight Market has been divided into North America, Europe, Asia-Pacific, the Middle East & Africa, and Latin America. North America is projected to dominate the use of the Road Freight Market followed by the Asia-Pacific and Europe regions.
 North America Market
North America holds a dominant position in the Road Freight Market. North America, particularly the United States, has a well-developed road freight market, driven by a strong economy, extensive road networks, and high demand for goods transportation. The growth of e-commerce, the demand for just-in-time delivery, and the integration of digital technologies are key drivers in this region. And the region faces challenges such as driver shortages, increasing regulatory scrutiny, and fluctuating fuel prices.
Asia-Pacific Market
The Asia-Pacific region has indeed emerged as the fastest-growing market for the Road Freight Market industry. The Asia-Pacific region is one of the fastest-growing road freight markets, driven by rapid urbanization, industrialization, and the expansion of e-commerce in countries like China and India. Economic growth, infrastructure development, and increasing consumer demand are driving the market. The region also benefits from significant government investments in transportation infrastructure and also there are significant opportunities in emerging markets, infrastructure development, and the adoption of digital and green logistics solutions.
Competitive Landscape
The global Road Freight Market is highly competitive, with numerous players offering a wide range of software solutions. The competitive landscape is characterized by the presence of established companies, as well as emerging startups and niche players. To increase their market position and attract a wide consumer base, the businesses are employing various strategies, such as product launches, and strategic alliances.
Prominent Players:
- Cargo Carriers Limited
- DB SCHENKER
- DHL global forwarding
- CJ logistics corporation
- Kerry Logistics Network Limited
- Nippon Express
- TNT Express
- CEVA Logistics
- GEODIS
Scope of the Report
Global Road Freight Market, by Deployment
- Cloud
- On-Premise
Global Road Freight Market, by Component
- Freight Transportation Cost Management
- Freight Security and Monitoring System
- Freight Mobility Solution
- Warehouse Management System
- Freight 3PL Solutions
- Other Solutions
Global Road Freight Market, by End Use
- Aerospace and Defense
- Automotive
- Oil and Gas
- Consumer and Retail
- Energy and Power
- Other End Users
Global Road Freight Market, by Region
- North America
- US
- Canada
- Mexico
- Europe
- UK
- Germany
- France
- Italy
- Spain
- Benelux
- Nordic
- Rest of Europe
- Asia Pacific
- China
- Japan
- South Korea
- Indonesia
- Austalia
- Malaysia
- India
- Rest of Asia Pacific
- South America
- Brazil
- Argentina
- Rest of South America
- Middle East & Africa
- Saudi Arabia
- UAE
- Egypt
- South Africa
- Rest of Middle East & Africa
| Parameters | Indicators |
|---|---|
| Market Size | 2033: $16.54 Billion |
| CAGR | 6.51% CAGR (2023-2033) |
| Base year | 2022 |
| Forecast Period | 2023-2033 |
| Historical Data | 2021 |
| Report Coverage | Revenue Forecast, Competitive Landscape, Growth Factors, and Trends |
| Key Segmentations | Deployment, Component, End Use |
| Geographies Covered | North America, Europe, Asia-Pacific, Latin America, Middle East, Africa |
| Key Vendors | Cargo Carriers Limited, DB SCHENKER, DHL global forwarding, CJ logistics corporation, Kerry Logistics Network Limited, Nippon Express, TNT Express, CEVA Logistics and GEODIS |
| Key Market Opportunities | • Green Logistics Solutions • Customized and Value-Added Services |
| Key Market Drivers | • Technological Advancements • Growth in E-commerce |
REPORT CONTENT BRIEF:
- High-level analysis of the current and future Road Freight Market trends and opportunities
- Detailed analysis of current market drivers, restraining factors, and opportunities in the future
- Road Freight Market historical market size for the year 2021, and forecast from 2023 to 2033
- Road Freight Market share analysis at each product level
- Competitor analysis with detailed insight into its product segment, Government & Defense strength, and strategies adopted.
- Identifies key strategies adopted including product launches and developments, mergers and acquisitions, joint ventures, collaborations, and partnerships as well as funding taken and investment done, among others.
- To identify and understand the various factors involved in the global Road Freight Market affected by the pandemic
- To provide a detailed insight into the major companies operating in the market. The profiling will include the Government & Defense health of the company’s past 2-3 years with segmental and regional revenue breakup, product offering, recent developments, SWOT analysis, and key strategies.
Frequently Asked Questions (FAQ)
What is the growth rate of the global Road Freight Market?
The global Road Freight Market is growing at a CAGR of 6.51% over the next 10 years
Which region has the highest growth rate in the market of Road Freight Market?
Asia Pacific is expected to register the highest CAGR during 2023-2033
Which region has the largest share of the global Road Freight Market?
North America holds the largest share in 2022
Who are the key players in the global Road Freight Market?
Cargo Carriers Limited, DB SCHENKER, DHL global forwarding, CJ logistics corporation, Kerry Logistics Network Limited, Nippon Express, TNT Express, CEVA Logistics and GEODIS are the major companies operating in the market.
Do you offer Post Sale Support?
Yes, we offer 16 hours of analyst support to solve the queries
Do you sell particular sections of a report?
Yes, we provide regional as well as country-level reports. Other than this we also provide a sectional report. Please get in contact with our sales representatives
Press Release

Global Pharmaceutical Manufacturing Market to Reach $1.38 Trillion by 2035 with 7.35% CAGR, New Research Shows
The Global Mammography Market Is Estimated To Record a CAGR of Around 10.29% During The Forecast Period
Glue Stick Market to Reach USD 2.35 Billion by 2034
Podiatry Service Market to Reach USD 11.88 Billion by 2034
Microfluidics Technology Market to Reach USD 32.58 Billion by 2034
Ferric Chloride Market to Reach USD 10.65 Billion by 2034
Family Practice EMR Software Market to Reach USD 21.52 Billion by 2034
Electric Hairbrush Market to Reach USD 15.95 Billion by 2034
Daily Bamboo Products Market to Reach USD 143.52 Billion by 2034
Cross-border E-commerce Logistics Market to Reach USD 112.65 Billion by 2034
Table of Content
CHAPTER 1. Executive Summary CHAPTER 2. Scope of the Study 2.1. Market Definition 2.2. Market Scope & Segmentation 2.2.1. Objective of Report CHAPTER 3. Evolve BI Methodology 3.1. Data Collection & Validation Approach 3.2. Market Size Estimation and Forecast CHAPTER 4. Exclusive Analysis 4.1. Market Opportunity Score 4.1.1. Deployment Segement – Market Opportunity Score 4.1.2. Component Segment – Market Opportunity Score 4.1.3. End Use Segment – Market Opportunity Score 4.2. Key Market Influencing Indicators CHAPTER 5. Market Insights and Trends 5.1. Value Chain Analysis 5.1.1. Raw Material 5.1.2. Manufacturing Process 5.1.3. Distribution Channel 5.1.4. End User 5.2. Porter’s Five Forces Analysis 5.2.1. Bargaining Power of Buyers 5.2.2. Bargaining Power of Suppliers 5.2.3. Threat of New Entrant 5.2.4. Threat of Substitute 5.2.5. Industry Rivalry 5.3. COVID-19 Impact and Post COVID Scenario on Road Freight Market 5.3.1. Impact of COVID-19 5.3.2. Government Support and Industry Revival Policies 5.3.3. Measures Taken by Companies to Mitigate Negative Impact 5.3.4. Post COVID Trend CHAPTER 6. Market Dynamics 6.1. Introduction 6.2. Drivers 6.2.1. Driver 1 6.2.2. Driver 2 6.2.3. Driver 3 6.3. Restraints 6.3.1. Restraint 1 6.3.2. Restraint 2 6.4. Opportunity 6.4.1. Opportunity 1 CHAPTER 7. Road Freight Market, By Deployment 7.1. Introduction 7.1.1. Cloud 7.1.2. On-Premise CHAPTER 8 Road Freight Market, By Component 8.1. Introduction 8.1.1. Freight Transportation Cost Management 8.1.2. Freight Security and Monitoring System 8.1.3. Freight Mobility Solution 8.1.4. Warehouse Management System 8.1.5. Freight 3PL Solutions 8.1.6. Other Solutions CHAPTER 9. Road Freight Market, By End Use 9.1. Introduction 9.1.1. Aerospace and Defense 9.1.2 Automotive 9.1.3. Oil and Gas 9.1.4. Consumer and Retail 9.1.5. Energy and Power 9.1.6. Other End Users CHAPTER 10. Road Freight Market, By Region 10.1. Introduction 10.2. NORTH AMERICA 10.2.1. North America: Market Size and Forecast, By Country, 2023 – 2033 ($ Million) 10.2.2. North America: Market Size and Forecast, By Deployment, 2023 – 2033 ($ Million) 10.2.3. North America: Market Size and Forecast, By Component, 2023 – 2033 ($ Million) 10.2.4. North America: Market Size and Forecast, By End User, 2023 – 2033 ($ Million) 10.2.5. US 10.2.5.1. US: Market Size and Forecast, By Deployment, 2023 – 2033 ($ Million) 10.2.5.2. US: Market Size and Forecast, By Component, 2023 – 2033 ($ Million) 10.2.5.3. US: Market Size and Forecast, By End User, 2023 – 2033 ($ Million) 10.2.6. CANADA 10.2.6.1. Canada: Market Size and Forecast, By Deployment, 2023 – 2033 ($ Million) 10.2.6.2. Canada: Market Size and Forecast, By Component, 2023 – 2033 ($ Million) 10.2.6.3. Canada: Market Size and Forecast, By End User, 2023 – 2033 ($ Million) 10.2.7. MEXICO 10.2.7.1. Mexico: Market Size and Forecast, By Deployment, 2023 – 2033 ($ Million) 10.2.7.2. Mexico: Market Size and Forecast, By Component, 2023 – 2033 ($ Million) 10.2.7.3. Mexico: Market Size and Forecast, By End User, 2023 – 2033 ($ Million) 10.3. Europe 10.3.1. Europe: Market Size and Forecast, By Country, 2023 – 2033 ($ Million) 10.3.2. Europe: Market Size and Forecast, By Deployment, 2023 – 2033 ($ Million) 10.3.3. Europe: Market Size and Forecast, By Component, 2023 – 2033 ($ Million) 10.3.4. Europe: Market Size and Forecast, By End User, 2023 – 2033 ($ Million) 10.3.5. U.K. 10.3.5.1. U.K.: Market Size and Forecast, By Deployment, 2023 – 2033 ($ Million) 10.3.5.2. U.K.: Market Size and Forecast, By Component, 2023 – 2033 ($ Million) 10.3.5.3. U.K.: Market Size and Forecast, By End User, 2023 – 2033 ($ Million) 10.3.6. GERMANY 10.3.6.1. Germany: Market Size and Forecast, By Deployment, 2023 – 2033 ($ Million) 10.3.6.2. Germany: Market Size and Forecast, By Component, 2023 – 2033 ($ Million) 10.3.6.3. Germany: Market Size and Forecast, By End User, 2023 – 2033 ($ Million) 10.3.7. FRANCE 10.3.7.1. France: Market Size and Forecast, By Deployment, 2023 – 2033 ($ Million) 10.3.7.2. France: Market Size and Forecast, By Component, 2023 – 2033 ($ Million) 10.3.7.3. France: Market Size and Forecast, By End User, 2023 – 2033 ($ Million) 10.3.8. ITALY 10.3.8.1. Italy: Market Size and Forecast, By Deployment, 2023 – 2033 ($ Million) 10.3.8.2. Italy: Market Size and Forecast, By Component, 2023 – 2033 ($ Million) 10.3.8.3. Italy: Market Size and Forecast, By End User, 2023 – 2033 ($ Million) 10.3.9. SPAIN 10.3.9.1. Spain: Market Size and Forecast, By Deployment, 2023 – 2033 ($ Million) 10.3.9.2. Spain: Market Size and Forecast, By Component, 2023 – 2033 ($ Million) 10.3.9.3. Spain: Market Size and Forecast, By End User, 2023 – 2033 ($ Million) 10.3.10. BENELUX 10.3.10.1. BeNeLux: Market Size and Forecast, By Deployment, 2023 – 2033 ($ Million) 10.3.10.2. BeNeLux: Market Size and Forecast, By Component, 2023 – 2033 ($ Million) 10.3.10.3. BeNeLux: Market Size and Forecast, By End User, 2023 – 2033 ($ Million) 10.3.11. RUSSIA 10.3.11.1. Russia: Market Size and Forecast, By Deployment, 2023 – 2033 ($ Million) 10.3.11.2. Russia: Market Size and Forecast, By Component, 2023 – 2033 ($ Million) 10.3.11.3. Russia: Market Size and Forecast, By End User, 2023 – 2033 ($ Million) 10.3.12. REST OF EUROPE 10.3.12.1. Rest of Europe: Market Size and Forecast, By Deployment, 2023 – 2033 ($ Million) 10.3.12.2. Rest of Europe: Market Size and Forecast, By Component, 2023 – 2033 ($ Million) 10.3.12.3. Rest of Europe: Market Size and Forecast, By End User, 2023 – 2033 ($ Million) 10.4. Asia Pacific 10.4.1. Asia Pacific: Market Size and Forecast, By Country, 2023 – 2033 ($ Million) 10.4.2. Asia Pacific: Market Size and Forecast, By Deployment, 2023 – 2033 ($ Million) 10.4.3. Asia Pacific: Market Size and Forecast, By Component, 2023 – 2033 ($ Million) 10.4.4. Asia Pacific: Market Size and Forecast, By End User, 2023 – 2033 ($ Million) 10.4.5. CHINA 10.4.5.1. China: Market Size and Forecast, By Deployment, 2023 – 2033 ($ Million) 10.4.5.2. China: Market Size and Forecast, By Component, 2023 – 2033 ($ Million) 10.4.5.3. China: Market Size and Forecast, By End User, 2023 – 2033 ($ Million) 10.4.6. JAPAN 10.4.6.1. Japan: Market Size and Forecast, By Deployment, 2023 – 2033 ($ Million) 10.4.6.2. Japan: Market Size and Forecast, By Component, 2023 – 2033 ($ Million) 10.4.6.3. Japan: Market Size and Forecast, By End User, 2023 – 2033 ($ Million) 10.4.7. INDIA 10.4.7.1. India: Market Size and Forecast, By Deployment, 2023 – 2033 ($ Million) 10.4.7.2. India: Market Size and Forecast, By Component, 2023 – 2033 ($ Million) 10.4.7.3. India: Market Size and Forecast, By End User, 2023 – 2033 ($ Million) 10.4.8. SOUTH KOREA 10.4.8.1. South Korea: Market Size and Forecast, By Deployment, 2023 – 2033 ($ Million) 10.4.8.2. South Korea: Market Size and Forecast, By Component, 2023 – 2033 ($ Million) 10.4.8.3. South Korea: Market Size and Forecast, By End User, 2023 – 2033 ($ Million) 10.4.9. THAILAND 10.4.9.1. Thailand: Market Size and Forecast, By Deployment, 2023 – 2033 ($ Million) 10.4.9.2. Thailand: Market Size and Forecast, By Component, 2023 – 2033 ($ Million) 10.4.9.3. Thailand: Market Size and Forecast, By End User, 2023 – 2033 ($ Million) 10.4.10. INDONESIA 10.4.10.1. Indonesia: Market Size and Forecast, By Deployment, 2023 – 2033 ($ Million) 10.4.10.2. Indonesia: Market Size and Forecast, By Component, 2023 – 2033 ($ Million) 10.4.10.3. Indonesia: Market Size and Forecast, By End User, 2023 – 2033 ($ Million) 10.4.11. MALAYSIA 10.4.11.1. Malaysia: Market Size and Forecast, By Deployment, 2023 – 2033 ($ Million) 10.4.11.2. Malaysia: Market Size and Forecast, By Component, 2023 – 2033 ($ Million) 10.4.11.3. Malaysia: Market Size and Forecast, By End User, 2023 – 2033 ($ Million) 10.4.12. AUSTRALIA 10.4.12.1. Australia: Market Size and Forecast, By Deployment, 2023 – 2033 ($ Million) 10.4.12.2. Australia: Market Size and Forecast, By Component, 2023 – 2033 ($ Million) 10.4.12.3. Australia: Market Size and Forecast, By End User, 2023 – 2033 ($ Million) 10.4.13. REST FO ASIA PACIFIC 10.4.13.1. Rest fo Asia Pacific: Market Size and Forecast, By Deployment, 2023 – 2033 ($ Million) 10.4.13.2. Rest fo Asia Pacific: Market Size and Forecast, By Component, 2023 – 2033 ($ Million) 10.4.13.3. Rest fo Asia Pacific: Market Size and Forecast, By End User, 2023 – 2033 ($ Million) 10.5. South America 10.5.1. South America: Market Size and Forecast, By Country, 2023 – 2033 ($ Million) 10.5.2. South America: Market Size and Forecast, By Deployment, 2023 – 2033 ($ Million) 10.5.3. South America: Market Size and Forecast, By Component, 2023 – 2033 ($ Million) 10.5.4. South America: Market Size and Forecast, By End User, 2023 – 2033 ($ Million) 10.5.5. BRAZIL 10.5.5.1. Brazil: Market Size and Forecast, By Deployment, 2023 – 2033 ($ Million) 10.5.5.2. Brazil: Market Size and Forecast, By Component, 2023 – 2033 ($ Million) 10.5.5.3. Brazil: Market Size and Forecast, By End User, 2023 – 2033 ($ Million) 10.5.6. ARGENTINA 10.5.6.1. Argentina: Market Size and Forecast, By Deployment, 2023 – 2033 ($ Million) 10.5.6.2. Argentina: Market Size and Forecast, By Component, 2023 – 2033 ($ Million) 10.5.6.3. Argentina: Market Size and Forecast, By End User, 2023 – 2033 ($ Million) 10.5.7. REST OF SOUTH AMERICA 10.5.7.1. Rest of South America: Market Size and Forecast, By Deployment, 2023 – 2033 ($ Million) 10.5.7.2. Rest of South America: Market Size and Forecast, By Component, 2023 – 2033 ($ Million) 10.5.7.3. Rest of South America: Market Size and Forecast, By End User, 2023 – 2033 ($ Million) 10.6. Middle East & Africa 10.6.1. Middle East & Africa: Market Size and Forecast, By Country, 2023 – 2033 ($ Million) 10.6.2. Middle East & Africa: Market Size and Forecast, By Deployment, 2023 – 2033 ($ Million) 10.6.3. Middle East & Africa: Market Size and Forecast, By Component, 2023 – 2033 ($ Million) 10.6.4. Middle East & Africa: Market Size and Forecast, By End User, 2023 – 2033 ($ Million) 10.6.5. SAUDI ARABIA 10.6.5.1. Saudi Arabia: Market Size and Forecast, By Deployment, 2023 – 2033 ($ Million) 10.6.5.2. Saudi Arabia: Market Size and Forecast, By Component, 2023 – 2033 ($ Million) 10.6.5.3. Saudi Arabia: Market Size and Forecast, By End User, 2023 – 2033 ($ Million) 10.6.6. UAE 10.6.6.1. UAE: Market Size and Forecast, By Deployment, 2023 – 2033 ($ Million) 10.6.6.2. UAE: Market Size and Forecast, By Component, 2023 – 2033 ($ Million) 10.6.6.3. UAE: Market Size and Forecast, By End User, 2023 – 2033 ($ Million) 10.6.7. EGYPT 10.6.7.1. Egypt: Market Size and Forecast, By Deployment, 2023 – 2033 ($ Million) 10.6.7.2. Egypt: Market Size and Forecast, By Component, 2023 – 2033 ($ Million) 10.6.7.3. Egypt: Market Size and Forecast, By End User, 2023 – 2033 ($ Million) 10.6.8. SOUTH AFRICA 10.6.8.1. South Africa: Market Size and Forecast, By Deployment, 2023 – 2033 ($ Million) 10.6.8.2. South Africa: Market Size and Forecast, By Component, 2023 – 2033 ($ Million) 10.6.8.3. South Africa: Market Size and Forecast, By End User, 2023 – 2033 ($ Million) 10.6.9. REST OF MIDDLE EAST & AFRICA 10.6.9.1. Rest of Middle East & Africa: Market Size and Forecast, By Deploymentss, 2023 – 2033 ($ Million) 10.6.9.2. Rest of Middle East & Africa: Market Size and Forecast, By Component, 2023 – 2033 ($ Million) 10.6.9.3. Rest of Middle East & Africa: Market Size and Forecast, By End User, 2023 – 2033 ($ Million) CHAPTER 12. Competitive Landscape 12.1. Competitior Benchmarking 2023 12.2. Market Share Analysis 12.3. Key Developments Analysis By Top 5 Companies 12.4. Market Share Acquisition Strategies: Analysis of Key Approaches Employed by Top Players CHAPTER 13. Company Profiles 13.1. Cargo Carriers Limited 13.1.1. Hanon Systems 13.1.2. Financial Analysis 13.1.2.1. Business Segment Revenue, 2020, 2021, 2022, $ Million 13.1.2.2. Geographic Revenue Mix, 2022 (% Share) 13.1.3. Product Portfolio 13.1.4. Recent Development and Strategies Adopted 13.1.5. SWOT Analysis 13.2. DB SCHENKER 13.3. DHL global forwarding 13.4. CJ logistics corporation 13.5. Kerry Logistics Network Limited 13.6. Nippon Express 13.7. TNT Express 13.8. CEVA Logistics 13.9 GEODIS
Connect to Analyst
Research Methodology

Our Most Viewed Report and gain instant expertise

Advanced Driver Assistance Systems (ADAS) Market Analysis and Global Forecast 2023-2033
All-Terrain Vehicle Market Analysis Analysis and Global Forecast 2023-2033
Automotive Acoustic Materials Market Analysis and Global Forecast 2023-2033
Automotive Glazing Market Analysis and Global Forecast 2023-2033

