Electroencephalography (EEG) Equipment Market Analysis and Global Forecast 2023-2033
$ 1,390.00 – $ 5,520.00
Electroencephalography (EEG) Equipment Market Research Report: By Product (EEG Equipment, EEG Accessories) By Application (Diseases Diagnosis, Sleep Monitoring, Anesthesia Monitoring, Trauma & Surgery, Others) By End User (Hospitals, Diagnostic Centers, Surgical Centers, Research Laboratories, Others), and by Region — Forecast till 2033
Electroencephalography (EEG) Equipment Market Overview
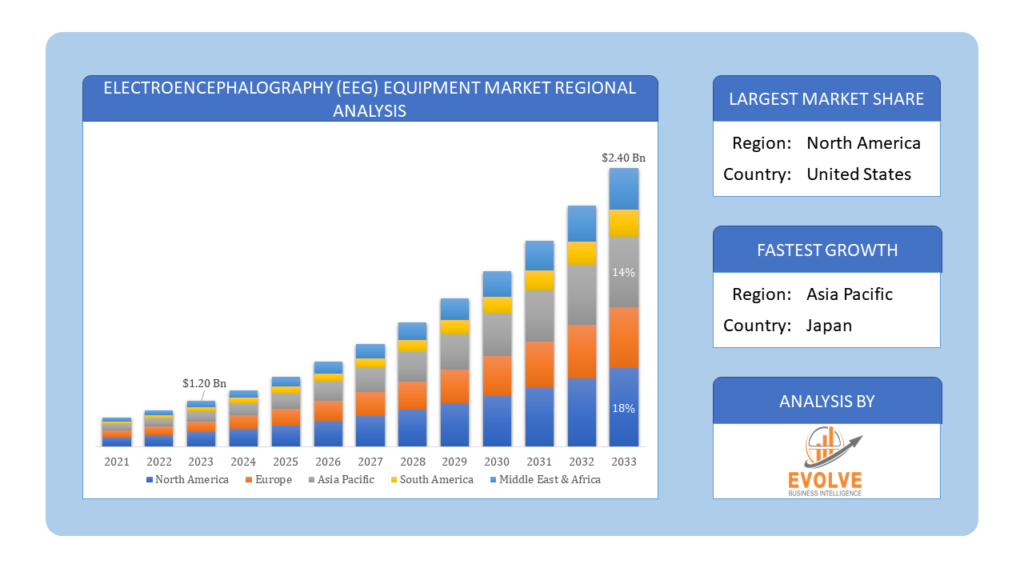
The Electroencephalography (EEG) Equipment Market Size is expected to reach USD 2.40 Billion by 2033. The Electroencephalography (EEG) Equipment industry size accounted for USD 1.20 Billion in 2023 and is expected to expand at a compound annual growth rate (CAGR) of 9.54% from 2023 to 2033. The Electroencephalography (EEG) Equipment Market refers to the industry involved in the manufacturing and distribution of devices used for measuring brain activity through electrical signals. EEG equipment is widely used in medical diagnosis, research, and monitoring of brain functions in various neurological conditions such as epilepsy, sleep disorders, and brain injuries. Advancements in technology have led to the development of portable and wireless EEG devices, expanding their applications beyond clinical settings into home monitoring and cognitive enhancement. The market is driven by factors such as the increasing prevalence of neurological disorders, growing awareness about mental health, and ongoing research in neuroscience.
Global Electroencephalography (EEG) Equipment Market Synopsis
The Electroencephalography (EEG) Equipment Market witnessed significant impacts from the COVID-19 pandemic, with disruptions in manufacturing, supply chains, and healthcare services. The initial phase saw a decline in market growth due to temporary shutdowns of production facilities and reduced patient visits to healthcare facilities for non-urgent procedures. However, as the pandemic progressed, there was a growing demand for EEG equipment for monitoring neurological complications in COVID-19 patients and studying the effects of the virus on brain function.
Global Electroencephalography (EEG) Equipment Market Dynamics
The major factors that have impacted the growth of Electroencephalography (EEG) Equipment are as follows:
Drivers:
⮚ Technological Advancements
Continuous advancements in EEG technology, such as the development of portable EEG devices, wireless EEG systems, and improved signal processing techniques, are driving market growth. These advancements enhance the accuracy, reliability, and convenience of EEG testing, expanding its applications across various medical fields.
Restraint:
- Data Privacy and Ethical Concerns
EEG recordings contain sensitive patient information and physiological data, raising concerns about data privacy and security. Healthcare providers and EEG equipment manufacturers must adhere to stringent data protection regulations and implement robust cybersecurity measures to safeguard patient confidentiality and prevent unauthorized access or data breaches.
Opportunity:
⮚ Research and Development Initiatives
Collaborative research initiatives and public-private partnerships focused on neuroscience research and brain health present opportunities for advancing EEG technology and expanding its applications. Funding for research projects, clinical trials, and academic-industry collaborations can drive innovation in EEG equipment design, software development, and clinical validation studies.
`Electroencephalography (EEG) Equipment Market Segment Overview
By Product
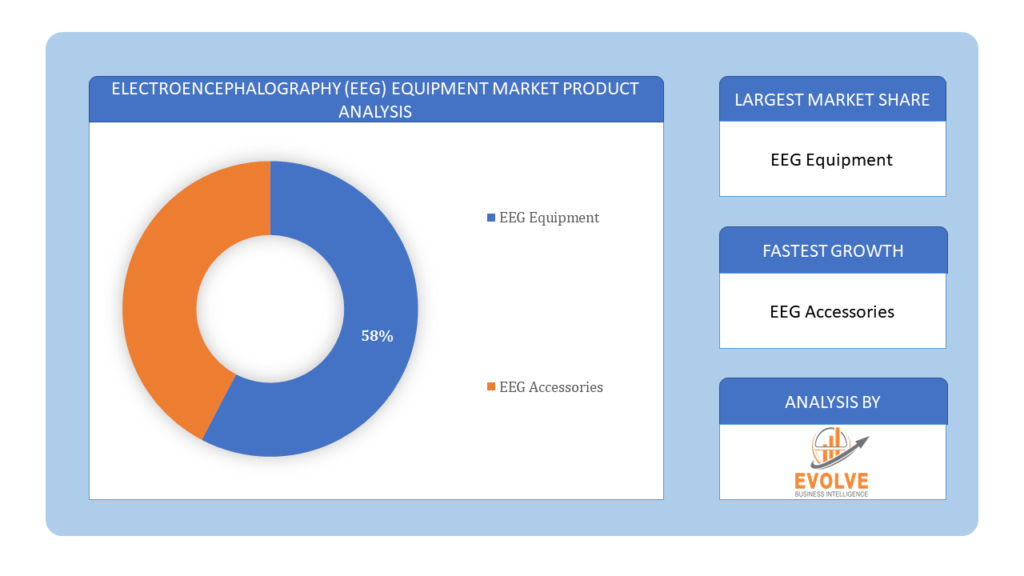
Based on the Product, the market is segmented based on EEG Equipment, and EEG Accessories. This dominance is attributed to the primary role of EEG machines in diagnosing neurological disorders, monitoring brain function, and guiding treatment decisions, making them essential tools in clinical practice and research settings.
By Application
Based on the Application, the market has been divided into Diseases Diagnosis, Sleep Monitoring, Anesthesia Monitoring, Trauma & Surgery, and Others. This category encompasses a diverse range of specialized applications beyond the conventional uses of EEG, including cognitive neuroscience research, brain-computer interface development, and neurofeedback therapy. The growing interest in exploring the brain’s complexities for various purposes drives the prominence of the “Others” segment, showcasing the versatility and expanding scope of EEG technology beyond traditional diagnostic and monitoring applications.
By End User
Based on End Users, the market has been divided into Hospitals, Diagnostic Centers, Surgical Centers, Research Laboratories, and Others. Hospitals account for a significant share of EEG equipment utilization due to the wide range of neurological conditions diagnosed and treated within these settings. Additionally, hospitals often have the infrastructure and expertise to perform EEG testing as part of comprehensive neurological care, driving their prominence in the market.
Global Electroencephalography (EEG) Equipment Market Regional Analysis
Based on region, the market has been divided into North America, Europe, Asia-Pacific, the Middle East & Africa, and Latin America. The area of North America is anticipated to dominate the market for the usage of Electroencephalography (EEG) Equipment, followed by those in Asia-Pacific and Europe.
Electroencephalography (EEG) Equipment North America Market
North America dominates the Electroencephalography (EEG) Equipment market due to several factors. With a market share of almost 39% in 2022, North America dominated the EEG device market, followed by Europe and Asia Pacific. The primary drivers of regional expansion are the increasing incidence of various sleep and neurodegenerative problems as well as the ease of obtaining insurance. Furthermore, growth is expected to be fueled by the region’s robust distribution and sales network of top vendors as well as the existence of a highly developed healthcare infrastructure.
Electroencephalography (EEG) Equipment Asia Pacific Market
The Asia-Pacific region has been witnessing remarkable growth in recent years. Europe is anticipated to exhibit consistent growth during the projected period due to the existence of a firmly developed healthcare system. The market is anticipated to experience more growth with the development of multiple non-profit organizations, including the European Multiple Sclerosis Platform (EMSP). Neurodegenerative disorders impact about 9 million people in Europe, according to EMSP.
Competitive Landscape
The competitive landscape includes key players (tier 1, tier 2, and local) having a presence across the globe. Companies such as Advanced Brain Monitoring, Cadwell Industries, CEPHALON, Compumedics, and Fresenius are some of the leading players in the global Electroencephalography (EEG) Equipment Industry. These players have adopted partnership, acquisition, expansion, and new product development, among others as their key strategies.
Key Market Players:
- Advanced Brain Monitoring
- Cadwell Industries
- CEPHALON
- Compumedics
- Fresenius
- General Electric (GE Healthcare)
- Koninklijke Philips (Philips Healthcare)
- Medtronic
- Natus Medical
- Nihon Kohden
Key development:
In September 2022, Cadwell Industries, a leading manufacturer of neurodiagnostic and monitoring solutions, announced the launch of its latest EEG equipment model featuring advanced signal processing capabilities and enhanced user interface. The new product release underscores Cadwell’s commitment to innovation in neurology diagnostics and its efforts to address evolving clinical needs in EEG testing and analysis.
Scope of the Report
Global Electroencephalography (EEG) Equipment Market, by Product
- EEG Equipment
- EEG Accessories
Global Electroencephalography (EEG) Equipment Market, by Application
- Diseases Diagnosis
- Sleep Monitoring
- Anesthesia Monitoring
- Trauma & Surgery
- Others
Global Electroencephalography (EEG) Equipment Market, by End User
- Hospitals
- Diagnostic Centers
- Surgical Centers
- Research Laboratories
- Others
Global Electroencephalography (EEG) Equipment Market, by Region
- North America
- US
- Canada
- Mexico
- Europe
- UK
- Germany
- France
- Italy
- Spain
- Benelux
- Nordic
- Rest of Europe
- Asia Pacific
- China
- Japan
- South Korea
- Indonesia
- Austalia
- Malaysia
- India
- Rest of Asia Pacific
- South America
- Brazil
- Argentina
- Rest of South America
- Middle East & Africa
- Saudi Arabia
- UAE
- Egypt
- South Africa
- Rest of Middle East & Africa
Parameters | Indicators |
---|---|
Market Size | 2033: $2.40 Billion |
CAGR | 9.54% CAGR (2023-2033) |
Base year | 2022 |
Forecast Period | 2023-2033 |
Historical Data | 2021 |
Report Coverage | Revenue Forecast, Competitive Landscape, Growth Factors, and Trends |
Key Segmentations | Product, Application, End User |
Geographies Covered | North America, Europe, Asia-Pacific, Latin America, Middle East, Africa |
Key Vendors | Advanced Brain Monitoring, Cadwell Industries, CEPHALON, Compumedics, Fresenius, General Electric (GE Healthcare), Koninklijke Philips (Philips Healthcare), Medtronic, Natus Medical, Nihon Kohden |
Key Market Opportunities | • Government Initiatives and Funding |
Key Market Drivers | • Technological Advancements |
REPORT CONTENT BRIEF:
- High-level analysis of the current and future Electroencephalography (EEG) Equipment Industry trends and opportunities
- Detailed analysis of current market drivers, restraining factors, and opportunities analysis in the future
- Historical market size for the year 2021, and forecast from 2023 to 2033
- Electroencephalography (EEG) Equipment market share analysis for each segment
- Competitor analysis with a comprehensive insight into its product segment, financial strength, and strategies adopted.
- Identifies key strategies adopted by the key players including new product development, mergers and acquisitions, joint ventures, collaborations, and partnerships.
- To identify and understand the various factors involved in the global Electroencephalography (EEG) Equipment market affected by the pandemic
- To provide year-on-year growth from 2022 to 2033
- To provide short-term, long-term, and overall CAGR comparison from 2022 to 2033.
- Provide Total Addressable Market (TAM) for the Global Electroencephalography (EEG) Equipment Market.
Press Release
Global Managed Services Market Forecast to Reach USD 847.21 Billion by 2034, Growing at a 7.14% CAGR
The Cosmetic Laser Market Is Estimated To Record a CAGR of Around 14.01% During The Forecast Period
Global Chloroprene Rubber Market Forecast to Reach USD 10.52 Billion by 2033, Growing at a 6.25% CAGR
The Cell Separation Market Is Estimated To Record a CAGR of Around 9.98% During The Forecast Period
The Solar Energy Systems Market Is Estimated To Record a CAGR of Around 5.78% During The Forecast Period
The Automotive Radar Market Is Estimated To Record a CAGR of Around 31.75% During The Forecast Period
Global Atrial Fibrillation Drugs Market Forecast to Reach USD 21.36 Billion by 2034, Growing at a 10.25% CAGR
The Alopecia Treatment Market Is Estimated To Record a CAGR of Around 10.95% During The Forecast Period
Global Sleep Tech Market Forecast to Reach USD 28.11 Billion by 2034, Growing at an 18.32% CAGR
Global Prebiotic Ingredient Market Forecast to Reach USD 13.85 Billion by 2034, Growing at a 10.25% CAGR
Frequently Asked Questions (FAQ)
What is the study period of the Electroencephalography (EEG) Equipment market?
The study period for the Electroencephalography (EEG) Equipment market extends from 2023 to 2033.
What is the growth rate of the Electroencephalography (EEG) Equipment market?
The Electroencephalography (EEG) Equipment market is expected to grow at a compound annual growth rate (CAGR) of 9.54% from 2023 to 2033, reaching an estimated value of USD 2.40 Billion by 2033.
Which region has the highest growth rate in the Electroencephalography (EEG) Equipment market?
North America is anticipated to dominate the Electroencephalography (EEG) Equipment market, followed by those in Asia-Pacific and Europe.
Which region has the largest share of the Electroencephalography (EEG) Equipment market?
North America holds the largest share of the Electroencephalography (EEG) Equipment market, with factors such as increasing incidence of various sleep and neurodegenerative problems, ease of obtaining insurance, and a robust distribution and sales network of top vendors contributing to its dominance.
Who are the key players in the Electroencephalography (EEG) Equipment market?
Key players in the Electroencephalography (EEG) Equipment market include Advanced Brain Monitoring, Cadwell Industries, CEPHALON, Compumedics, Fresenius, General Electric (GE Healthcare), Koninklijke Philips (Philips Healthcare), Medtronic, Natus Medical, and Nihon Kohden. These companies drive market growth through innovations in EEG technology catering to diverse applications in healthcare, research, and diagnostics.
Do you offer Post sales support?
Yes, we offer 16 hours of analyst support to solve the queries
Do you sell particular sections of a report?
Yes, we provide regional as well as country-level reports. Other than this we also provide a sectional report. Please get in contact with our sales representatives.
Table of Content
CHAPTER 1. Executive Summary
CHAPTER 2. Scope of the Study
2.1. Market Definition
2.2. Market Scope & Segmentation
2.2.1. Objective of Report
CHAPTER 3. Evolve BI Methodology
3.1. Data Collection & Validation Approach
3.2. Market Size Estimation and Forecast
CHAPTER 4. Exclusive Analysis
4.1. Market Opportunity Score
4.1.1. Product Segement – Market Opportunity Score
4.1.2. Application Segment – Market Opportunity Score
4.1.3. End User Segment – Market Opportunity Score
4.2. Key Market Influencing Indicators
CHAPTER 5. Market Insights and Trends
5.1. Value Chain Analysis
5.1.1. Raw Material
5.1.2. Manufacturing Process
5.1.3. Distribution Channel
5.1.4. End User
5.2. Porter’s Five Forces Analysis
5.2.1. Bargaining Power of Buyers
5.2.2. Bargaining Power of Suppliers
5.2.3. Threat of New Entrant
5.2.4. Threat of Substitute
5.2.5. Industry Rivalry
5.3. COVID-19 Impact and Post COVID Scenario on Electroencephalography (EEG) Equipment Market
5.3.1. Impact of COVID-19
5.3.2. Government Support and Industry Revival Policies
5.3.3. Measures Taken by Companies to Mitigate Negative Impact
5.3.4. Post COVID Trend
CHAPTER 6. MArket Dynamics
6.1. Introduction
6.2. Drivers
6.2.1. Driver 1
6.2.2. Driver 2
6.2.3. Driver 3
6.3. Restraints
6.3.1. Restraint 1
6.3.2. Restraint 2
6.4. Opportunity
6.4.1. Opportunity 1
CHAPTER 7. Global Electroencephalography (EEG) Equipment Market, By Product
7.1. Introduction
7.1.1. EEG Equipment
7.1.2. EEG Accessories
CHAPTER 8. Global Electroencephalography (EEG) Equipment Market, By Application
8.1. Introduction
8.1.1. Diseases Diagnosis
8.1.2. Sleep Monitoring
8.1.3. Anesthesia Monitoring
8.1.4. Trauma & Surgery
8.1.5. Others
CHAPTER 9. Global Electroencephalography (EEG) Equipment Market, By End User
9.1. Introduction
9.1.1. Hospitals
9.1.2. Diagnostic Centers
9.1.3. Surgical Centers
9.1.4. Research Laboratories
9.1.5. Others
CHAPTER 10. Global Electroencephalography (EEG) Equipment Market, By Region
10.1. Introduction
10.2. NORTH AMERICA
10.2.1. North America: Market Size and Forecast, By Country, 2023 – 2033 ($ Million)
10.2.2. North America: Market Size and Forecast, By Product, 2023 – 2033 ($ Million)
10.2.3. North America: Market Size and Forecast, By Application, 2023 – 2033 ($ Million)
10.2.4. North America: Market Size and Forecast, By End User, 2023 – 2033 ($ Million)
10.2.5. US
10.2.5.1. US: Market Size and Forecast, By Product, 2023 – 2033 ($ Million)
10.2.5.2. US: Market Size and Forecast, By Application, 2023 – 2033 ($ Million)
10.2.5.3. US: Market Size and Forecast, By End User, 2023 – 2033 ($ Million)
10.2.6. CANADA
10.2.6.1. Canada: Market Size and Forecast, By Product, 2023 – 2033 ($ Million)
10.2.6.2. Canada: Market Size and Forecast, By Application, 2023 – 2033 ($ Million)
10.2.6.3. Canada: Market Size and Forecast, By End User, 2023 – 2033 ($ Million)
10.2.7. MEXICO
10.2.7.1. Mexico: Market Size and Forecast, By Product, 2023 – 2033 ($ Million)
10.2.7.2. Mexico: Market Size and Forecast, By Application, 2023 – 2033 ($ Million)
10.2.7.3. Mexico: Market Size and Forecast, By End User, 2023 – 2033 ($ Million)
10.3. Europe
10.3.1. Europe: Market Size and Forecast, By Country, 2023 – 2033 ($ Million)
10.3.2. Europe: Market Size and Forecast, By Product, 2023 – 2033 ($ Million)
10.3.3. Europe: Market Size and Forecast, By Application, 2023 – 2033 ($ Million)
10.3.4. Europe: Market Size and Forecast, By End User, 2023 – 2033 ($ Million)
10.3.5. U.K.
10.3.5.1. U.K.: Market Size and Forecast, By Product, 2023 – 2033 ($ Million)
10.3.5.2. U.K.: Market Size and Forecast, By Application, 2023 – 2033 ($ Million)
10.3.5.3. U.K.: Market Size and Forecast, By End User, 2023 – 2033 ($ Million)
10.3.6. GERMANY
10.3.6.1. Germany: Market Size and Forecast, By Product, 2023 – 2033 ($ Million)
10.3.6.2. Germany: Market Size and Forecast, By Application, 2023 – 2033 ($ Million)
10.3.6.3. Germany: Market Size and Forecast, By End User, 2023 – 2033 ($ Million)
10.3.7. FRANCE
10.3.7.1. France: Market Size and Forecast, By Product, 2023 – 2033 ($ Million)
10.3.7.2. France: Market Size and Forecast, By Application, 2023 – 2033 ($ Million)
10.3.7.3. France: Market Size and Forecast, By End User, 2023 – 2033 ($ Million)
10.3.8. ITALY
10.3.8.1. Italy: Market Size and Forecast, By Product, 2023 – 2033 ($ Million)
10.3.8.2. Italy: Market Size and Forecast, By Application, 2023 – 2033 ($ Million)
10.3.8.3. Italy: Market Size and Forecast, By End User, 2023 – 2033 ($ Million)
10.3.9. SPAIN
10.3.9.1. Spain: Market Size and Forecast, By Product, 2023 – 2033 ($ Million)
10.3.9.2. Spain: Market Size and Forecast, By Application, 2023 – 2033 ($ Million)
10.3.9.3. Spain: Market Size and Forecast, By End User, 2023 – 2033 ($ Million)
10.3.10. BENELUX
10.3.10.1. BeNeLux: Market Size and Forecast, By Product, 2023 – 2033 ($ Million)
10.3.10.2. BeNeLux: Market Size and Forecast, By Application, 2023 – 2033 ($ Million)
10.3.10.3. BeNeLux: Market Size and Forecast, By End User, 2023 – 2033 ($ Million)
10.3.11. RUSSIA
10.3.11.1. Russia: Market Size and Forecast, By Product, 2023 – 2033 ($ Million)
10.3.11.2. Russia: Market Size and Forecast, By Application, 2023 – 2033 ($ Million)
10.3.11.3. Russia: Market Size and Forecast, By End User, 2023 – 2033 ($ Million)
10.3.12. REST OF EUROPE
10.3.12.1. Rest of Europe: Market Size and Forecast, By Product, 2023 – 2033 ($ Million)
10.3.12.2. Rest of Europe: Market Size and Forecast, By Application, 2023 – 2033 ($ Million)
10.3.12.3. Rest of Europe: Market Size and Forecast, By End User, 2023 – 2033 ($ Million)
10.4. Asia Pacific
10.4.1. Asia Pacific: Market Size and Forecast, By Country, 2023 – 2033 ($ Million)
10.4.2. Asia Pacific: Market Size and Forecast, By Product, 2023 – 2033 ($ Million)
10.4.3. Asia Pacific: Market Size and Forecast, By Application, 2023 – 2033 ($ Million)
10.4.4. Asia Pacific: Market Size and Forecast, By End User, 2023 – 2033 ($ Million)
10.4.5. CHINA
10.4.5.1. China: Market Size and Forecast, By Product, 2023 – 2033 ($ Million)
10.4.5.2. China: Market Size and Forecast, By Application, 2023 – 2033 ($ Million)
10.4.5.3. China: Market Size and Forecast, By End User, 2023 – 2033 ($ Million)
10.4.6. JAPAN
10.4.6.1. Japan: Market Size and Forecast, By Product, 2023 – 2033 ($ Million)
10.4.6.2. Japan: Market Size and Forecast, By Application, 2023 – 2033 ($ Million)
10.4.6.3. Japan: Market Size and Forecast, By End User, 2023 – 2033 ($ Million)
10.4.7. INDIA
10.4.7.1. India: Market Size and Forecast, By Product, 2023 – 2033 ($ Million)
10.4.7.2. India: Market Size and Forecast, By Application, 2023 – 2033 ($ Million)
10.4.7.3. India: Market Size and Forecast, By End User, 2023 – 2033 ($ Million)
10.4.8. SOUTH KOREA
10.4.8.1. South Korea: Market Size and Forecast, By Product, 2023 – 2033 ($ Million)
10.4.8.2. South Korea: Market Size and Forecast, By Application, 2023 – 2033 ($ Million)
10.4.8.3. South Korea: Market Size and Forecast, By End User, 2023 – 2033 ($ Million)
10.4.9. THAILAND
10.4.9.1. Thailand: Market Size and Forecast, By Product, 2023 – 2033 ($ Million)
10.4.9.2. Thailand: Market Size and Forecast, By Application, 2023 – 2033 ($ Million)
10.4.9.3. Thailand: Market Size and Forecast, By End User, 2023 – 2033 ($ Million)
10.4.10. INDONESIA
10.4.10.1. Indonesia: Market Size and Forecast, By Product, 2023 – 2033 ($ Million)
10.4.10.2. Indonesia: Market Size and Forecast, By Application, 2023 – 2033 ($ Million)
10.4.10.3. Indonesia: Market Size and Forecast, By End User, 2023 – 2033 ($ Million)
10.4.11. MALAYSIA
10.4.11.1. Malaysia: Market Size and Forecast, By Product, 2023 – 2033 ($ Million)
10.4.11.2. Malaysia: Market Size and Forecast, By Application, 2023 – 2033 ($ Million)
10.4.11.3. Malaysia: Market Size and Forecast, By End User, 2023 – 2033 ($ Million)
10.4.12. AUSTRALIA
10.4.12.1. Australia: Market Size and Forecast, By Product, 2023 – 2033 ($ Million)
10.4.12.2. Australia: Market Size and Forecast, By Application, 2023 – 2033 ($ Million)
10.4.12.3. Australia: Market Size and Forecast, By End User, 2023 – 2033 ($ Million)
10.4.13. REST FO ASIA PACIFIC
10.4.13.1. Rest fo Asia Pacific: Market Size and Forecast, By Product, 2023 – 2033 ($ Million)
10.4.13.2. Rest fo Asia Pacific: Market Size and Forecast, By Application, 2023 – 2033 ($ Million)
10.4.13.3. Rest fo Asia Pacific: Market Size and Forecast, By End User, 2023 – 2033 ($ Million)
10.5. South America
10.5.1. South America: Market Size and Forecast, By Country, 2023 – 2033 ($ Million)
10.5.2. South America: Market Size and Forecast, By Product, 2023 – 2033 ($ Million)
10.5.3. South America: Market Size and Forecast, By Application, 2023 – 2033 ($ Million)
10.5.4. South America: Market Size and Forecast, By End User, 2023 – 2033 ($ Million)
10.5.5. BRAZIL
10.5.5.1. Brazil: Market Size and Forecast, By Product, 2023 – 2033 ($ Million)
10.5.5.2. Brazil: Market Size and Forecast, By Application, 2023 – 2033 ($ Million)
10.5.5.3. Brazil: Market Size and Forecast, By End User, 2023 – 2033 ($ Million)
10.5.6. ARGENTINA
10.5.6.1. Argentina: Market Size and Forecast, By Product, 2023 – 2033 ($ Million)
10.5.6.2. Argentina: Market Size and Forecast, By Application, 2023 – 2033 ($ Million)
10.5.6.3. Argentina: Market Size and Forecast, By End User, 2023 – 2033 ($ Million)
10.5.7. REST OF SOUTH AMERICA
10.5.7.1. Rest of South America: Market Size and Forecast, By Product, 2023 – 2033 ($ Million)
10.5.7.2. Rest of South America: Market Size and Forecast, By Application, 2023 – 2033 ($ Million)
10.5.7.3. Rest of South America: Market Size and Forecast, By End User, 2023 – 2033 ($ Million)
10.6. Middle East & Africa
10.6.1. Middle East & Africa: Market Size and Forecast, By Country, 2023 – 2033 ($ Million)
10.6.2. Middle East & Africa: Market Size and Forecast, By Product, 2023 – 2033 ($ Million)
10.6.3. Middle East & Africa: Market Size and Forecast, By Application, 2023 – 2033 ($ Million)
10.6.4. Middle East & Africa: Market Size and Forecast, By End User, 2023 – 2033 ($ Million)
10.6.5. SAUDI ARABIA
10.6.5.1. Saudi Arabia: Market Size and Forecast, By Product, 2023 – 2033 ($ Million)
10.6.5.2. Saudi Arabia: Market Size and Forecast, By Application, 2023 – 2033 ($ Million)
10.6.5.3. Saudi Arabia: Market Size and Forecast, By End User, 2023 – 2033 ($ Million)
10.6.6. UAE
10.6.6.1. UAE: Market Size and Forecast, By Product, 2023 – 2033 ($ Million)
10.6.6.2. UAE: Market Size and Forecast, By Application, 2023 – 2033 ($ Million)
10.6.6.3. UAE: Market Size and Forecast, By End User, 2023 – 2033 ($ Million)
10.6.7. EGYPT
10.6.7.1. Egypt: Market Size and Forecast, By Product, 2023 – 2033 ($ Million)
10.6.7.2. Egypt: Market Size and Forecast, By Application, 2023 – 2033 ($ Million)
10.6.7.3. Egypt: Market Size and Forecast, By End User, 2023 – 2033 ($ Million)
10.6.8. SOUTH AFRICA
10.6.8.1. South Africa: Market Size and Forecast, By Product, 2023 – 2033 ($ Million)
10.6.8.2. South Africa: Market Size and Forecast, By Application, 2023 – 2033 ($ Million)
10.6.8.3. South Africa: Market Size and Forecast, By End User, 2023 – 2033 ($ Million)
10.6.9. REST OF MIDDLE EAST & AFRICA
10.6.9.1. Rest of Middle East & Africa: Market Size and Forecast, By Product, 2023 – 2033 ($ Million)
10.6.9.2. Rest of Middle East & Africa: Market Size and Forecast, By Application, 2023 – 2033 ($ Million)
10.6.9.3. Rest of Middle East & Africa: Market Size and Forecast, By End User, 2023 – 2033 ($ Million)
CHAPTER 12. Competitive Landscape
12.1. Competitior Benchmarking 2023
12.2. Market Share Analysis
12.3. Key Developments Analysis By Top 5 Companies
12.4. Market Share Acquisition Strategies: Analysis of Key Approaches Employed by Top Players
CHAPTER 13. Company Profiles
13.1. Advanced Brain Monitoring
13.1.1. Business Overview
13.1.2. Financial Analysis
13.1.2.1. Business Segment Revenue, 2020, 2021, 2022, $ Million
13.1.2.2. Geographic Revenue Mix, 2022 (% Share)
13.1.3. Product Portfolio
13.1.4. Recent Development and Strategies Adopted
13.1.5. SWOT Analysis
13.2. Cadwell Industries
13.3. CEPHALON
13.4. Compumedics
13.5. Fresenius
13.6. General Electric (GE Healthcare)
13.7. Koninklijke Philips (Philips Healthcare)
13.8. Medtronic
13.9. Natus Medical
13.10. Genie AI Ltd
Connect to Analyst
Research Methodology
CHAPTER 1. Executive Summary
CHAPTER 2. Scope of the Study
2.1. Market Definition
2.2. Market Scope & Segmentation
2.2.1. Objective of Report
CHAPTER 3. Evolve BI Methodology
3.1. Data Collection & Validation Approach
3.2. Market Size Estimation and Forecast
CHAPTER 4. Exclusive Analysis
4.1. Market Opportunity Score
4.1.1. Product Segement – Market Opportunity Score
4.1.2. Application Segment – Market Opportunity Score
4.1.3. End User Segment – Market Opportunity Score
4.2. Key Market Influencing Indicators
CHAPTER 5. Market Insights and Trends
5.1. Value Chain Analysis
5.1.1. Raw Material
5.1.2. Manufacturing Process
5.1.3. Distribution Channel
5.1.4. End User
5.2. Porter’s Five Forces Analysis
5.2.1. Bargaining Power of Buyers
5.2.2. Bargaining Power of Suppliers
5.2.3. Threat of New Entrant
5.2.4. Threat of Substitute
5.2.5. Industry Rivalry
5.3. COVID-19 Impact and Post COVID Scenario on Electroencephalography (EEG) Equipment Market
5.3.1. Impact of COVID-19
5.3.2. Government Support and Industry Revival Policies
5.3.3. Measures Taken by Companies to Mitigate Negative Impact
5.3.4. Post COVID Trend
CHAPTER 6. MArket Dynamics
6.1. Introduction
6.2. Drivers
6.2.1. Driver 1
6.2.2. Driver 2
6.2.3. Driver 3
6.3. Restraints
6.3.1. Restraint 1
6.3.2. Restraint 2
6.4. Opportunity
6.4.1. Opportunity 1
CHAPTER 7. Global Electroencephalography (EEG) Equipment Market, By Product
7.1. Introduction
7.1.1. EEG Equipment
7.1.2. EEG Accessories
CHAPTER 8. Global Electroencephalography (EEG) Equipment Market, By Application
8.1. Introduction
8.1.1. Diseases Diagnosis
8.1.2. Sleep Monitoring
8.1.3. Anesthesia Monitoring
8.1.4. Trauma & Surgery
8.1.5. Others
CHAPTER 9. Global Electroencephalography (EEG) Equipment Market, By End User
9.1. Introduction
9.1.1. Hospitals
9.1.2. Diagnostic Centers
9.1.3. Surgical Centers
9.1.4. Research Laboratories
9.1.5. Others
CHAPTER 10. Global Electroencephalography (EEG) Equipment Market, By Region
10.1. Introduction
10.2. NORTH AMERICA
10.2.1. North America: Market Size and Forecast, By Country, 2023 – 2033 ($ Million)
10.2.2. North America: Market Size and Forecast, By Product, 2023 – 2033 ($ Million)
10.2.3. North America: Market Size and Forecast, By Application, 2023 – 2033 ($ Million)
10.2.4. North America: Market Size and Forecast, By End User, 2023 – 2033 ($ Million)
10.2.5. US
10.2.5.1. US: Market Size and Forecast, By Product, 2023 – 2033 ($ Million)
10.2.5.2. US: Market Size and Forecast, By Application, 2023 – 2033 ($ Million)
10.2.5.3. US: Market Size and Forecast, By End User, 2023 – 2033 ($ Million)
10.2.6. CANADA
10.2.6.1. Canada: Market Size and Forecast, By Product, 2023 – 2033 ($ Million)
10.2.6.2. Canada: Market Size and Forecast, By Application, 2023 – 2033 ($ Million)
10.2.6.3. Canada: Market Size and Forecast, By End User, 2023 – 2033 ($ Million)
10.2.7. MEXICO
10.2.7.1. Mexico: Market Size and Forecast, By Product, 2023 – 2033 ($ Million)
10.2.7.2. Mexico: Market Size and Forecast, By Application, 2023 – 2033 ($ Million)
10.2.7.3. Mexico: Market Size and Forecast, By End User, 2023 – 2033 ($ Million)
10.3. Europe
10.3.1. Europe: Market Size and Forecast, By Country, 2023 – 2033 ($ Million)
10.3.2. Europe: Market Size and Forecast, By Product, 2023 – 2033 ($ Million)
10.3.3. Europe: Market Size and Forecast, By Application, 2023 – 2033 ($ Million)
10.3.4. Europe: Market Size and Forecast, By End User, 2023 – 2033 ($ Million)
10.3.5. U.K.
10.3.5.1. U.K.: Market Size and Forecast, By Product, 2023 – 2033 ($ Million)
10.3.5.2. U.K.: Market Size and Forecast, By Application, 2023 – 2033 ($ Million)
10.3.5.3. U.K.: Market Size and Forecast, By End User, 2023 – 2033 ($ Million)
10.3.6. GERMANY
10.3.6.1. Germany: Market Size and Forecast, By Product, 2023 – 2033 ($ Million)
10.3.6.2. Germany: Market Size and Forecast, By Application, 2023 – 2033 ($ Million)
10.3.6.3. Germany: Market Size and Forecast, By End User, 2023 – 2033 ($ Million)
10.3.7. FRANCE
10.3.7.1. France: Market Size and Forecast, By Product, 2023 – 2033 ($ Million)
10.3.7.2. France: Market Size and Forecast, By Application, 2023 – 2033 ($ Million)
10.3.7.3. France: Market Size and Forecast, By End User, 2023 – 2033 ($ Million)
10.3.8. ITALY
10.3.8.1. Italy: Market Size and Forecast, By Product, 2023 – 2033 ($ Million)
10.3.8.2. Italy: Market Size and Forecast, By Application, 2023 – 2033 ($ Million)
10.3.8.3. Italy: Market Size and Forecast, By End User, 2023 – 2033 ($ Million)
10.3.9. SPAIN
10.3.9.1. Spain: Market Size and Forecast, By Product, 2023 – 2033 ($ Million)
10.3.9.2. Spain: Market Size and Forecast, By Application, 2023 – 2033 ($ Million)
10.3.9.3. Spain: Market Size and Forecast, By End User, 2023 – 2033 ($ Million)
10.3.10. BENELUX
10.3.10.1. BeNeLux: Market Size and Forecast, By Product, 2023 – 2033 ($ Million)
10.3.10.2. BeNeLux: Market Size and Forecast, By Application, 2023 – 2033 ($ Million)
10.3.10.3. BeNeLux: Market Size and Forecast, By End User, 2023 – 2033 ($ Million)
10.3.11. RUSSIA
10.3.11.1. Russia: Market Size and Forecast, By Product, 2023 – 2033 ($ Million)
10.3.11.2. Russia: Market Size and Forecast, By Application, 2023 – 2033 ($ Million)
10.3.11.3. Russia: Market Size and Forecast, By End User, 2023 – 2033 ($ Million)
10.3.12. REST OF EUROPE
10.3.12.1. Rest of Europe: Market Size and Forecast, By Product, 2023 – 2033 ($ Million)
10.3.12.2. Rest of Europe: Market Size and Forecast, By Application, 2023 – 2033 ($ Million)
10.3.12.3. Rest of Europe: Market Size and Forecast, By End User, 2023 – 2033 ($ Million)
10.4. Asia Pacific
10.4.1. Asia Pacific: Market Size and Forecast, By Country, 2023 – 2033 ($ Million)
10.4.2. Asia Pacific: Market Size and Forecast, By Product, 2023 – 2033 ($ Million)
10.4.3. Asia Pacific: Market Size and Forecast, By Application, 2023 – 2033 ($ Million)
10.4.4. Asia Pacific: Market Size and Forecast, By End User, 2023 – 2033 ($ Million)
10.4.5. CHINA
10.4.5.1. China: Market Size and Forecast, By Product, 2023 – 2033 ($ Million)
10.4.5.2. China: Market Size and Forecast, By Application, 2023 – 2033 ($ Million)
10.4.5.3. China: Market Size and Forecast, By End User, 2023 – 2033 ($ Million)
10.4.6. JAPAN
10.4.6.1. Japan: Market Size and Forecast, By Product, 2023 – 2033 ($ Million)
10.4.6.2. Japan: Market Size and Forecast, By Application, 2023 – 2033 ($ Million)
10.4.6.3. Japan: Market Size and Forecast, By End User, 2023 – 2033 ($ Million)
10.4.7. INDIA
10.4.7.1. India: Market Size and Forecast, By Product, 2023 – 2033 ($ Million)
10.4.7.2. India: Market Size and Forecast, By Application, 2023 – 2033 ($ Million)
10.4.7.3. India: Market Size and Forecast, By End User, 2023 – 2033 ($ Million)
10.4.8. SOUTH KOREA
10.4.8.1. South Korea: Market Size and Forecast, By Product, 2023 – 2033 ($ Million)
10.4.8.2. South Korea: Market Size and Forecast, By Application, 2023 – 2033 ($ Million)
10.4.8.3. South Korea: Market Size and Forecast, By End User, 2023 – 2033 ($ Million)
10.4.9. THAILAND
10.4.9.1. Thailand: Market Size and Forecast, By Product, 2023 – 2033 ($ Million)
10.4.9.2. Thailand: Market Size and Forecast, By Application, 2023 – 2033 ($ Million)
10.4.9.3. Thailand: Market Size and Forecast, By End User, 2023 – 2033 ($ Million)
10.4.10. INDONESIA
10.4.10.1. Indonesia: Market Size and Forecast, By Product, 2023 – 2033 ($ Million)
10.4.10.2. Indonesia: Market Size and Forecast, By Application, 2023 – 2033 ($ Million)
10.4.10.3. Indonesia: Market Size and Forecast, By End User, 2023 – 2033 ($ Million)
10.4.11. MALAYSIA
10.4.11.1. Malaysia: Market Size and Forecast, By Product, 2023 – 2033 ($ Million)
10.4.11.2. Malaysia: Market Size and Forecast, By Application, 2023 – 2033 ($ Million)
10.4.11.3. Malaysia: Market Size and Forecast, By End User, 2023 – 2033 ($ Million)
10.4.12. AUSTRALIA
10.4.12.1. Australia: Market Size and Forecast, By Product, 2023 – 2033 ($ Million)
10.4.12.2. Australia: Market Size and Forecast, By Application, 2023 – 2033 ($ Million)
10.4.12.3. Australia: Market Size and Forecast, By End User, 2023 – 2033 ($ Million)
10.4.13. REST FO ASIA PACIFIC
10.4.13.1. Rest fo Asia Pacific: Market Size and Forecast, By Product, 2023 – 2033 ($ Million)
10.4.13.2. Rest fo Asia Pacific: Market Size and Forecast, By Application, 2023 – 2033 ($ Million)
10.4.13.3. Rest fo Asia Pacific: Market Size and Forecast, By End User, 2023 – 2033 ($ Million)
10.5. South America
10.5.1. South America: Market Size and Forecast, By Country, 2023 – 2033 ($ Million)
10.5.2. South America: Market Size and Forecast, By Product, 2023 – 2033 ($ Million)
10.5.3. South America: Market Size and Forecast, By Application, 2023 – 2033 ($ Million)
10.5.4. South America: Market Size and Forecast, By End User, 2023 – 2033 ($ Million)
10.5.5. BRAZIL
10.5.5.1. Brazil: Market Size and Forecast, By Product, 2023 – 2033 ($ Million)
10.5.5.2. Brazil: Market Size and Forecast, By Application, 2023 – 2033 ($ Million)
10.5.5.3. Brazil: Market Size and Forecast, By End User, 2023 – 2033 ($ Million)
10.5.6. ARGENTINA
10.5.6.1. Argentina: Market Size and Forecast, By Product, 2023 – 2033 ($ Million)
10.5.6.2. Argentina: Market Size and Forecast, By Application, 2023 – 2033 ($ Million)
10.5.6.3. Argentina: Market Size and Forecast, By End User, 2023 – 2033 ($ Million)
10.5.7. REST OF SOUTH AMERICA
10.5.7.1. Rest of South America: Market Size and Forecast, By Product, 2023 – 2033 ($ Million)
10.5.7.2. Rest of South America: Market Size and Forecast, By Application, 2023 – 2033 ($ Million)
10.5.7.3. Rest of South America: Market Size and Forecast, By End User, 2023 – 2033 ($ Million)
10.6. Middle East & Africa
10.6.1. Middle East & Africa: Market Size and Forecast, By Country, 2023 – 2033 ($ Million)
10.6.2. Middle East & Africa: Market Size and Forecast, By Product, 2023 – 2033 ($ Million)
10.6.3. Middle East & Africa: Market Size and Forecast, By Application, 2023 – 2033 ($ Million)
10.6.4. Middle East & Africa: Market Size and Forecast, By End User, 2023 – 2033 ($ Million)
10.6.5. SAUDI ARABIA
10.6.5.1. Saudi Arabia: Market Size and Forecast, By Product, 2023 – 2033 ($ Million)
10.6.5.2. Saudi Arabia: Market Size and Forecast, By Application, 2023 – 2033 ($ Million)
10.6.5.3. Saudi Arabia: Market Size and Forecast, By End User, 2023 – 2033 ($ Million)
10.6.6. UAE
10.6.6.1. UAE: Market Size and Forecast, By Product, 2023 – 2033 ($ Million)
10.6.6.2. UAE: Market Size and Forecast, By Application, 2023 – 2033 ($ Million)
10.6.6.3. UAE: Market Size and Forecast, By End User, 2023 – 2033 ($ Million)
10.6.7. EGYPT
10.6.7.1. Egypt: Market Size and Forecast, By Product, 2023 – 2033 ($ Million)
10.6.7.2. Egypt: Market Size and Forecast, By Application, 2023 – 2033 ($ Million)
10.6.7.3. Egypt: Market Size and Forecast, By End User, 2023 – 2033 ($ Million)
10.6.8. SOUTH AFRICA
10.6.8.1. South Africa: Market Size and Forecast, By Product, 2023 – 2033 ($ Million)
10.6.8.2. South Africa: Market Size and Forecast, By Application, 2023 – 2033 ($ Million)
10.6.8.3. South Africa: Market Size and Forecast, By End User, 2023 – 2033 ($ Million)
10.6.9. REST OF MIDDLE EAST & AFRICA
10.6.9.1. Rest of Middle East & Africa: Market Size and Forecast, By Product, 2023 – 2033 ($ Million)
10.6.9.2. Rest of Middle East & Africa: Market Size and Forecast, By Application, 2023 – 2033 ($ Million)
10.6.9.3. Rest of Middle East & Africa: Market Size and Forecast, By End User, 2023 – 2033 ($ Million)
CHAPTER 12. Competitive Landscape
12.1. Competitior Benchmarking 2023
12.2. Market Share Analysis
12.3. Key Developments Analysis By Top 5 Companies
12.4. Market Share Acquisition Strategies: Analysis of Key Approaches Employed by Top Players
CHAPTER 13. Company Profiles
13.1. Advanced Brain Monitoring
13.1.1. Business Overview
13.1.2. Financial Analysis
13.1.2.1. Business Segment Revenue, 2020, 2021, 2022, $ Million
13.1.2.2. Geographic Revenue Mix, 2022 (% Share)
13.1.3. Product Portfolio
13.1.4. Recent Development and Strategies Adopted
13.1.5. SWOT Analysis
13.2. Cadwell Industries
13.3. CEPHALON
13.4. Compumedics
13.5. Fresenius
13.6. General Electric (GE Healthcare)
13.7. Koninklijke Philips (Philips Healthcare)
13.8. Medtronic
13.9. Natus Medical
13.10. Genie AI Ltd