Web Performance Testing Market Analysis and Global Forecast 2023-2033
Price range: $ 1,390.00 through $ 5,520.00
Web Performance Testing Market Research Report: By Component (Software, Services), By Deployment Type (On-premises, Cloud), By End-User (BFSI, IT and Telecom, Retail, Automotive, Government, Healthcare, Other), and by Region — Forecast till 2033
Web Performance Testing Market Overview
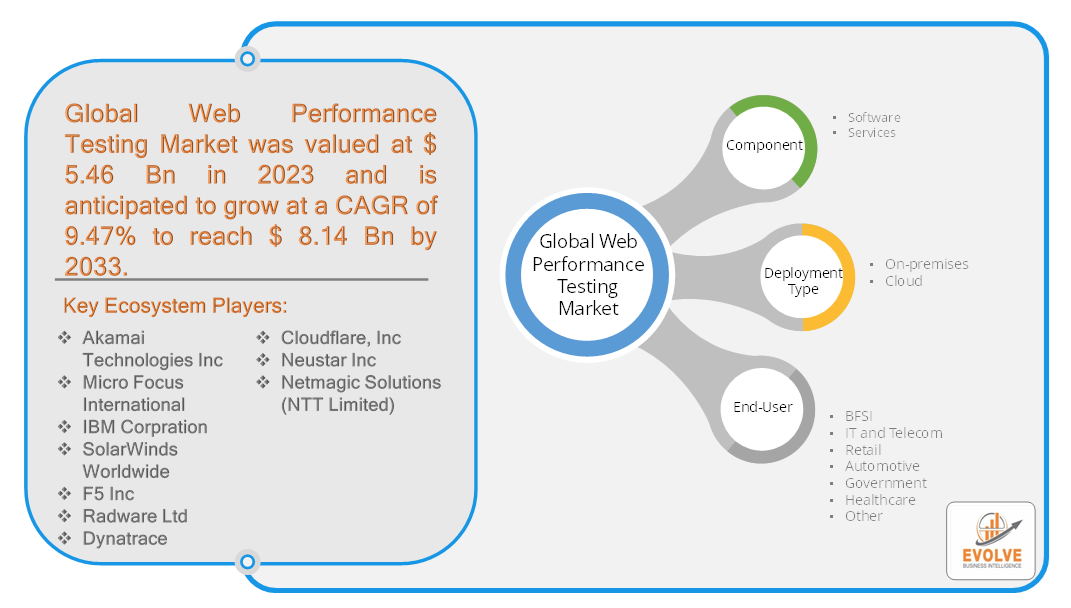
The web Performance Testing Market Size is expected to reach USD 8.14 Billion by 2033. The Web Performance Testing industry’s size accounted for USD 5.46 Billion in 2023 and is expected to expand at a compound annual growth rate (CAGR) of 9.47% from 2023 to 2033. Web Performance Testing refers to the comprehensive process of assessing and evaluating the performance characteristics of web applications and websites. It involves systematically measuring, analyzing, and optimizing various aspects of web performance, including page load times, response times, scalability, reliability, and overall user experience. By employing specialized tools, techniques, and methodologies, web performance testing aims to identify and address performance bottlenecks, optimize resource utilization, and ensure optimal functionality across different web browsers, platforms, and network conditions. This proactive approach enables organizations to deliver high-performing web applications that meet end-user expectations, enhance customer satisfaction, maximize business productivity, and maintain a competitive edge in the digital landscape.
Global Web Performance Testing Market Synopsis
COVID-19 Impact Analysis
the Covid-19 pandemic has had a significant impact on the Web Performance Testing market. As the global health crisis unfolded, businesses and organizations across industries faced a sudden surge in online activities and increased reliance on digital platforms for various purposes, including remote work, e-commerce, online learning, and virtual communication. This unprecedented shift towards online channels resulted in a higher demand for web applications and websites, leading to an increased need for effective web performance testing. The pandemic exposed the vulnerabilities and limitations of many existing web infrastructures, as the sudden influx of traffic and usage created performance challenges. Organizations realized the critical importance of ensuring seamless user experiences, optimal page load times, and reliable performance, especially with the growing expectations of users in a digital-first environment.
Global Web Performance Testing Market Dynamics
The major factors that have impacted the growth of Web Performance Testing are as follows:
Drivers:
Increasing Demand for High-Performing Web Applications
The growing reliance on web applications for various purposes, including e-commerce, online services, and remote work, has led to a significant increase in demand for high-performing web applications. Organizations are recognizing the importance of delivering seamless user experiences, fast page load times, and reliable performance to meet customer expectations and gain a competitive edge. This drives the need for effective web performance testing solutions.
Restraint:
- Complexity in Testing Web Applications
Web applications have become increasingly complex with the advent of dynamic content, personalized experiences, and integration with various backend systems and third-party services. Testing such complex web applications for performance can be challenging, as it requires expertise, comprehensive test scenarios, and adequate infrastructure. The complexity involved in web performance testing can act as a restraint for organizations, especially those with limited resources or expertise, in effectively conducting thorough performance testing.
Opportunity:
Rapid Growth in Mobile and IoT Applications
The proliferation of mobile devices and the Internet of Things (IoT) has resulted in a significant increase in mobile and IoT applications. These applications require optimal performance across a wide range of devices and network conditions. The web performance testing market has an opportunity to cater to this growing segment by offering solutions and methodologies that ensure the performance, responsiveness, and scalability of mobile and IoT applications. Furthermore, the shift towards progressive web applications (PWAs) and single-page applications (SPAs) presents an opportunity for web performance testing. PWAs and SPAs offer enhanced user experiences but require meticulous performance testing to ensure smooth navigation, fast loading, and efficient resource management.
Web Performance Testing Market Segment Overview
By Component
Based on Components, the market is segmented based on Software and Services. The software segment dominates the web performance testing market. In the web performance testing industry, various software tools and solutions are employed to assess and evaluate the performance, speed, scalability, and responsiveness of web applications and websites. These tools are designed to simulate user interactions, generate traffic, and measure key performance indicators to identify bottlenecks and optimize performance.
By Deployment Type
Based on Deployment Type, the market has been divided into On-premises and Cloud. The Cloud segment is expected to hold the largest market share in the Market, The increasing adoption of cloud computing and the growing popularity of Software-as-a-Service (SaaS) models have significantly influenced the web performance testing landscape.
By End-User
 Based on End-User, the market has been divided into BFSI, IT and Telecom, Retail, Automotive, Government, Healthcare, and Others. The market is projected to see significant growth in the Retail segment. The retail industry has undergone a significant transformation in recent years, with the rapid growth of e-commerce and the increasing importance of delivering a seamless online shopping experience. As a result, retailers are increasingly prioritizing web performance testing to ensure their websites and applications meet customer expectations and drive online sales.
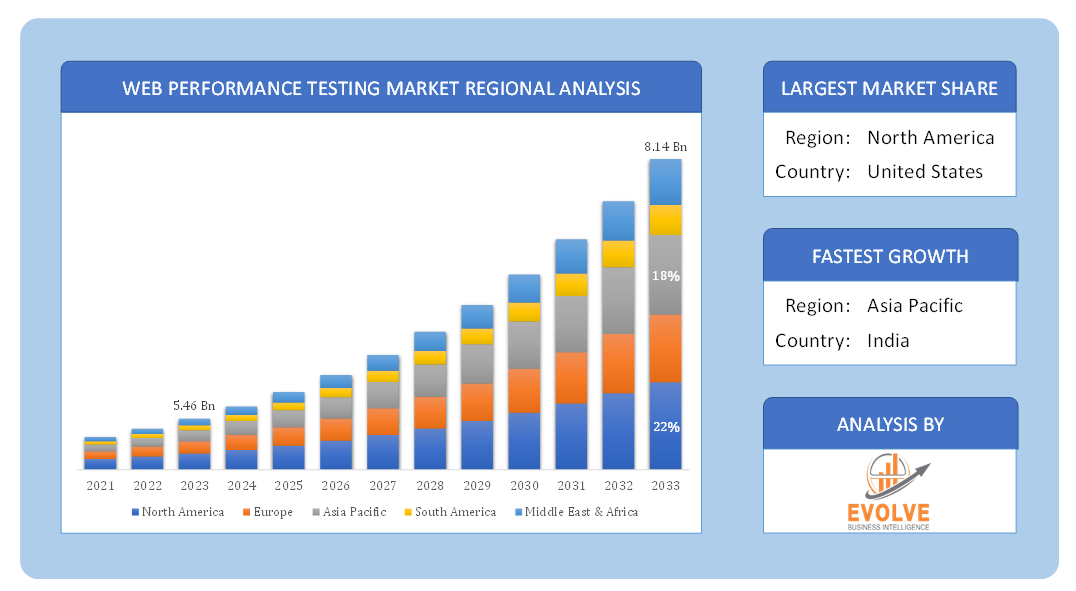
Global Web Performance Testing Market Regional Analysis
Based on region, the market has been divided into North America, Europe, Asia-Pacific, the Middle East & Africa, and Latin America. The area of North America is anticipated to dominate the market for the usage of Web Performance Testing, followed by those in Asia-Pacific and Europe.
 North America Market
the North American region has indeed emerged as a prominent market for web performance testing. North America, which includes countries such as the US and Canada, is home to a large number of businesses, technology companies, and digital service providers. As the importance of web-based applications and online services continues to grow, the demand for ensuring optimal web performance has also increased. In North America, organizations across industries such as e-commerce, finance, healthcare, entertainment, and technology heavily rely on web applications and services to drive their businesses. These companies understand the significance of delivering a fast, reliable, and high-performing user experience to attract and retain customers. As a result, there is a growing need for web performance testing tools, services, and expertise in the North American market. Numerous companies specializing in web performance testing, load testing, and performance monitoring have emerged to cater to this demand. These companies offer a range of solutions, including performance testing tools, cloud-based testing platforms, consulting services, and managed testing services.
Asia Pacific Market
The Asia-Pacific region has been emerging as a significant and rapidly growing market for the web performance testing industry. The region encompasses countries such as China, Japan, India, Australia, South Korea, and several Southeast Asian nations, which collectively represent a substantial portion of the global population and have a rapidly expanding digital landscape. The Asia-Pacific region has experienced remarkable growth in internet connectivity, smartphone adoption, and e-commerce activities. As a result, businesses in this region heavily rely on web-based applications, online services, and digital platforms to reach and engage with their customers. Ensuring optimal web performance is crucial for these companies to deliver a seamless user experience, build customer trust, and drive business growth.
Competitive Landscape
The competitive landscape includes key players (tier 1, tier 2, and local) having a presence across the globe. Companies such as IBM Corporation, SolarWinds Worldwide, F5 Inc, Radware Ltd, and Dynatrace are some of the leading players in the global Web Performance Testing Industry. These players have adopted partnership, acquisition, expansion, and new product development, among others as their key strategies.
Key Market Players:
- Akamai Technologies Inc
- Micro Focus International
- IBM Corporation
- SolarWinds Worldwide
- F5 Inc
- Radware Ltd
- Dynatrace
- Cloudflare, Inc
- Neustar Inc
- Netmagic Solutions (NTT Limited)
Key Development:
In May 2020, Cisco announced its plan to acquire ThousandEyes, Inc. The purpose of this acquisition is to enhance visibility across the enterprise, web, and cloud within the AppDynamics application intelligence section. By integrating ThousandEyes’ capabilities, Cisco aims to provide a more comprehensive and detailed view to identify shortcomings and enhance web and application performance across all networks that businesses rely on. This acquisition will enable end-to-end visibility when accessing cloud applications, enabling organizations to pinpoint deficiencies and optimize their performance effectively.
Scope of the Report
Global Web Performance Testing Market, by Component
- Software
- Services
Global Web Performance Testing Market, by Deployment Type
- On-premises
- Cloud
Global Web Performance Testing Market, by End-User
- BFSI
- IT and Telecom
- Retail
- Automotive
- Government
- Healthcare
- Other
Global Web Performance Testing Market, by Region
- North America
- US
- Canada
- Mexico
- Europe
- UK
- Germany
- France
- Italy
- Spain
- Benelux
- Nordic
- Rest of Europe
- Asia Pacific
- China
- Japan
- South Korea
- Indonesia
- Austalia
- Malaysia
- India
- Rest of Asia Pacific
- South America
- Brazil
- Argentina
- Rest of South America
- Middle East & Africa
- Saudi Arabia
- UAE
- Egypt
- South Africa
- Rest of Middle East & Africa
| Parameters | Indicators |
|---|---|
| Market Size | 2033: $8.14 Billion |
| CAGR | 9.47% CAGR (2023-2033) |
| Base year | 2022 |
| Forecast Period | 2023-2033 |
| Historical Data | 2021 |
| Report Coverage | Revenue Forecast, Competitive Landscape, Growth Factors, and Trends |
| Key Segmentations | Component, Deployment Type, End-User |
| Geographies Covered | North America, Europe, Asia-Pacific, Latin America, Middle East, Africa |
| Key Vendors | Akamai Technologies Inc, Micro Focus International, IBM Corporation, SolarWinds Worldwide, F5 Inc, Radware Ltd, Dynatrace, Cloudflare Inc, Neustar Inc, Netmagic Solutions (NTT Limited) |
| Key Market Opportunities | • Cloud-Based Testing Solutions • Emerging Technologies |
| Key Market Drivers | • Increasing Emphasis on User Experience • A Rise in Digital Transformation Initiatives |
REPORT CONTENT BRIEF:
- High-level analysis of the current and future Web Performance Testing Industry trends and opportunities
- Detailed analysis of current market drivers, restraining factors, and opportunities analysis in the future
- Historical market size for the year 2021, and forecast from 2023 to 2033
- Web Performance Testing market share analysis for each segment
- Competitor analysis with a comprehensive insight into its product segment, financial strength, and strategies adopted.
- Identifies key strategies adopted by the key players including new product development, mergers and acquisitions, joint ventures, collaborations, and partnerships.
- To identify and understand the various factors involved in the global Web Performance Testing market affected by the pandemic
- To provide year-on-year growth from 2022 to 2033
- To provide short-term, long-term, and overall CAGR comparison from 2022 to 2033.
- Provide Total Addressable Market (TAM) for the Global Web Performance Testing Market.
Frequently Asked Questions (FAQ)
Press Release

Global Pharmaceutical Manufacturing Market to Reach $1.38 Trillion by 2035 with 7.35% CAGR, New Research Shows
The Global Mammography Market Is Estimated To Record a CAGR of Around 10.29% During The Forecast Period
Glue Stick Market to Reach USD 2.35 Billion by 2034
Podiatry Service Market to Reach USD 11.88 Billion by 2034
Microfluidics Technology Market to Reach USD 32.58 Billion by 2034
Ferric Chloride Market to Reach USD 10.65 Billion by 2034
Family Practice EMR Software Market to Reach USD 21.52 Billion by 2034
Electric Hairbrush Market to Reach USD 15.95 Billion by 2034
Daily Bamboo Products Market to Reach USD 143.52 Billion by 2034
Cross-border E-commerce Logistics Market to Reach USD 112.65 Billion by 2034

Hydrogen Fuel Cell Market Analysis and Global Forecast 2023-2035
Hydrogen Fuel Cell Market Research Report: Information by Type (Proton Exchange Membrane Fuel cells, Phosphoric Acid Fuel Cells, Solid Oxide Fuel Cells, Molten Carbonate Fuel Cells, Others), By Application (Stationary, Transportation, Portable), By End-Use (Fuel Cell Vehicles, Utilities, Defense), and by Region — Forecast till 2033
Page: 116
HoReCa Market Analysis and Global Forecast 2023-2035
HoReCa Market Research Report: Information By Service Type (Hotels, Restaurants, Cafés, Pubs), By Category (Single Outlet, HoReCa Chain), and by Region — Forecast till 2035
Page: 116
Medical Nitrile Gloves Market Analysis and Global Forecast 2023-2033
Medical Nitrile Gloves Market Research Report: Information By Type (Powdered gloves, Non-powdered gloves), By Usage (Disposable, Reusable), By Application (Medical & Healthcare, Food Industry, Cleaning Industry, Others), By End Use (Ambulatory Surgery Centers, Diagnostic Centers, Rehabilitation Centers), and by Region — Forecast till 2033
Page: 116
Bidets Market Analysis and US Forecast 2023-2033
US Bidets Market By Type (Ceramic Bidets, Over the Rim Bidets, Handheld Bidets, Others), By Category (Electronics, Manual), By Distribution Channel (Store-Based, Non-Store-Based), By End Use (Residential, Commercial) and By Geography – COVID-19 Impact Analysis, Post COVID Analysis, Opportunities, Trends and Forecast from 2021 to 2028
Report Code: EB_LS_1279 | Page: 59 | Published Date: April 2022
Semiconductor Rectifiers Market Analysis and Global Forecast 2023-2033
Semiconductor Rectifiers Market Research Report: Information By Type (Half Wave, Full Wave), By Industry Vertical (Communication, Consumer Electronics, Automotive, Manufacturing), and by Region — Forecast till 2033
Page: 165


1. What is the study period of this market
- The study period of the global Web Performance Testing market is 2022- 2033
2. What are the 10 Years CAGR (2023 to 2033) of the global Web Performance Testing market?
- The global Web Performance Testing market is growing at a CAGR of ~47% over the next 10 years
3. Which region has the highest growth rate in the market of Web Performance Testing?
- Asia Pacific is expected to register the highest CAGR during 2023-2033
4. Which region accounted for the largest share of the market of Web Performance Testing?
- North America holds the largest share in 2022
5. Major Key Players in the Market of Web Performance Testing?
- Akamai Technologies Inc, Micro Focus International, IBM Corporation, SolarWinds Worldwide, F5 Inc, Radware Ltd, Dynatrace, Cloudflare Inc, Neustar Inc, and Netmagic Solutions (NTT Limited) are the major companies operating in the Web Performance Testing
6. Do you offer Post Sale Support?
- Yes, we offer 16 hours of analyst support to solve the queries
7. Do you deliver sections of a report?
Yes, we do provide regional as well as country-level reports. Other than this we also provide a sectional report. Please get in contact with our sales representatives.
Table of Content
CHAPTER 1. Executive Summary CHAPTER 2. Scope of the Study 2.1. Market Definition 2.2. Market Scope & Segmentation 2.2.1. Objective of Report CHAPTER 3. Evolve BI Methodology 3.1. Data Collection & Validation Approach 3.2. Market Size Estimation and Forecast CHAPTER 4. Exclusive Analysis 4.1. Market Opportunity Score 4.1.1. Component Segement – Market Opportunity Score 4.1.2. Deployment Type Segment – Market Opportunity Score 4.1.3. End-User Segment – Market Opportunity Score 4.2. Key Market Influencing Indicators CHAPTER 5. Market Insights and Trends 5.1. Value Chain Analysis 5.1.1. Raw Material 5.1.2. Manufacturing Process 5.1.3. Software 5.1.4. End User 5.2. Porter’s Five Forces Analysis 5.2.1. Bargaining Power of Buyers 5.2.2. Bargaining Power of Suppliers 5.2.3. Threat of New Entrant 5.2.4. Threat of Substitute 5.2.5. Industry Rivalry 5.3. COVID-19 Impact and Post COVID Scenario on Web Performance Testing Market 5.3.1. Impact of COVID-19 5.3.2. Government Support and Industry Revival Policies 5.3.3. Measures Taken by Companies to Mitigate Negative Impact 5.3.4. Post COVID Trend CHAPTER 6. MArket Dynamics 6.1. Introduction 6.2. Drivers 6.2.1. Driver 1 6.2.2. Driver 2 6.2.3. Driver 3 6.3. Restraints 6.3.1. Restraint 1 6.3.2. Restraint 2 6.4. Opportunity 6.4.1. Opportunity 1 CHAPTER 7. Global Web Performance Testing Market, By Component 7.1. Introduction 7.1.1. Software 7.1.2. Services CHAPTER 8. Global Web Performance Testing Market, By Deployment Type 8.1. Introduction 8.1.1. On-premises 8.1.2. Cloud CHAPTER 9. Global Web Performance Testing Market, By End-User 9.1. Introduction 9.1.1. BFSI 9.1.2. IT and Telecom 9.1.3. BFSI 9.1.4. Retail 9.1.5. Automotive 9.1.6. Government 9.1.7. Healthcare 9.1.8. Other CHAPTER 10. Global Web Performance Testing Market, By Region 10.1. Introduction 10.2. NORTH AMERICA 10.2.1. North America: Market Size and Forecast, By Country, 2023 – 2033 ($ Million) 10.2.2. North America: Market Size and Forecast, By Component, 2023 – 2033 ($ Million) 10.2.3. North America: Market Size and Forecast, By Deployment Type, 2023 – 2033 ($ Million) 10.2.4. North America: Market Size and Forecast, By End-User, 2023 – 2033 ($ Million) 10.2.5. US 10.2.5.1. US: Market Size and Forecast, By Component, 2023 – 2033 ($ Million) 10.2.5.2. US: Market Size and Forecast, By Deployment Type, 2023 – 2033 ($ Million) 10.2.5.3. US: Market Size and Forecast, By End-User, 2023 – 2033 ($ Million) 10.2.6. CANADA 10.2.6.1. Canada: Market Size and Forecast, By Component, 2023 – 2033 ($ Million) 10.2.6.2. Canada: Market Size and Forecast, By Deployment Type, 2023 – 2033 ($ Million) 10.2.6.3. Canada: Market Size and Forecast, By End-User, 2023 – 2033 ($ Million) 10.2.7. MEXICO 10.2.7.1. Mexico: Market Size and Forecast, By Component, 2023 – 2033 ($ Million) 10.2.7.2. Mexico: Market Size and Forecast, By Deployment Type, 2023 – 2033 ($ Million) 10.2.7.3. Mexico: Market Size and Forecast, By End-User, 2023 – 2033 ($ Million) 10.3. Europe 10.3.1. Europe: Market Size and Forecast, By Country, 2023 – 2033 ($ Million) 10.3.2. Europe: Market Size and Forecast, By Component, 2023 – 2033 ($ Million) 10.3.3. Europe: Market Size and Forecast, By Deployment Type, 2023 – 2033 ($ Million) 10.3.4. Europe: Market Size and Forecast, By End-User, 2023 – 2033 ($ Million) 10.3.5. U.K. 10.3.5.1. U.K.: Market Size and Forecast, By Component, 2023 – 2033 ($ Million) 10.3.5.2. U.K.: Market Size and Forecast, By Deployment Type, 2023 – 2033 ($ Million) 10.3.5.3. U.K.: Market Size and Forecast, By End-User, 2023 – 2033 ($ Million) 10.3.6. GERMANY 10.3.6.1. Germany: Market Size and Forecast, By Component, 2023 – 2033 ($ Million) 10.3.6.2. Germany: Market Size and Forecast, By Deployment Type, 2023 – 2033 ($ Million) 10.3.6.3. Germany: Market Size and Forecast, By End-User, 2023 – 2033 ($ Million) 10.3.7. FRANCE 10.3.7.1. France: Market Size and Forecast, By Component, 2023 – 2033 ($ Million) 10.3.7.2. France: Market Size and Forecast, By Deployment Type, 2023 – 2033 ($ Million) 10.3.7.3. France: Market Size and Forecast, By End-User, 2023 – 2033 ($ Million) 10.3.8. ITALY 10.3.8.1. Italy: Market Size and Forecast, By Component, 2023 – 2033 ($ Million) 10.3.8.2. Italy: Market Size and Forecast, By Deployment Type, 2023 – 2033 ($ Million) 10.3.8.3. Italy: Market Size and Forecast, By End-User, 2023 – 2033 ($ Million) 10.3.9. SPAIN 10.3.9.1. Spain: Market Size and Forecast, By Component, 2023 – 2033 ($ Million) 10.3.9.2. Spain: Market Size and Forecast, By Deployment Type, 2023 – 2033 ($ Million) 10.3.9.3. Spain: Market Size and Forecast, By End-User, 2023 – 2033 ($ Million) 10.3.10. BENELUX 10.3.10.1. BeNeLux: Market Size and Forecast, By Component, 2023 – 2033 ($ Million) 10.3.10.2. BeNeLux: Market Size and Forecast, By Deployment Type, 2023 – 2033 ($ Million) 10.3.10.3. BeNeLux: Market Size and Forecast, By End-User, 2023 – 2033 ($ Million) 10.3.11. RUSSIA 10.3.11.1. Russia: Market Size and Forecast, By Component, 2023 – 2033 ($ Million) 10.3.11.2. Russia: Market Size and Forecast, By Deployment Type, 2023 – 2033 ($ Million) 10.3.11.3. Russia: Market Size and Forecast, By End-User, 2023 – 2033 ($ Million) 10.3.12. REST OF EUROPE 10.3.12.1. Rest of Europe: Market Size and Forecast, By Component, 2023 – 2033 ($ Million) 10.3.12.2. Rest of Europe: Market Size and Forecast, By Deployment Type, 2023 – 2033 ($ Million) 10.3.12.3. Rest of Europe: Market Size and Forecast, By End-User, 2023 – 2033 ($ Million) 10.4. Asia Pacific 10.4.1. Asia Pacific: Market Size and Forecast, By Country, 2023 – 2033 ($ Million) 10.4.2. Asia Pacific: Market Size and Forecast, By Component, 2023 – 2033 ($ Million) 10.4.3. Asia Pacific: Market Size and Forecast, By Deployment Type, 2023 – 2033 ($ Million) 10.4.4. Asia Pacific: Market Size and Forecast, By End-User, 2023 – 2033 ($ Million) 10.4.5. CHINA 10.4.5.1. China: Market Size and Forecast, By Component, 2023 – 2033 ($ Million) 10.4.5.2. China: Market Size and Forecast, By Deployment Type, 2023 – 2033 ($ Million) 10.4.5.3. China: Market Size and Forecast, By End-User, 2023 – 2033 ($ Million) 10.4.6. JAPAN 10.4.6.1. Japan: Market Size and Forecast, By Component, 2023 – 2033 ($ Million) 10.4.6.2. Japan: Market Size and Forecast, By Deployment Type, 2023 – 2033 ($ Million) 10.4.6.3. Japan: Market Size and Forecast, By End-User, 2023 – 2033 ($ Million) 10.4.7. INDIA 10.4.7.1. India: Market Size and Forecast, By Component, 2023 – 2033 ($ Million) 10.4.7.2. India: Market Size and Forecast, By Deployment Type, 2023 – 2033 ($ Million) 10.4.7.3. India: Market Size and Forecast, By End-User, 2023 – 2033 ($ Million) 10.4.8. SOUTH KOREA 10.4.8.1. South Korea: Market Size and Forecast, By Component, 2023 – 2033 ($ Million) 10.4.8.2. South Korea: Market Size and Forecast, By Deployment Type, 2023 – 2033 ($ Million) 10.4.8.3. South Korea: Market Size and Forecast, By End-User, 2023 – 2033 ($ Million) 10.4.9. THAILAND 10.4.9.1. Thailand: Market Size and Forecast, By Component, 2023 – 2033 ($ Million) 10.4.9.2. Thailand: Market Size and Forecast, By Deployment Type, 2023 – 2033 ($ Million) 10.4.9.3. Thailand: Market Size and Forecast, By End-User, 2023 – 2033 ($ Million) 10.4.10. INDONESIA 10.4.10.1. Indonesia: Market Size and Forecast, By Component, 2023 – 2033 ($ Million) 10.4.10.2. Indonesia: Market Size and Forecast, By Deployment Type, 2023 – 2033 ($ Million) 10.4.10.3. Indonesia: Market Size and Forecast, By End-User, 2023 – 2033 ($ Million) 10.4.11. MALAYSIA 10.4.11.1. Malaysia: Market Size and Forecast, By Component, 2023 – 2033 ($ Million) 10.4.11.2. Malaysia: Market Size and Forecast, By Deployment Type, 2023 – 2033 ($ Million) 10.4.11.3. Malaysia: Market Size and Forecast, By End-User, 2023 – 2033 ($ Million) 10.4.12. AUSTRALIA 10.4.12.1. Australia: Market Size and Forecast, By Component, 2023 – 2033 ($ Million) 10.4.12.2. Australia: Market Size and Forecast, By Deployment Type, 2023 – 2033 ($ Million) 10.4.12.3. Australia: Market Size and Forecast, By End-User, 2023 – 2033 ($ Million) 10.4.13. REST FO ASIA PACIFIC 10.4.13.1. Rest fo Asia Pacific: Market Size and Forecast, By Component, 2023 – 2033 ($ Million) 10.4.13.2. Rest fo Asia Pacific: Market Size and Forecast, By Deployment Type, 2023 – 2033 ($ Million) 10.4.13.3. Rest fo Asia Pacific: Market Size and Forecast, By End-User, 2023 – 2033 ($ Million) 10.5. South America 10.5.1. South America: Market Size and Forecast, By Country, 2023 – 2033 ($ Million) 10.5.2. South America: Market Size and Forecast, By Component, 2023 – 2033 ($ Million) 10.5.3. South America: Market Size and Forecast, By Deployment Type, 2023 – 2033 ($ Million) 10.5.4. South America: Market Size and Forecast, By End-User, 2023 – 2033 ($ Million) 10.5.5. BRAZIL 10.5.5.1. Brazil: Market Size and Forecast, By Component, 2023 – 2033 ($ Million) 10.5.5.2. Brazil: Market Size and Forecast, By Deployment Type, 2023 – 2033 ($ Million) 10.5.5.3. Brazil: Market Size and Forecast, By End-User, 2023 – 2033 ($ Million) 10.5.6. ARGENTINA 10.5.6.1. Argentina: Market Size and Forecast, By Component, 2023 – 2033 ($ Million) 10.5.6.2. Argentina: Market Size and Forecast, By Deployment Type, 2023 – 2033 ($ Million) 10.5.6.3. Argentina: Market Size and Forecast, By End-User, 2023 – 2033 ($ Million) 10.5.7. REST OF SOUTH AMERICA 10.5.7.1. Rest of South America: Market Size and Forecast, By Component, 2023 – 2033 ($ Million) 10.5.7.2. Rest of South America: Market Size and Forecast, By Deployment Type, 2023 – 2033 ($ Million) 10.5.7.3. Rest of South America: Market Size and Forecast, By End-User, 2023 – 2033 ($ Million) 10.6. Middle East & Africa 10.6.1. Middle East & Africa: Market Size and Forecast, By Country, 2023 – 2033 ($ Million) 10.6.2. Middle East & Africa: Market Size and Forecast, By Component, 2023 – 2033 ($ Million) 10.6.3. Middle East & Africa: Market Size and Forecast, By Deployment Type, 2023 – 2033 ($ Million) 10.6.4. Middle East & Africa: Market Size and Forecast, By End-User, 2023 – 2033 ($ Million) 10.6.5. SAUDI ARABIA 10.6.5.1. Saudi Arabia: Market Size and Forecast, By Component, 2023 – 2033 ($ Million) 10.6.5.2. Saudi Arabia: Market Size and Forecast, By Deployment Type, 2023 – 2033 ($ Million) 10.6.5.3. Saudi Arabia: Market Size and Forecast, By End-User, 2023 – 2033 ($ Million) 10.6.6. UAE 10.6.6.1. UAE: Market Size and Forecast, By Component, 2023 – 2033 ($ Million) 10.6.6.2. UAE: Market Size and Forecast, By Deployment Type, 2023 – 2033 ($ Million) 10.6.6.3. UAE: Market Size and Forecast, By End-User, 2023 – 2033 ($ Million) 10.6.7. EGYPT 10.6.7.1. Egypt: Market Size and Forecast, By Component, 2023 – 2033 ($ Million) 10.6.7.2. Egypt: Market Size and Forecast, By Deployment Type, 2023 – 2033 ($ Million) 10.6.7.3. Egypt: Market Size and Forecast, By End-User, 2023 – 2033 ($ Million) 10.6.8. SOUTH AFRICA 10.6.8.1. South Africa: Market Size and Forecast, By Component, 2023 – 2033 ($ Million) 10.6.8.2. South Africa: Market Size and Forecast, By Deployment Type, 2023 – 2033 ($ Million) 10.6.8.3. South Africa: Market Size and Forecast, By End-User, 2023 – 2033 ($ Million) 10.6.9. REST OF MIDDLE EAST & AFRICA 10.6.9.1. Rest of Middle East & Africa: Market Size and Forecast, By Component, 2023 – 2033 ($ Million) 10.6.9.2. Rest of Middle East & Africa: Market Size and Forecast, By Deployment Type, 2023 – 2033 ($ Million) 10.6.9.3. Rest of Middle East & Africa: Market Size and Forecast, By End-User, 2023 – 2033 ($ Million) CHAPTER 12. Competitive Landscape 12.1. Competitior Benchmarking 2023 12.2. Market Share Analysis 12.3. Key Developments Analysis By Top 5 Companies 12.4. Market Share Acquisition Strategies: Analysis of Key Approaches Employed by Top Players CHAPTER 13. Company Profiles 13.1. Akamai Technologies Inc 13.1.1. Business Overview 13.1.2. Financial Analysis 13.1.2.1. Business Segment Revenue, 2020, 2021, 2022, $ Million 13.1.2.2. Geographic Revenue Mix, 2022 (% Share) 13.1.3. Product Portfolio 13.1.4. Recent Development and Strategies Adopted 13.1.5. SWOT Analysis 13.2. Micro Focus International 13.3. IBM Corpration 13.4. SolarWinds Worldwide 13.5. Netmagic Solutions (NTT Limited) 13.6. F5 Inc 13.7. Radware Ltd 13.8. Dynatrace 13.9. Cloudflare, Inc 13.10. Neustar Inc
Connect to Analyst
Research Methodology

Our Most Viewed Report and gain instant expertise

Enterprise Artificial Intelligence Market Analysis and Global Forecast 2023-2033

Event Management Software Market Analysis and Global Forecast 2023-2033
Global Predictive Maintenance Market Analysis and Global Forecast 2023-2033
Natural Language Processing Market Analysis and Global Forecast 2023-2033
Virtualized Evolved Packet Core (vEPC) Market Analysis and Global Forecast 2023-2033
Virtualized Evolved Packet Core (vEPC) Market Research Report: Information By Solution (MME, HSS, S-GW, PDN-GW), By Services (Professional Service, Consulting, Integration and Deployment, Training and Support, Managed Services), By Network (5G Network, 4G Network), By End User (Telecom operators, Enterprises, Others), and by Region — Forecast till 2033
Page: 161 
