Zero Sugar Drinks Market Analysis and Global Forecast 2023-2033
$ 1,390.00 – $ 5,520.00Price range: $ 1,390.00 through $ 5,520.00
Zero Sugar Drinks Market Research Report: By Type (Soft Drinks, Energy Drinks, Sports Drink, Carbonated Water), By Flavor (Cola, Lime, Orange, Lemonade, Others), By Distribution Channel (Hypermarkets/Supermarkets, Convenience Stores, Independent Retailers, Others), and by Region — Forecast till 2033
Page: 218
Zero Sugar Drinks Market Overview
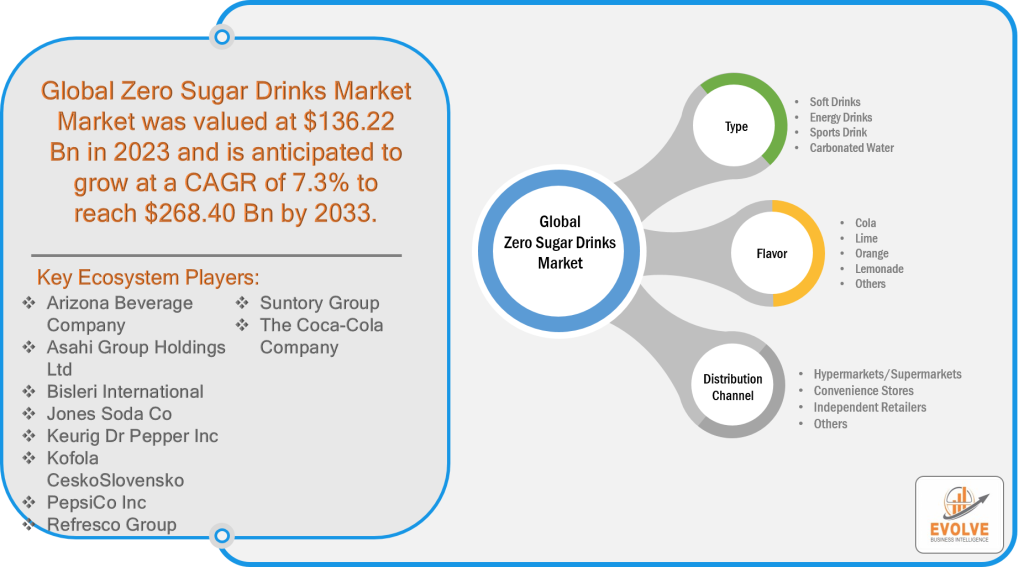
Zero Sugar Drinks Market Size is expected to reach USD 268.40 Billion by 2033. The Zero Sugar Drinks industry size accounted for USD 136.22 Billion in 2023 and is expected to expand at a compound annual growth rate (CAGR) of 7.3% from 2023 to 2033. Zero-sugar drinks, also known as sugar-free or no-sugar beverages, refer to a category of non-alcoholic beverages that are formulated without the addition of any refined sugar or sugar-based sweeteners. These drinks are designed to provide a low or negligible amount of sugar content while offering a palatable taste experience. Instead of traditional sweeteners, zero-sugar drinks often utilize alternative sweetening agents such as non-caloric artificial sweeteners or naturally derived sugar substitutes to provide a desired level of sweetness. These beverages cater to health-conscious consumers seeking lower sugar intake, weight management, or those with specific dietary preferences or restrictions. Zero-sugar drinks offer an option for individuals looking to reduce their overall sugar consumption without compromising on taste, providing a healthier alternative to traditional sugar-sweetened beverages.
Global Zero Sugar Drinks Market Synopsis
COVID-19 Impact Analysis
The COVID-19 pandemic has significantly influenced the Zero Sugar Drinks market, bringing about notable shifts in consumer behavior and industry dynamics. With the implementation of lockdown measures, social distancing guidelines, and the closure of restaurants, bars, and other hospitality establishments, the demand for Zero Sugar Drinks experienced both challenges and opportunities. On the one hand, the closure of on-trade channels resulted in a decline in sales of Zero Sugar Drinks typically consumed in these venues. The absence of dine-in experiences and social gatherings limited the occasions for consumers to enjoy these beverages. On the other hand, the pandemic also prompted a surge in at-home consumption, as individuals sought out healthier beverage options while practicing self-isolation. This shift in consumption patterns led to increased sales of Zero Sugar Drinks through off-trade channels such as supermarkets, online platforms, and home delivery services. Additionally, the growing health consciousness among consumers during the pandemic further boosted the demand for Zero Sugar Drinks as individuals sought ways to maintain a balanced diet and support their well-being. As the pandemic situation evolves and restrictions ease, the Zero Sugar Drinks market is expected to continue adapting to changing consumer preferences and behaviors, with a focus on convenience, health, and taste.
Global Zero Sugar Drinks Market Dynamics
The major factors that have impacted the growth of Zero Sugar Drinks are as follows:
Drivers:
- Health-conscious Consumer Trends
The driver behind the growing demand for zero-sugar drinks stems from the increasing awareness among consumers about the negative health impacts of consuming excessive sugar. With a focus on overall well-being and healthier lifestyles, individuals are actively seeking beverage options that align with their wellness goals. Zero-sugar drinks provide a guilt-free alternative to traditional sugar-sweetened beverages, appealing to health-conscious consumers who are looking to reduce their sugar intake and make more informed choices about their diet. This trend is driven by a desire to maintain a balanced and nutritious lifestyle, leading to a significant surge in the demand for zero-sugar drinks.
Restraint:
- Taste and Perception Challenges
Despite the increasing demand for zero-sugar drinks, they face certain challenges related to taste and consumer perception. The absence of sugar can impact the overall flavor profile of these beverages, as artificial sweeteners or alternative natural sweeteners may not completely replicate the taste of sugar. Consumers, who have grown accustomed to the sweetness of traditional sugar-sweetened drinks, may notice a difference in flavor when consuming zero-sugar alternatives. This taste disparity can affect consumer acceptance and purchasing decisions, as individuals may have preconceived notions about the flavor quality of zero-sugar drinks. Overcoming these taste and perception challenges is crucial for zero-sugar drink brands to maintain consumer satisfaction and successfully compete in the market.
Opportunity:
- Growing Demand for Functional Beverages
The zero-sugar drinks market presents an excellent opportunity to capitalize on the increasing demand for functional beverages. Consumers are not only seeking drinks that are low in or free from sugar but are also interested in additional health benefits and functionality. By incorporating ingredients such as vitamins, antioxidants, natural flavors, or other functional additives, zero-sugar drinks can offer a broader range of health-enhancing properties. This growing demand for functional beverages aligns with consumers’ desire to address specific health concerns or optimize their overall well-being. The ability to provide both health benefits and great taste in zero-sugar drinks positions brands in a favorable position to tap into this expanding market segment. By offering innovative formulations and appealing to health-conscious consumers, companies can capture a significant market share and establish themselves as leaders in the zero-sugar drinks market.
Zero Sugar Drinks Market Segment Overview
By Type
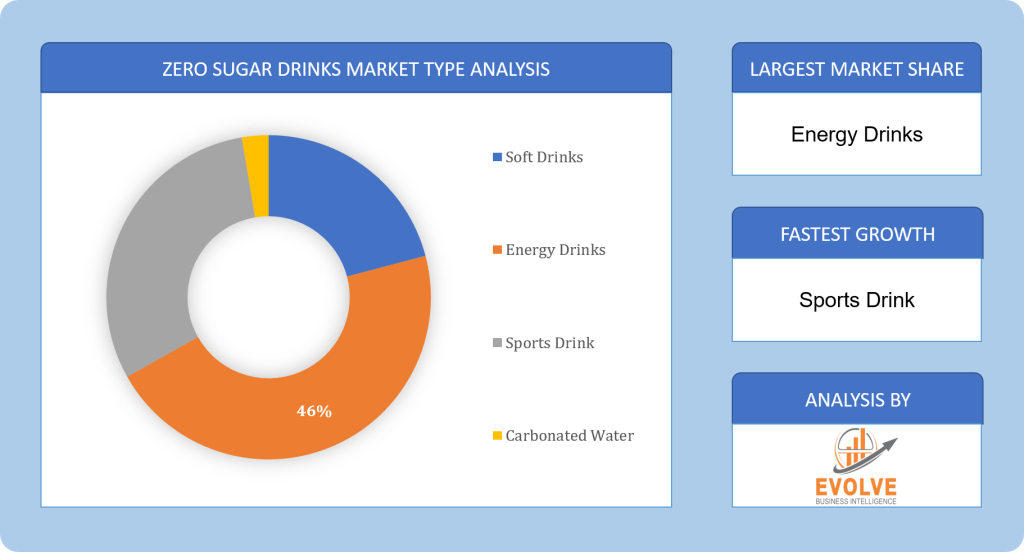
Based on the Type, the market is segmented based on Soft Drinks, Energy Drinks, Sports Drink, and Carbonated Water. The Energy Drinks segment was projected to hold the largest market share in the Zero Sugar Drinks market. This dominance can be attributed to several factors. First and foremost, energy drinks have gained immense popularity among consumers seeking a boost in energy levels and improved performance. With the growing health consciousness and increasing concerns over sugar intake, the demand for zero-sugar variants of energy drinks has skyrocketed. These beverages offer the desired energy boost without the guilt of consuming excessive sugar.
By Flavor
Based on the Flavor, the market has been divided into Cola, Lime, Orange, Lemonade, and Others. The Lemonade segment is expected to hold the largest market share in the Market. Lemonade has long been a popular and refreshing beverage choice, known for its tangy and citrusy flavors. In recent years, there has been a significant shift towards healthier and natural alternatives in the beverage industry. Lemonade, particularly when made with natural ingredients and without added sugars, fits this growing consumer preference. The demand for natural and organic beverages has been on the rise, driven by increasing awareness about health and wellness.
By Distribution Channel
Based on Distribution Channel, the market has been divided into Hypermarkets/Supermarkets, Convenience Stores, Independent Retailers, and Others. The Hypermarkets/Supermarkets segment is projected to experience significant growth in the Zero Sugar Drinks market. Hypermarkets and supermarkets are key retail channels with extensive reach and wide product offerings, making them convenient destinations for consumers seeking zero-sugar beverages. These stores provide a one-stop shopping experience, enabling consumers to explore and choose from a diverse range of zero-sugar drink options. Additionally, hypermarkets and supermarkets often offer competitive pricing, promotional activities, and attractive discounts, making it more enticing for consumers to purchase zero-sugar drinks in bulk.
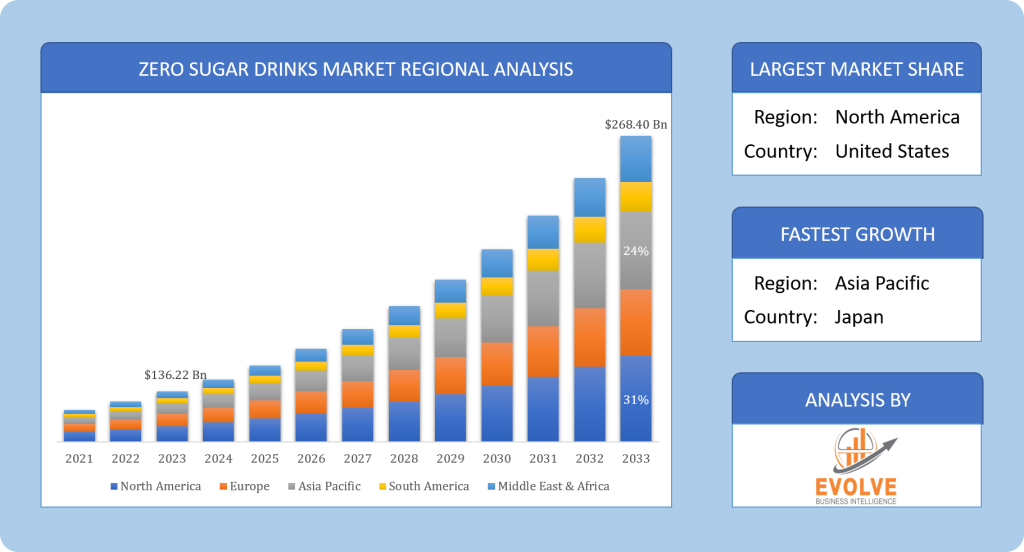
Based on region, the market has been divided into North America, Europe, Asia-Pacific, the Middle East & Africa, and Latin America. The area of North America is anticipated to dominate the market for the usage of Zero Sugar Drinks, followed by those in Asia-Pacific and Europe.
North America Market
North America has consistently held the largest market share in the Zero Sugar Drinks market, showcasing its dominance in the industry. Several factors contribute to North America’s market leadership. Firstly, the region has a well-established culture of health and wellness, with a significant portion of the population prioritizing healthier lifestyle choices. As a result, there is a strong demand for Zero Sugar Drinks as consumers actively seek alternatives to sugar-sweetened beverages. Secondly, North America has witnessed the emergence of innovative beverage startups and established industry players that have effectively capitalized on this market trend, offering a diverse range of zero-sugar options to cater to varying consumer preferences. The region’s advanced distribution networks and retail infrastructure further support the accessibility and availability of Zero Sugar Drinks across various channels, including supermarkets, convenience stores, and online platforms. Additionally, North America’s robust consumer market and higher disposable incomes enable consumers to afford premium and niche zero-sugar beverage offerings, contributing to the region’s market dominance. Overall, North America’s focus on health consciousness, robust industry presence, and favorable market conditions have solidified its position as the leader in the Zero Sugar Drinks market.
Asia Pacific Market
The Asia-Pacific region has been experiencing a substantial growth rate in the Zero Sugar Drinks industry, indicating its emerging importance in the market. Several factors contribute to this growth. Firstly, there has been a notable shift in consumer preferences towards healthier beverage options across the region. Rising health consciousness and increasing awareness of the negative impacts of excessive sugar consumption have fueled the demand for Zero Sugar Drinks. Additionally, the region’s large and growing population, particularly in countries such as China and India, presents a vast consumer base with changing lifestyles and an inclination towards healthier choices. Moreover, rapid urbanization, expanding middle-class population, and increasing disposable incomes have led to a rise in purchasing power, enabling consumers to afford premium Zero Sugar Drinks. The evolving retail landscape, including the growth of e-commerce platforms and convenience stores, has further facilitated the accessibility and availability of Zero Sugar Drinks to consumers in the Asia-Pacific region. With these favorable market conditions and shifting consumer preferences, the Asia-Pacific region is witnessing significant growth in the Zero Sugar Drinks industry and is expected to continue expanding in the foreseeable future.
Competitive Landscape
The competitive landscape includes key players (tier 1, tier 2, and local) having a presence across the globe. Companies such as Bisleri International, Jones Soda Co, Keurig Dr. Pepper Inc, Kofola CeskoSlovensko, and PepsiCo Inc are some of the leading players in the global Zero Sugar Drinks Industry. These players have adopted partnership, acquisition, expansion, and new product development, among others as their key strategies.
Key Market Players:
- Arizona Beverage Company
- Asahi Group Holdings Ltd
- Bisleri International
- Jones Soda Co
- Keurig Dr. Pepper Inc
- Kofola CeskoSlovensko
- PepsiCo Inc
- Refresco Group
- Suntory Group
- The Coca-Cola Company
Key development:
In January 2023, Pepsi is thrilled to introduce an enhanced version of Pepsi Zero Sugar, demonstrating that Zero has never been so delicious. Through extensive taste testing and consumer trials, the brand is showcasing to customers that zero can indeed taste amazing. The upgraded recipe of Pepsi Zero Sugar utilizes an innovative sweetener system, resulting in a more invigorating and bolder flavor profile compared to the previous variant of Pepsi Zero Sugar. Whether it’s the viral sensation of offerings like Pilk & Cookies or the pioneering cola innovation of Nitro Pepsi, Pepsi continues to push boundaries and deliver exciting choices to its consumers.
Scope of the Report
Global Zero Sugar Drinks Market, by Type
- Soft Drinks
- Energy Drinks
- Sports Drink
- Carbonated Water
Global Zero Sugar Drinks Market, by Flavor
- Cola
- Lime
- Orange
- Lemonade
- Others
Global Zero Sugar Drinks Market, by Distribution Channel
- Hypermarkets/Supermarkets
- Convenience Stores
- Independent Retailers
- Others
Global Zero Sugar Drinks Market, by Region
- North America
- US
- Canada
- Mexico
- Europe
- UK
- Germany
- France
- Italy
- Spain
- Benelux
- Nordic
- Rest of Europe
- Asia Pacific
- China
- Japan
- South Korea
- Indonesia
- Australia
- Malaysia
- India
- Rest of Asia Pacific
- South America
- Brazil
- Argentina
- Rest of South America
- Middle East & Africa
- Saudi Arabia
- UAE
- Egypt
- South Africa
- Rest of Middle East & Africa
| Parameters | Values |
|---|---|
| Market Size | 2033: USD 268.4 Billion |
| Compounded Average Growth Rate (CAGR) 2023 to 2033 | 7.3% |
| Base Year | 2022 |
| Forecast Period | 2023 to 2033 |
| Historical Data | 2021 (2017 to 2020 On Demand) |
| Report Coverage | Revenue Forecast, Competitive Landscape, Growth Factors, and Trends |
| Key Segmentations | Type, Flavor, Distribution Channel |
| Key Market Opportunities | Growing Demand for Functional Beverages |
| Key Market Drivers | Health-conscious Consumer Trends |
| Geographies Covered | North America, Europe, Asia-Pacific, South America, Middle East, Africa |
| Key Vendors | Arizona Beverage Company, Asahi Group Holdings Ltd, Bisleri International, Jones Soda Co, Keurig Dr. Pepper Inc, Kofola CeskoSlovensko, PepsiCo Inc, Refresco Group, Suntory Group, The Coca-Cola Company |
Report Content Brief:
- High-level analysis of the current and future Zero Sugar Drinks Industry trends and opportunities
- Detailed analysis of current market drivers, restraining factors, and opportunities analysis in the future
- Historical market size for the year 2021, and forecast from 2023 to 2033
- Zero Sugar Drinks market share analysis for each segment
- Competitor analysis with a comprehensive insight into its product segment, financial strength, and strategies adopted.
- Identifies key strategies adopted by the key players including new product development, mergers and acquisitions, joint ventures, collaborations, and partnerships.
- To identify and understand the various factors involved in the global Zero Sugar Drinks market affected by the pandemic
- To provide year-on-year growth from 2022 to 2033
- To provide short-term, long-term, and overall CAGR comparison from 2022 to 2033.
- Provide Total Addressable Market (TAM) for the Global Zero Sugar Drinks Market.
Press Release

Global Pharmaceutical Manufacturing Market to Reach $1.38 Trillion by 2035 with 7.35% CAGR, New Research Shows

The Global Mammography Market Is Estimated To Record a CAGR of Around 10.29% During The Forecast Period

Glue Stick Market to Reach USD 2.35 Billion by 2034

Podiatry Service Market to Reach USD 11.88 Billion by 2034

Microfluidics Technology Market to Reach USD 32.58 Billion by 2034

Ferric Chloride Market to Reach USD 10.65 Billion by 2034

Family Practice EMR Software Market to Reach USD 21.52 Billion by 2034

Electric Hairbrush Market to Reach USD 15.95 Billion by 2034

Daily Bamboo Products Market to Reach USD 143.52 Billion by 2034

Cross-border E-commerce Logistics Market to Reach USD 112.65 Billion by 2034
Frequently Asked Questions (FAQ)
What is the study period of this market?
The study period of the global Zero Sugar Drinks market is 2022- 2033
What are the 10 Years CAGR (2023 to 2033) of the global Zero Sugar Drinks market?
The global Zero Sugar Drinks market is growing at a CAGR of ~7.3% over the next 10 years
Which region has the highest growth rate in the market of Zero Sugar Drinks?
Asia Pacific is expected to register the highest CAGR during 2023-2033
Which region accounted for the largest share of the market of Zero Sugar Drinks?
North America holds the largest share in 2022
Major Key Players in the Market of Zero Sugar Drinks Manufacturers?
Arizona Beverage Company, Asahi Group Holdings Ltd, Bisleri International, Jones Soda Co, Keurig Dr. Pepper Inc, Kofola CeskoSlovensko, PepsiCo Inc, Refresco Group, Suntory Group, The Coca-Cola Company are the major companies operating in the Zero Sugar Drinks Industry.
Do you offer Post Sale Support?
Yes, we offer 16 hours of analyst support to solve the queries
Do you deliver sections of a report?
Yes, we do provide regional as well as country-level reports. Other than this we also provide a sectional report. Please get in contact with our sales representatives.
Table of Content
CHAPTER 1. Executive Summary CHAPTER 2. Scope of the Study 2.1. Market Definition 2.2. Market Scope & Segmentation 2.2.1. Objective of Report CHAPTER 3. Evolve BI Methodology 3.1. Data Collection & Validation Approach 3.2. Market Size Estimation and Forecast CHAPTER 4. Exclusive Analysis 4.1. Market Opportunity Score 4.1.1. Type Segement – Market Opportunity Score 4.1.2. Flavor Segment – Market Opportunity Score 4.1.3. Distribution Channel Segment – Market Opportunity Score 4.2. Key Market Influencing Indicators CHAPTER 5. Market Insights and Trends 5.1. Value Chain Analysis 5.1.1. Raw Material 5.1.2. Manufacturing Process 5.1.3. Distribution Channel 5.1.4. End User 5.2. Porter’s Five Forces Analysis 5.2.1. Bargaining Power of Buyers 5.2.2. Bargaining Power of Suppliers 5.2.3. Threat of New Entrant 5.2.4. Threat of Substitute 5.2.5. Industry Rivalry 5.3. COVID-19 Impact and Post COVID Scenario on Zero Sugar Drinks Market 5.3.1. Impact of COVID-19 5.3.2. Government Support and Industry Revival Policies 5.3.3. Measures Taken by Companies to Mitigate Negative Impact 5.3.4. Post COVID Trend CHAPTER 6. MArket Dynamics 6.1. Introduction 6.2. Drivers 6.2.1. Driver 1 6.2.2. Driver 2 6.2.3. Driver 3 6.3. Restraints 6.3.1. Restraint 1 6.3.2. Restraint 2 6.4. Opportunity 6.4.1. Opportunity 1 CHAPTER 7. Global Zero Sugar Drinks Market, By Type 7.1. Introduction 7.1.1. Soft Drinks 7.1.2. Energy Drinks 7.1.3. Sports Drink 7.1.4. Carbonated Water CHAPTER 8. Global Zero Sugar Drinks Market, By Flavor 8.1. Introduction 8.1.1. Cola 8.1.2. Lime 8.1.3. Orange 8.1.4. Lemonade 8.1.5. Others CHAPTER 9. Global Zero Sugar Drinks Market, By Distribution Channel 9.1. Introduction 9.1.1. Hypermarkets/Supermarkets 9.1.2. Convenience Stores 9.1.3. Independent Retailers 9.1.4. Others CHAPTER 10. Global Zero Sugar Drinks Market, By Region 10.1. Introduction 10.2. NORTH AMERICA 10.2.1. North America: Market Size and Forecast, By Country, 2023 – 2033 ($ Million) 10.2.2. North America: Market Size and Forecast, By Type, 2023 – 2033 ($ Million) 10.2.3. North America: Market Size and Forecast, By Flavor, 2023 – 2033 ($ Million) 10.2.4. North America: Market Size and Forecast, By Distribution Channel, 2023 – 2033 ($ Million) 10.2.5. US 10.2.5.1. US: Market Size and Forecast, By Type, 2023 – 2033 ($ Million) 10.2.5.2. US: Market Size and Forecast, By Flavor, 2023 – 2033 ($ Million) 10.2.5.3. US: Market Size and Forecast, By Distribution Channel, 2023 – 2033 ($ Million) 10.2.6. CANADA 10.2.6.1. Canada: Market Size and Forecast, By Type, 2023 – 2033 ($ Million) 10.2.6.2. Canada: Market Size and Forecast, By Flavor, 2023 – 2033 ($ Million) 10.2.6.3. Canada: Market Size and Forecast, By Distribution Channel, 2023 – 2033 ($ Million) 10.2.7. MEXICO 10.2.7.1. Mexico: Market Size and Forecast, By Type, 2023 – 2033 ($ Million) 10.2.7.2. Mexico: Market Size and Forecast, By Flavor, 2023 – 2033 ($ Million) 10.2.7.3. Mexico: Market Size and Forecast, By Distribution Channel, 2023 – 2033 ($ Million) 10.3. Europe 10.3.1. Europe: Market Size and Forecast, By Country, 2023 – 2033 ($ Million) 10.3.2. Europe: Market Size and Forecast, By Type, 2023 – 2033 ($ Million) 10.3.3. Europe: Market Size and Forecast, By Flavor, 2023 – 2033 ($ Million) 10.3.4. Europe: Market Size and Forecast, By Distribution Channel, 2023 – 2033 ($ Million) 10.3.5. U.K. 10.3.5.1. U.K.: Market Size and Forecast, By Type, 2023 – 2033 ($ Million) 10.3.5.2. U.K.: Market Size and Forecast, By Flavor, 2023 – 2033 ($ Million) 10.3.5.3. U.K.: Market Size and Forecast, By Distribution Channel, 2023 – 2033 ($ Million) 10.3.6. GERMANY 10.3.6.1. Germany: Market Size and Forecast, By Type, 2023 – 2033 ($ Million) 10.3.6.2. Germany: Market Size and Forecast, By Flavor, 2023 – 2033 ($ Million) 10.3.6.3. Germany: Market Size and Forecast, By Distribution Channel, 2023 – 2033 ($ Million) 10.3.7. FRANCE 10.3.7.1. France: Market Size and Forecast, By Type, 2023 – 2033 ($ Million) 10.3.7.2. France: Market Size and Forecast, By Flavor, 2023 – 2033 ($ Million) 10.3.7.3. France: Market Size and Forecast, By Distribution Channel, 2023 – 2033 ($ Million) 10.3.8. ITALY 10.3.8.1. Italy: Market Size and Forecast, By Type, 2023 – 2033 ($ Million) 10.3.8.2. Italy: Market Size and Forecast, By Flavor, 2023 – 2033 ($ Million) 10.3.8.3. Italy: Market Size and Forecast, By Distribution Channel, 2023 – 2033 ($ Million) 10.3.9. SPAIN 10.3.9.1. Spain: Market Size and Forecast, By Type, 2023 – 2033 ($ Million) 10.3.9.2. Spain: Market Size and Forecast, By Flavor, 2023 – 2033 ($ Million) 10.3.9.3. Spain: Market Size and Forecast, By Distribution Channel, 2023 – 2033 ($ Million) 10.3.10. BENELUX 10.3.10.1. BeNeLux: Market Size and Forecast, By Type, 2023 – 2033 ($ Million) 10.3.10.2. BeNeLux: Market Size and Forecast, By Flavor, 2023 – 2033 ($ Million) 10.3.10.3. BeNeLux: Market Size and Forecast, By Distribution Channel, 2023 – 2033 ($ Million) 10.3.11. RUSSIA 10.3.11.1. Russia: Market Size and Forecast, By Type, 2023 – 2033 ($ Million) 10.3.11.2. Russia: Market Size and Forecast, By Flavor, 2023 – 2033 ($ Million) 10.3.11.3. Russia: Market Size and Forecast, By Distribution Channel, 2023 – 2033 ($ Million) 10.3.12. REST OF EUROPE 10.3.12.1. Rest of Europe: Market Size and Forecast, By Type, 2023 – 2033 ($ Million) 10.3.12.2. Rest of Europe: Market Size and Forecast, By Flavor, 2023 – 2033 ($ Million) 10.3.12.3. Rest of Europe: Market Size and Forecast, By Distribution Channel, 2023 – 2033 ($ Million) 10.4. Asia Pacific 10.4.1. Asia Pacific: Market Size and Forecast, By Country, 2023 – 2033 ($ Million) 10.4.2. Asia Pacific: Market Size and Forecast, By Type, 2023 – 2033 ($ Million) 10.4.3. Asia Pacific: Market Size and Forecast, By Flavor, 2023 – 2033 ($ Million) 10.4.4. Asia Pacific: Market Size and Forecast, By Distribution Channel, 2023 – 2033 ($ Million) 10.4.5. CHINA 10.4.5.1. China: Market Size and Forecast, By Type, 2023 – 2033 ($ Million) 10.4.5.2. China: Market Size and Forecast, By Flavor, 2023 – 2033 ($ Million) 10.4.5.3. China: Market Size and Forecast, By Distribution Channel, 2023 – 2033 ($ Million) 10.4.6. JAPAN 10.4.6.1. Japan: Market Size and Forecast, By Type, 2023 – 2033 ($ Million) 10.4.6.2. Japan: Market Size and Forecast, By Flavor, 2023 – 2033 ($ Million) 10.4.6.3. Japan: Market Size and Forecast, By Distribution Channel, 2023 – 2033 ($ Million) 10.4.7. INDIA 10.4.7.1. India: Market Size and Forecast, By Type, 2023 – 2033 ($ Million) 10.4.7.2. India: Market Size and Forecast, By Flavor, 2023 – 2033 ($ Million) 10.4.7.3. India: Market Size and Forecast, By Distribution Channel, 2023 – 2033 ($ Million) 10.4.8. SOUTH KOREA 10.4.8.1. South Korea: Market Size and Forecast, By Type, 2023 – 2033 ($ Million) 10.4.8.2. South Korea: Market Size and Forecast, By Flavor, 2023 – 2033 ($ Million) 10.4.8.3. South Korea: Market Size and Forecast, By Distribution Channel, 2023 – 2033 ($ Million) 10.4.9. THAILAND 10.4.9.1. Thailand: Market Size and Forecast, By Type, 2023 – 2033 ($ Million) 10.4.9.2. Thailand: Market Size and Forecast, By Flavor, 2023 – 2033 ($ Million) 10.4.9.3. Thailand: Market Size and Forecast, By Distribution Channel, 2023 – 2033 ($ Million) 10.4.10. INDONESIA 10.4.10.1. Indonesia: Market Size and Forecast, By Type, 2023 – 2033 ($ Million) 10.4.10.2. Indonesia: Market Size and Forecast, By Flavor, 2023 – 2033 ($ Million) 10.4.10.3. Indonesia: Market Size and Forecast, By Distribution Channel, 2023 – 2033 ($ Million) 10.4.11. MALAYSIA 10.4.11.1. Malaysia: Market Size and Forecast, By Type, 2023 – 2033 ($ Million) 10.4.11.2. Malaysia: Market Size and Forecast, By Flavor, 2023 – 2033 ($ Million) 10.4.11.3. Malaysia: Market Size and Forecast, By Distribution Channel, 2023 – 2033 ($ Million) 10.4.12. AUSTRALIA 10.4.12.1. Australia: Market Size and Forecast, By Type, 2023 – 2033 ($ Million) 10.4.12.2. Australia: Market Size and Forecast, By Flavor, 2023 – 2033 ($ Million) 10.4.12.3. Australia: Market Size and Forecast, By Distribution Channel, 2023 – 2033 ($ Million) 10.4.13. REST FO ASIA PACIFIC 10.4.13.1. Rest fo Asia Pacific: Market Size and Forecast, By Type, 2023 – 2033 ($ Million) 10.4.13.2. Rest fo Asia Pacific: Market Size and Forecast, By Flavor, 2023 – 2033 ($ Million) 10.4.13.3. Rest fo Asia Pacific: Market Size and Forecast, By Distribution Channel, 2023 – 2033 ($ Million) 10.5. South America 10.5.1. South America: Market Size and Forecast, By Country, 2023 – 2033 ($ Million) 10.5.2. South America: Market Size and Forecast, By Type, 2023 – 2033 ($ Million) 10.5.3. South America: Market Size and Forecast, By Flavor, 2023 – 2033 ($ Million) 10.5.4. South America: Market Size and Forecast, By Distribution Channel, 2023 – 2033 ($ Million) 10.5.5. BRAZIL 10.5.5.1. Brazil: Market Size and Forecast, By Type, 2023 – 2033 ($ Million) 10.5.5.2. Brazil: Market Size and Forecast, By Flavor, 2023 – 2033 ($ Million) 10.5.5.3. Brazil: Market Size and Forecast, By Distribution Channel, 2023 – 2033 ($ Million) 10.5.6. ARGENTINA 10.5.6.1. Argentina: Market Size and Forecast, By Type, 2023 – 2033 ($ Million) 10.5.6.2. Argentina: Market Size and Forecast, By Flavor, 2023 – 2033 ($ Million) 10.5.6.3. Argentina: Market Size and Forecast, By Distribution Channel, 2023 – 2033 ($ Million) 10.5.7. REST OF SOUTH AMERICA 10.5.7.1. Rest of South America: Market Size and Forecast, By Type, 2023 – 2033 ($ Million) 10.5.7.2. Rest of South America: Market Size and Forecast, By Flavor, 2023 – 2033 ($ Million) 10.5.7.3. Rest of South America: Market Size and Forecast, By Distribution Channel, 2023 – 2033 ($ Million) 10.6. Middle East & Africa 10.6.1. Middle East & Africa: Market Size and Forecast, By Country, 2023 – 2033 ($ Million) 10.6.2. Middle East & Africa: Market Size and Forecast, By Type, 2023 – 2033 ($ Million) 10.6.3. Middle East & Africa: Market Size and Forecast, By Flavor, 2023 – 2033 ($ Million) 10.6.4. Middle East & Africa: Market Size and Forecast, By Distribution Channel, 2023 – 2033 ($ Million) 10.6.5. SAUDI ARABIA 10.6.5.1. Saudi Arabia: Market Size and Forecast, By Type, 2023 – 2033 ($ Million) 10.6.5.2. Saudi Arabia: Market Size and Forecast, By Flavor, 2023 – 2033 ($ Million) 10.6.5.3. Saudi Arabia: Market Size and Forecast, By Distribution Channel, 2023 – 2033 ($ Million) 10.6.6. UAE 10.6.6.1. UAE: Market Size and Forecast, By Type, 2023 – 2033 ($ Million) 10.6.6.2. UAE: Market Size and Forecast, By Flavor, 2023 – 2033 ($ Million) 10.6.6.3. UAE: Market Size and Forecast, By Distribution Channel, 2023 – 2033 ($ Million) 10.6.7. EGYPT 10.6.7.1. Egypt: Market Size and Forecast, By Type, 2023 – 2033 ($ Million) 10.6.7.2. Egypt: Market Size and Forecast, By Flavor, 2023 – 2033 ($ Million) 10.6.7.3. Egypt: Market Size and Forecast, By Distribution Channel, 2023 – 2033 ($ Million) 10.6.8. SOUTH AFRICA 10.6.8.1. South Africa: Market Size and Forecast, By Type, 2023 – 2033 ($ Million) 10.6.8.2. South Africa: Market Size and Forecast, By Flavor, 2023 – 2033 ($ Million) 10.6.8.3. South Africa: Market Size and Forecast, By Distribution Channel, 2023 – 2033 ($ Million) 10.6.9. REST OF MIDDLE EAST & AFRICA 10.6.9.1. Rest of Middle East & Africa: Market Size and Forecast, By Type, 2023 – 2033 ($ Million) 10.6.9.2. Rest of Middle East & Africa: Market Size and Forecast, By Flavor, 2023 – 2033 ($ Million) 10.6.9.3. Rest of Middle East & Africa: Market Size and Forecast, By Distribution Channel, 2023 – 2033 ($ Million) CHAPTER 12. Competitive Landscape 12.1. Competitior Benchmarking 2023 12.2. Market Share Analysis 12.3. Key Developments Analysis By Top 5 Companies 12.4. Market Share Acquisition Strategies: Analysis of Key Approaches Employed by Top Players CHAPTER 13. Company Profiles 13.1. Arizona Beverage Company 13.1.1. Business Overview 13.1.2. Financial Analysis 13.1.2.1. Business Segment Revenue, 2020, 2021, 2022, $ Million 13.1.2.2. Geographic Revenue Mix, 2022 (% Share) 13.1.3. Product Portfolio 13.1.4. Recent Development and Strategies Adopted 13.1.5. SWOT Analysis 13.2. Asahi Group Holdings Ltd 13.3. Bisleri International 13.4. Jones Soda Co 13.5. Keurig Dr Pepper Inc 13.6. Kofola CeskoSlovensko 13.7. PepsiCo Inc 13.8. Refresco Group 13.9. Suntory Group 13.10. The Coca-Cola Company
Connect to Analyst
Research Methodology


