Virtual Prototype Market Analysis and Global Forecast 2024-2034
Price range: $ 1,390.00 through $ 5,520.00
Virtual Prototype Market Research Report: Information By Deployment Mode (Cloud-Based, On-Premises), By Technology (Finite Element Analysis, Computational Fluid Dynamics, Multibody Dynamics, System Modeling), By Application (Automotive, Aerospace, Consumer Electronics, Medical Devices), By End Use (Design Verification, Cost Reduction, Performance Optimization) and by Region — Forecast till 2034
Page: 129
Virtual Prototype Market Overview
The Virtual Prototype Market size accounted for USD 0.53 Billion in 2023 and is estimated to account for 4.65 Billion in 2024. The Market is expected to reach USD 16.85 Billion by 2034 growing at a compound annual growth rate (CAGR) of 14.88% from 2024 to 2034. The Virtual Prototype Market is experiencing significant growth due to increasing adoption across industries such as automotive, aerospace, healthcare, and consumer electronics. Virtual prototyping enables engineers and designers to simulate, test, and optimize products in a digital environment before physical production, reducing costs and development time.
The virtual prototyping market is driven by the need for faster, more efficient, and cost-effective product development, and it is poised for continued growth as technology advances. Virtual prototypes accelerate product development cycles and minimize production errors, leading to significant cost savings.
Global Virtual Prototype Market Synopsis
 Virtual Prototype Market Dynamics

The major factors that have impacted the growth of Virtual Prototype Market are as follows:
Drivers:
Ø Cost & Time Efficiency in Product Development
Virtual prototypes reduce the need for physical testing, saving both time and materials. Helps companies identify design flaws early, reducing recalls and redesign costs and businesses can iterate designs quickly using computer-aided design (CAD), finite element analysis (FEA), and computational fluid dynamics (CFD). The integration of AI, IoT, and machine learning with virtual prototypes enhances real-time data analysis and digital twins replicate physical systems in a virtual environment for predictive maintenance and real-time monitoring.
Restraint
- Complex Software & Steep Learning Curve
Virtual prototyping requires expertise in CAD, CAE (Computer-Aided Engineering), and CFD (Computational Fluid Dynamics). Lack of user-friendly interfaces and intuitive tools slows down adoption and industries require specialized training for engineers and designers to effectively use simulation software. Cloud-based virtual prototyping solutions increase cybersecurity vulnerabilities and risk of intellectual property (IP) theft when sharing designs on third-party cloud platforms.
Opportunity:
⮚ Rising Demand for Virtual Prototyping in Electric Vehicles (EVs)
Virtual prototypes reduce time-to-market for EV manufacturers. Used in battery performance testing, lightweight material design, and aerodynamic analysis. Cloud computing reduces hardware costs, making virtual prototyping more accessible for SMEs. Enables remote collaboration and real-time simulation across multiple teams. Virtual prototypes help companies design smartphones, wearables, and home automation devices and Used for thermal analysis, electromagnetic compatibility testing, and material durability simulations.
Virtual Prototype Market Segment Overview
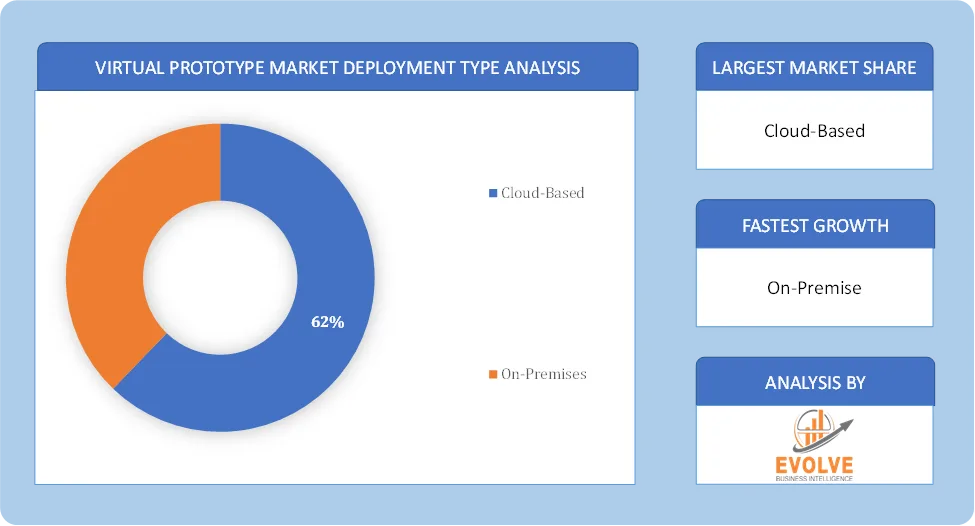 By Deployment Mode
Based on Deployment Mode, the market is segmented based on Cloud-Based, On-Premises. Cloud deployment segment dominant the market, driven by its scalability and flexibility. Cloud solutions allow businesses to adjust computational resources in real-time, accommodating fluctuating project demands, particularly for complex simulations and large datasets. By eliminating the need for heavy capital investment in on-premises infrastructure, cloud-based solutions are especially attractive to businesses with budget constraints.
By Technology
Based on Deployment Type, the market segment has been divided into Finite Element Analysis, Computational Fluid Dynamics, Multibody Dynamics, System Modeling. The Finite Element Analysis segment dominant the market. FEA plays a crucial role in structural analysis, allowing engineers to predict how products will perform under different conditions
By Application
Based on Application, the market segment has been divided into Automotive, Aerospace, Consumer Electronics, Medical Devices. The automotive segment dominates the market. The automotive industry’s need for cost-effective product development solutions makes virtual prototyping invaluable, as it reduces the time and cost associated with physical prototypes. As technologies like electrification, autonomous driving, and connectivity advance, the complexity of automotive designs increases, driving demand for virtual prototyping to evaluate the performance and interactions of these systems.
By End Use
Based on End Use, the market segment has been divided into Design Verification, Cost Reduction, Performance Optimization. The Cost Reduction segment dominant the market. Cost Reduction is a major focus for organizations, as virtual prototyping allows for rapid iterations and decreases the need for expensive physical prototypes, thereby enhancing profitability.
Global Virtual Prototype Market Regional Analysis
Based on region, the global Virtual Prototype Market has been divided into North America, Europe, Asia-Pacific, the Middle East & Africa, and Latin America. North America is projected to dominate the use of the Virtual Prototype Market followed by the Asia-Pacific and Europe regions.
North America Virtual Prototype Market

North America holds a dominant position in the Virtual Prototype Market. North America holds a significant share of the virtual prototype market. This is largely attributed to the presence of well-established automotive and aerospace industries, which heavily rely on advanced simulation and modeling technologies and Investments in AI-driven simulations and cloud-based virtual prototyping.
Asia-Pacific Virtual Prototype Market
The Asia-Pacific region has indeed emerged as the fastest-growing market for the Virtual Prototype Market industry. This is driven by the increasing industrialization and manufacturing activities in countries like China, Japan, and India and the growing automotive and electronics industries in the region are major contributors to market expansion. Increased R&D investments in autonomous vehicles and 5G-enabled devices and government-backed support for AI, IoT, and digital twin technologies.
Competitive Landscape
The global Virtual Prototype Market is highly competitive, with numerous players offering a wide range of software solutions. The competitive landscape is characterized by the presence of established companies, as well as emerging startups and niche players. To increase their market position and attract a wide consumer base, the businesses are employing various strategies, such as product launches, and strategic alliances.
Prominent Players:
- MSC Software
- Bentley Systems
- Oracle
- Synopsys
- IBM
- COMSOL
- Dassault Systemes
- MathWorks
- Siemens
Key Development
- In September 2024, Zuken launched the 2025 version of its Harness Builder for E3.series, featuring advanced tools to streamline wiring harness design and manufacturing. The update enhances virtual prototyping, enabling efficient simulation, validation, and optimization, reducing development time and errors while addressing growing demand in the virtual prototype market.
Scope of the Report
Global Virtual Prototype Market, by Deployment Mode
- Cloud-Based
- On-Premises
Global Virtual Prototype Market, by Technology
- Finite Element Analysis
- Computational Fluid Dynamics
- Multibody Dynamics
- System Modeling
Global Virtual Prototype Market, by Application
- Automotive
- Aerospace
- Consumer Electronics
- Medical Devices
Global Virtual Prototype Market, by End Use
- Design Verification
- Cost Reduction
- Performance Optimization
Global Virtual Prototype Market, by Region
- North America
- US
- Canada
- Mexico
- Europe
- UK
- Germany
- France
- Italy
- Spain
- Benelux
- Nordic
- Rest of Europe
- Asia Pacific
- China
- Japan
- South Korea
- Indonesia
- Austalia
- Malaysia
- India
- Rest of Asia Pacific
- South America
- Brazil
- Argentina
- Rest of South America
- Middle East & Africa
- Saudi Arabia
- UAE
- Egypt
- South Africa
- Rest of Middle East & Africa
| Parameters | Indicators |
|---|---|
| Market Size | 2034: USD 16.85 Billion |
| CAGR (2024-2034) | 14.88% |
| Base year | 2022 |
| Forecast Period | 2024-2034 |
| Historical Data | 2021 (2017 to 2020 On Demand) |
| Report Coverage | Revenue Forecast, Competitive Landscape, Growth Factors, and Trends |
| Key Segmentations | Product Type, Application, Insulation Material and Conductor |
| Geographies Covered | North America, Europe, Asia-Pacific, South America, Middle East, Africa |
| Key Vendors | MSC Software, Bentley Systems, Oracle, Synopsys, IBM, COMSOL, Dassault Systemes, MathWorks, Siemens and PTC. |
| Key Market Opportunities | · Rising Demand for Virtual Prototyping in Electric Vehicles (EVs) · Cloud-Based Virtual Prototyping for Cost-Effective Deployment |
| Key Market Drivers | · Cost & Time Efficiency in Product Development · Advancements in Simulation & Digital Twin Technology |
REPORT CONTENT BRIEF:
- High-level analysis of the current and future Virtual Prototype Market trends and opportunities
- Detailed analysis of current market drivers, restraining factors, and opportunities in the future
- Virtual Prototype Market historical market size for the year 2021, and forecast from 2023 to 2033
- Virtual Prototype Market share analysis at each product level
- Competitor analysis with detailed insight into its product segment, Government & Defense strength, and strategies adopted.
- Identifies key strategies adopted including product launches and developments, mergers and acquisitions, joint ventures, collaborations, and partnerships as well as funding taken and investment done, among others.
- To identify and understand the various factors involved in the global Virtual Prototype Market affected by the pandemic
- To provide a detailed insight into the major companies operating in the market. The profiling will include the Government & Defense health of the company’s past 2-3 years with segmental and regional revenue breakup, product offering, recent developments, SWOT analysis, and key strategies.
Frequently Asked Questions (FAQ)
What is the growth rate of the global Virtual Prototype Market?
The global Virtual Prototype Market is growing at a CAGR of 14.88% over the next 10 years
Which region has the highest growth rate in the market of Virtual Prototype Market?
Asia Pacific is expected to register the highest CAGR during 2024-2034
Which region has the largest share of the global Virtual Prototype Market?
North America holds the largest share in 2022
Who are the key players in the global Virtual Prototype Market?
MSC Software, Bentley Systems, Oracle, Synopsys, IBM, COMSOL, Dassault Systemes, MathWorks, Siemens and PTC. are the major companies operating in the market.
Do you offer Post Sale Support?
Yes, we offer 16 hours of analyst support to solve the queries
Do you sell particular sections of a report?
Yes, we provide regional as well as country-level reports. Other than this we also provide a sectional report. Please get in contact with our sales representatives.
Press Release

Global Pharmaceutical Manufacturing Market to Reach $1.38 Trillion by 2035 with 7.35% CAGR, New Research Shows
The Global Mammography Market Is Estimated To Record a CAGR of Around 10.29% During The Forecast Period
Glue Stick Market to Reach USD 2.35 Billion by 2034
Podiatry Service Market to Reach USD 11.88 Billion by 2034
Microfluidics Technology Market to Reach USD 32.58 Billion by 2034
Ferric Chloride Market to Reach USD 10.65 Billion by 2034
Family Practice EMR Software Market to Reach USD 21.52 Billion by 2034
Electric Hairbrush Market to Reach USD 15.95 Billion by 2034
Daily Bamboo Products Market to Reach USD 143.52 Billion by 2034
Cross-border E-commerce Logistics Market to Reach USD 112.65 Billion by 2034
Table of Contents
CHAPTER 1. Executive Summary
CHAPTER 2. Scope of the Study
2.1. Market Definition
2.2. Market Scope & Segmentation
2.2.1. Objective of Report
CHAPTER 3. Evolve BI Methodology
3.1. Data Collection & Validation Approach
3.2. Market Size Estimation and Forecast
CHAPTER 4. Exclusive Analysis
4.1. Market Opportunity Score
4.1.1. Deployment Mode Segement – Market Opportunity Score
4.1.2. Technology Segment – Market Opportunity Score
4.1.3. Application Segment – Market Opportunity Score
4.1.4. End Use Segment – Market Opportunity Score
4.2. Key Market Influencing Indicators
CHAPTER 5. Market Insights and Trends
5.1. Value Chain Analysis
5.1.1. Raw Material
5.1.2. Manufacturing Process
5.1.3. Distribution Channel
5.1.4. End User
5.2. Porter’s Five Forces Analysis
5.2.1. Bargaining Power of Buyers
5.2.2. Bargaining Power of Suppliers
5.2.3. Threat of New Entrant
5.2.4. Threat of Substitute
5.2.5. Industry Rivalry
5.3. COVID-19 Impact and Post COVID Scenario on Virtual Prototype Market
5.3.1. Impact of COVID-19
5.3.2. Government Support and Industry Revival Policies
5.3.3. Measures Taken by Companies to Mitigate Negative Impact
5.3.4. Post COVID Trend
CHAPTER 6. MArket Dynamics
6.1. Introduction
6.2. Drivers
6.2.1. Driver 1
6.2.2. Driver 2
6.2.3. Driver 3
6.3. Restraints
6.3.1. Restraint 1
6.3.2. Restraint 2
6.4. Opportunity
6.4.1. Opportunity 1
CHAPTER 7. Virtual Prototype Market, By Deployment Type
7.1. Introduction
7.1.1. Cloud-Based
7.1.2. On-Premises
CHAPTER 8. Virtual Prototype Market, By Technology
8.1. Introduction
8.1.1. Finite Element Analysis
8.1.2. Computational Fluid Dynamics
8.1.3. Multibody Dynamics
8.1.4. System Modeling
CHAPTER 9. Virtual Prototype Market, By Application
9.1. Introduction
9.1.1. Automotive
9.1.2. Aerospace
9.1.3. Consumer Electronics
9.1.4. Medical Devices
CHAPTER 10. Virtual Prototype Market, By End Use
10.1.Introduction
10.1.1. Design Verification
10.1.2. Cost Reduction
10.1.3. Performance Optimization
CHAPTER 11. Virtual Prototype Market, By Region
11.1. Introduction
11.2. NORTH AMERICA
11.2.1. North America: Market Size and Forecast, By Country, 2021 – 2034 ($ Million)
11.2.2. North America: Market Size and Forecast, By Deployment Mode, 2021 – 2034 ($ Million)
11.2.3. North America: Market Size and Forecast, By Technology, 2021 – 2034 ($ Million)
11.2.4. North America: Market Size and Forecast, By Application, 2021 – 2034 ($ Million)
11.2.5. North America: Market Size and Forecast, By End User, 2021 – 2034 ($ Million)
11.2.6. US
11.2.6.1. US: Market Size and Forecast, By Deployment Mode, 2021 – 2034 ($ Million)
11.2.6.2. US: Market Size and Forecast, By Technology, 2021 – 2034 ($ Million)
11.2.6.3. US: Market Size and Forecast, By Application, 2021 – 2034 ($ Million)
11.2.6.4. US: Market Size and Forecast, By End User, 2021 – 2034 ($ Million)
11.2.7. CANADA
11.2.7.1. Canada: Market Size and Forecast, By Deployment Mode, 2021 – 2034 ($ Million)
11.2.7.2. Canada: Market Size and Forecast, By Technology, 2021 – 2034 ($ Million)
11.2.7.3. Canada: Market Size and Forecast, By Application, 2021 – 2034 ($ Million)
11.2.7.4. Canada: Market Size and Forecast, By End User, 2021 – 2034 ($ Million)
11.2.8. MEXICO
11.2.8.1. Mexico: Market Size and Forecast, By Deployment Mode, 2021 – 2034 ($ Million)
11.2.8.2. Mexico: Market Size and Forecast, By Technology, 2021 – 2034 ($ Million)
11.2.8.3. Mexico: Market Size and Forecast, By Application, 2021 – 2034 ($ Million)
11.2.8.4. Mexico: Market Size and Forecast, By End User, 2021 – 2034 ($ Million)
11.3. Europe
11.3.1. Europe: Market Size and Forecast, By Country, 2021 – 2034 ($ Million)
11.3.2. Europe: Market Size and Forecast, By Deployment Mode, 2021 – 2034 ($ Million)
11.3.3. Europe: Market Size and Forecast, By Technology, 2021 – 2034 ($ Million)
11.3.4. Europe: Market Size and Forecast, By Application, 2021 – 2034 ($ Million)
11.3.5. Europe: Market Size and Forecast, By End User, 2021 – 2034 ($ Million)
11.3.6. U.K.
11.3.6.1. U.K.: Market Size and Forecast, By Deployment Mode, 2021 – 2034 ($ Million)
11.3.6.2. U.K.: Market Size and Forecast, By Technology, 2021 – 2034 ($ Million)
11.3.6.3. U.K.: Market Size and Forecast, By Application, 2021 – 2034 ($ Million)
11.3.6.4. U.K.: Market Size and Forecast, By End User, 2021 – 2034 ($ Million)
11.3.7. GERMANY
11.3.7.1. Germany: Market Size and Forecast, By Deployment Mode, 2021 – 2034 ($ Million)
11.3.7.2. Germany: Market Size and Forecast, By Technology, 2021 – 2034 ($ Million)
11.3.7.3. Germany: Market Size and Forecast, By Application, 2021 – 2034 ($ Million)
11.3.7.4. Germany: Market Size and Forecast, By End User, 2021 – 2034 ($ Million)
11.3.8. FRANCE
11.3.8.1. France: Market Size and Forecast, By Deployment Mode, 2021 – 2034 ($ Million)
11.3.8.2. France: Market Size and Forecast, By Technology, 2021 – 2034 ($ Million)
11.3.8.3. France: Market Size and Forecast, By Application, 2021 – 2034 ($ Million)
11.3.8.4. France: Market Size and Forecast, By End User, 2021 – 2034 ($ Million)
11.3.9. ITALY
11.3.9.1. Italy: Market Size and Forecast, By Deployment Mode, 2021 – 2034 ($ Million)
11.3.9.2. Italy: Market Size and Forecast, By Technology, 2021 – 2034 ($ Million)
11.3.9.3. Italy: Market Size and Forecast, By Application, 2021 – 2034 ($ Million)
11.3.9.4. Italy: Market Size and Forecast, By End User, 2021 – 2034 ($ Million)
11.3.10. SPAIN
11.3.10.1. Spain: Market Size and Forecast, By Deployment Mode, 2021 – 2034 ($ Million)
11.3.10.2. Spain: Market Size and Forecast, By Technology, 2021 – 2034 ($ Million)
11.3.10.3. Spain: Market Size and Forecast, By Application, 2021 – 2034 ($ Million)
11.3.10.4. Spain: Market Size and Forecast, By End User, 2021 – 2034 ($ Million)
11.3.11. BENELUX
11.3.11.1. BeNeLux: Market Size and Forecast, By Deployment Mode, 2021 – 2034 ($ Million)
11.3.11.2. BeNeLux: Market Size and Forecast, By Technology, 2021 – 2034 ($ Million)
11.3.11.3. BeNeLux: Market Size and Forecast, By Application, 2021 – 2034 ($ Million)
11.3.11.4. BeNeLux: Market Size and Forecast, By End User, 2021 – 2034 ($ Million)
11.3.12. RUSSIA
11.3.12.1. Russia: Market Size and Forecast, By Deployment Mode, 2021 – 2034 ($ Million)
11.3.12.2. Russia: Market Size and Forecast, By Technology, 2021 – 2034 ($ Million)
11.3.12.3. Russia: Market Size and Forecast, By Application, 2021 – 2034 ($ Million)
11.3.12.4. Russia: Market Size and Forecast, By End User, 2021 – 2034 ($ Million)
11.3.13. REST OF EUROPE
11.3.13.1. Rest of Europe: Market Size and Forecast, By Deployment Mode, 2021 – 2034 ($ Million)
11.3.13.2. Rest of Europe: Market Size and Forecast, By Technology, 2021 – 2034 ($ Million)
11.3.13.3. Rest of Europe: Market Size and Forecast, By Application, 2021 – 2034 ($ Million)
11.3.13.4. Rest of Europe: Market Size and Forecast, By End User, 2021 – 2034 ($ Million)
11.4. Asia Pacific
11.4.1. Asia Pacific: Market Size and Forecast, By Country, 2021 – 2034 ($ Million)
11.4.2. Asia Pacific: Market Size and Forecast, By Deployment Mode, 2021 – 2034 ($ Million)
11.4.3. Asia Pacific: Market Size and Forecast, By Technology, 2021 – 2034 ($ Million)
11.4.4. Asia Pacific: Market Size and Forecast, By Application, 2021 – 2034 ($ Million)
11.4.5. Asia Pacific: Market Size and Forecast, By End User, 2021 – 2034 ($ Million)
11.4.6. CHINA
11.4.6.1. China: Market Size and Forecast, By Deployment Mode, 2021 – 2034 ($ Million)
11.4.6.2. China: Market Size and Forecast, By Technology, 2021 – 2034 ($ Million)
11.4.6.3. China: Market Size and Forecast, By Application, 2021 – 2034 ($ Million)
11.4.6.4. China: Market Size and Forecast, By End User, 2021 – 2034 ($ Million)
11.4.7. JAPAN
11.4.7.1. Japan: Market Size and Forecast, By Deployment Mode, 2021 – 2034 ($ Million)
11.4.7.2. Japan: Market Size and Forecast, By Technology, 2021 – 2034 ($ Million)
11.4.7.3. Japan: Market Size and Forecast, By Application, 2021 – 2034 ($ Million)
11.4.7.4. Japan: Market Size and Forecast, By End User, 2021 – 2034 ($ Million)
11.4.8. INDIA
11.4.8.1. India: Market Size and Forecast, By Deployment Mode, 2021 – 2034 ($ Million)
11.4.8.2. India: Market Size and Forecast, By Technology, 2021 – 2034 ($ Million)
11.4.8.3. India: Market Size and Forecast, By Application, 2021 – 2034 ($ Million)
11.4.8.4. India: Market Size and Forecast, By End User, 2021 – 2034 ($ Million)
11.4.9. SOUTH KOREA
11.4.9.1. South Korea: Market Size and Forecast, By Deployment Mode, 2021 – 2034 ($ Million)
11.4.9.2. South Korea: Market Size and Forecast, By Technology, 2021 – 2034 ($ Million)
11.4.9.3. South Korea: Market Size and Forecast, By Application, 2021 – 2034 ($ Million)
11.4.9.4. South Korea: Market Size and Forecast, By End User, 2021 – 2034 ($ Million)
11.4.10. THAILAND
11.4.10.1. Thailand: Market Size and Forecast, By Deployment Mode, 2021 – 2034 ($ Million)
11.4.10.2. Thailand: Market Size and Forecast, By Technology, 2021 – 2034 ($ Million)
11.4.10.3. Thailand: Market Size and Forecast, By Application, 2021 – 2034 ($ Million)
11.4.10.4. Thailand: Market Size and Forecast, By End User, 2021 – 2034 ($ Million)
11.4.11. INDONESIA
11.4.11.1. Indonesia: Market Size and Forecast, By Deployment Mode, 2021 – 2034 ($ Million)
11.4.11.2. Indonesia: Market Size and Forecast, By Technology, 2021 – 2034 ($ Million)
11.4.11.3. Indonesia: Market Size and Forecast, By Application, 2021 – 2034 ($ Million)
11.4.11.4. Indonesia: Market Size and Forecast, By End User, 2021 – 2034 ($ Million)
11.4.12. MALAYSIA
11.4.12.1. Malaysia: Market Size and Forecast, By Deployment Mode, 2021 – 2034 ($ Million)
11.4.12.2. Malaysia: Market Size and Forecast, By Technology, 2021 – 2034 ($ Million)
11.4.12.3. Malaysia: Market Size and Forecast, By Application, 2021 – 2034 ($ Million)
11.4.12.4. Malaysia: Market Size and Forecast, By End User, 2021 – 2034 ($ Million)
11.4.13. AUSTRALIA
11.4.13.1. Australia: Market Size and Forecast, By Deployment Mode, 2021 – 2034 ($ Million)
11.4.13.2. Australia: Market Size and Forecast, By Technology, 2021 – 2034 ($ Million)
11.4.13.3. Australia: Market Size and Forecast, By Application, 2021 – 2034 ($ Million)
11.4.13.4. Australia: Market Size and Forecast, By End User, 2021 – 2034 ($ Million)
11.4.14. REST FO ASIA PACIFIC
11.4.14.1. Rest fo Asia Pacific: Market Size and Forecast, By Deployment Mode, 2021 – 2034 ($ Million)
11.4.14.2. Rest fo Asia Pacific: Market Size and Forecast, By Technology, 2021 – 2034 ($ Million)
11.4.14.3. Rest fo Asia Pacific: Market Size and Forecast, By Application, 2021 – 2034 ($ Million)
11.4.14.4. Rest fo Asia Pacific: Market Size and Forecast, By End User, 2021 – 2034 ($ Million)
11.5. South America
11.5.1. South America: Market Size and Forecast, By Country, 2021 – 2034 ($ Million)
11.5.2. South America: Market Size and Forecast, By Deployment Mode, 2021 – 2034 ($ Million)
11.5.3. South America: Market Size and Forecast, By Technology, 2021 – 2034 ($ Million)
11.5.4. South America: Market Size and Forecast, By Application, 2021 – 2034 ($ Million)
11.5.5. South America: Market Size and Forecast, By End User, 2021 – 2034 ($ Million)
11.5.6. BRAZIL
11.5.6.1. Brazil: Market Size and Forecast, By Deployment Mode, 2021 – 2034 ($ Million)
11.5.6.2. Brazil: Market Size and Forecast, By Technology, 2021 – 2034 ($ Million)
11.5.6.3. Brazil: Market Size and Forecast, By Application, 2021 – 2034 ($ Million)
11.5.6.4. Brazil: Market Size and Forecast, By End User, 2021 – 2034 ($ Million)
11.5.7. ARGENTINA
11.5.7.1. Argentina: Market Size and Forecast, By Deployment Mode, 2021 – 2034 ($ Million)
11.5.7.2. Argentina: Market Size and Forecast, By Technology, 2021 – 2034 ($ Million)
11.5.7.3. Argentina: Market Size and Forecast, By Application, 2021 – 2034 ($ Million)
11.5.7.4. Argentina: Market Size and Forecast, By End User, 2021 – 2034 ($ Million)
11.5.8. REST OF SOUTH AMERICA
11.5.8.1. Rest of South America: Market Size and Forecast, By Deployment Mode, 2021 – 2034 ($ Million)
11.5.8.2. Rest of South America: Market Size and Forecast, By Technology, 2021 – 2034 ($ Million)
11.5.8.3. Rest of South America: Market Size and Forecast, By Application, 2021 – 2034 ($ Million)
11.5.8.4. Rest of South America: Market Size and Forecast, By End User, 2021 – 2034 ($ Million)
11.6. Middle East & Africa
11.6.1. Middle East & Africa: Market Size and Forecast, By Country, 2021 – 2034 ($ Million)
11.6.2. Middle East & Africa: Market Size and Forecast, By Deployment Mode, 2021 – 2034 ($ Million)
11.6.3. Middle East & Africa: Market Size and Forecast, By Technology, 2021 – 2034 ($ Million)
11.6.4. Middle East & Africa: Market Size and Forecast, By Application, 2021 – 2034 ($ Million)
11.6.5. Middle East & Africa: Market Size and Forecast, By End User, 2021 – 2034 ($ Million)
11.6.6. SAUDI ARABIA
11.6.6.1. Saudi Arabia: Market Size and Forecast, By Deployment Mode, 2021 – 2034 ($ Million)
11.6.6.2. Saudi Arabia: Market Size and Forecast, By Technology, 2021 – 2034 ($ Million)
11.6.6.3. Saudi Arabia: Market Size and Forecast, By Application, 2021 – 2034 ($ Million)
11.6.6.4. Saudi Arabia: Market Size and Forecast, By End User, 2021 – 2034 ($ Million)
11.6.7. UAE
11.6.7.1. UAE: Market Size and Forecast, By Deployment Mode, 2021 – 2034 ($ Million)
11.6.7.2. UAE: Market Size and Forecast, By Technology, 2021 – 2034 ($ Million)
11.6.7.3. UAE: Market Size and Forecast, By Application, 2021 – 2034 ($ Million)
11.6.7.4. UAE: Market Size and Forecast, By End User, 2021 – 2034 ($ Million)
11.6.8. EGYPT
11.6.8.1. Egypt: Market Size and Forecast, By Deployment Mode, 2021 – 2034 ($ Million)
11.6.8.2. Egypt: Market Size and Forecast, By Technology, 2021 – 2034 ($ Million)
11.6.8.3. Egypt: Market Size and Forecast, By Application, 2021 – 2034 ($ Million)
11.6.8.4. Egypt: Market Size and Forecast, By End User, 2021 – 2034 ($ Million)
11.6.9. SOUTH AFRICA
11.6.9.1. South Africa: Market Size and Forecast, By Deployment Mode, 2021 – 2034 ($ Million)
11.6.9.2. South Africa: Market Size and Forecast, By Technology, 2021 – 2034 ($ Million)
11.6.9.3. South Africa: Market Size and Forecast, By Application, 2021 – 2034 ($ Million)
11.6.9.4. South Africa: Market Size and Forecast, By End User, 2021 – 2034 ($ Million)
11.6.10. REST OF MIDDLE EAST & AFRICA
11.6.10.1. Rest of Middle East & Africa: Market Size and Forecast, By Deployment Mode, 2021 – 2034 ($ Million)
11.6.10.2. Rest of Middle East & Africa: Market Size and Forecast, By Technology, 2021 – 2034 ($ Million)
11.6.10.3. Rest of Middle East & Africa: Market Size and Forecast, By Application, 2021 – 2034 ($ Million)
11.6.10.4. Rest of Middle East & Africa: Market Size and Forecast, By End User, 2021 – 2034 ($ Million)
CHAPTER 12. Competitive Landscape
12.1. Competitior Benchmarking 2023
12.2. Market Share Analysis
12.3. Key Developments Analysis By Top 5 Companies
12.4. Market Share Acquisition Strategies: Analysis of Key Approaches Employed by Top Players
CHAPTER 13. Company Profiles
13.1. MSC Software
13.1.1. Business Overview
13.1.2. Financial Analysis
13.1.2.1. Business Segment Revenue, 2018, 2019, 2020, $ Million
13.1.2.2. Geographic Revenue Mix, 2020 (% Share)
13.1.3. Product Portfolio
13.1.4. Recent Development and Strategies Adopted
13.1.5. SWOT Analysis
13.2. Bentley Systems
13.3. Oracle
13.4. Synopsys
13.5. IBM
13.6. COMSOL
13.7. Dassault Systemes
13.8. MathWorks
13.9. Siemens
13.10. PTC.
Connect To Analyst
Research Methodology

Our Most Viewed Report and gain instant expertise

Advanced Driver Assistance Systems (ADAS) Market Analysis and Global Forecast 2023-2033
Automotive Acoustic Materials Market Analysis and Global Forecast 2023-2033
Automotive Glazing Market Analysis and Global Forecast 2023-2033
Global Electric Vehicle Market Analysis and Global Forecast 2023-2033