CHAPTER 1. Executive Summary
CHAPTER 2. Scope of the Study
2.1. Market Definition
2.2. Market Scope & Segmentation
2.2.1. Objective of Report
CHAPTER 3. Evolve BI Methodology
3.1. Data Collection & Validation Approach
3.2. Market Size Estimation and Forecast
CHAPTER 4. Exclusive Analysis
4.1. Market Opportunity Score
4.1.1. Deployment Mode Segement – Market Opportunity Score
4.1.2. Technology Segment – Market Opportunity Score
4.1.3. Application Segment – Market Opportunity Score
4.1.4. End Use Segment – Market Opportunity Score
4.2. Key Market Influencing Indicators
CHAPTER 5. Market Insights and Trends
5.1. Value Chain Analysis
5.1.1. Raw Material
5.1.2. Manufacturing Process
5.1.3. Distribution Channel
5.1.4. End User
5.2. Porter’s Five Forces Analysis
5.2.1. Bargaining Power of Buyers
5.2.2. Bargaining Power of Suppliers
5.2.3. Threat of New Entrant
5.2.4. Threat of Substitute
5.2.5. Industry Rivalry
5.3. COVID-19 Impact and Post COVID Scenario on Virtual Prototype Market
5.3.1. Impact of COVID-19
5.3.2. Government Support and Industry Revival Policies
5.3.3. Measures Taken by Companies to Mitigate Negative Impact
5.3.4. Post COVID Trend
CHAPTER 6. MArket Dynamics
6.1. Introduction
6.2. Drivers
6.2.1. Driver 1
6.2.2. Driver 2
6.2.3. Driver 3
6.3. Restraints
6.3.1. Restraint 1
6.3.2. Restraint 2
6.4. Opportunity
6.4.1. Opportunity 1
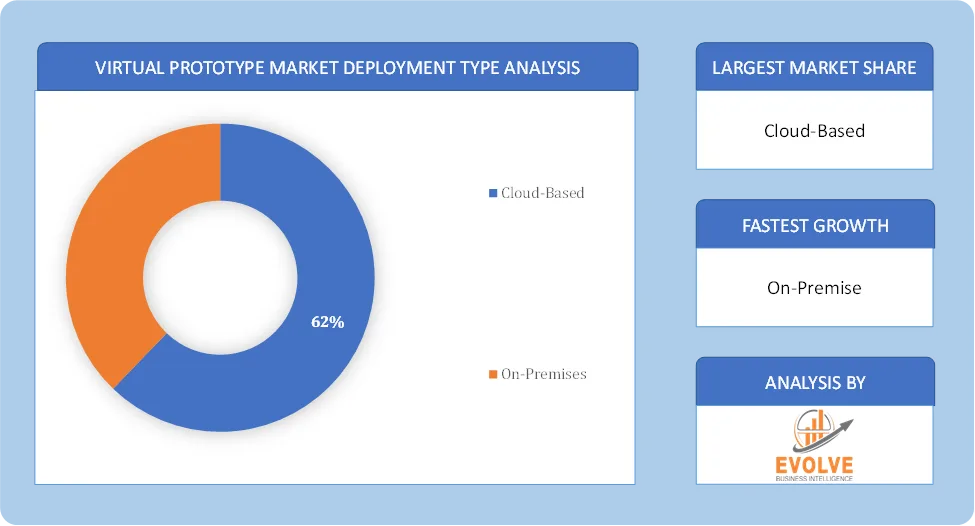
CHAPTER 7. Virtual Prototype Market, By Deployment Type
7.1. Introduction
7.1.1. Cloud-Based
7.1.2. On-Premises
CHAPTER 8. Virtual Prototype Market, By Technology
8.1. Introduction
8.1.1. Finite Element Analysis
8.1.2. Computational Fluid Dynamics
8.1.3. Multibody Dynamics
8.1.4. System Modeling
CHAPTER 9. Virtual Prototype Market, By Application
9.1. Introduction
9.1.1. Automotive
9.1.2. Aerospace
9.1.3. Consumer Electronics
9.1.4. Medical Devices
CHAPTER 10. Virtual Prototype Market, By End Use
10.1.Introduction
10.1.1. Design Verification
10.1.2. Cost Reduction
10.1.3. Performance Optimization
CHAPTER 11. Virtual Prototype Market, By Region
11.1. Introduction
11.2. NORTH AMERICA
11.2.1. North America: Market Size and Forecast, By Country, 2021 – 2034 ($ Million)
11.2.2. North America: Market Size and Forecast, By Deployment Mode, 2021 – 2034 ($ Million)
11.2.3. North America: Market Size and Forecast, By Technology, 2021 – 2034 ($ Million)
11.2.4. North America: Market Size and Forecast, By Application, 2021 – 2034 ($ Million)
11.2.5. North America: Market Size and Forecast, By End User, 2021 – 2034 ($ Million)
11.2.6. US
11.2.6.1. US: Market Size and Forecast, By Deployment Mode, 2021 – 2034 ($ Million)
11.2.6.2. US: Market Size and Forecast, By Technology, 2021 – 2034 ($ Million)
11.2.6.3. US: Market Size and Forecast, By Application, 2021 – 2034 ($ Million)
11.2.6.4. US: Market Size and Forecast, By End User, 2021 – 2034 ($ Million)
11.2.7. CANADA
11.2.7.1. Canada: Market Size and Forecast, By Deployment Mode, 2021 – 2034 ($ Million)
11.2.7.2. Canada: Market Size and Forecast, By Technology, 2021 – 2034 ($ Million)
11.2.7.3. Canada: Market Size and Forecast, By Application, 2021 – 2034 ($ Million)
11.2.7.4. Canada: Market Size and Forecast, By End User, 2021 – 2034 ($ Million)
11.2.8. MEXICO
11.2.8.1. Mexico: Market Size and Forecast, By Deployment Mode, 2021 – 2034 ($ Million)
11.2.8.2. Mexico: Market Size and Forecast, By Technology, 2021 – 2034 ($ Million)
11.2.8.3. Mexico: Market Size and Forecast, By Application, 2021 – 2034 ($ Million)
11.2.8.4. Mexico: Market Size and Forecast, By End User, 2021 – 2034 ($ Million)
11.3. Europe
11.3.1. Europe: Market Size and Forecast, By Country, 2021 – 2034 ($ Million)
11.3.2. Europe: Market Size and Forecast, By Deployment Mode, 2021 – 2034 ($ Million)
11.3.3. Europe: Market Size and Forecast, By Technology, 2021 – 2034 ($ Million)
11.3.4. Europe: Market Size and Forecast, By Application, 2021 – 2034 ($ Million)
11.3.5. Europe: Market Size and Forecast, By End User, 2021 – 2034 ($ Million)
11.3.6. U.K.
11.3.6.1. U.K.: Market Size and Forecast, By Deployment Mode, 2021 – 2034 ($ Million)
11.3.6.2. U.K.: Market Size and Forecast, By Technology, 2021 – 2034 ($ Million)
11.3.6.3. U.K.: Market Size and Forecast, By Application, 2021 – 2034 ($ Million)
11.3.6.4. U.K.: Market Size and Forecast, By End User, 2021 – 2034 ($ Million)
11.3.7. GERMANY
11.3.7.1. Germany: Market Size and Forecast, By Deployment Mode, 2021 – 2034 ($ Million)
11.3.7.2. Germany: Market Size and Forecast, By Technology, 2021 – 2034 ($ Million)
11.3.7.3. Germany: Market Size and Forecast, By Application, 2021 – 2034 ($ Million)
11.3.7.4. Germany: Market Size and Forecast, By End User, 2021 – 2034 ($ Million)
11.3.8. FRANCE
11.3.8.1. France: Market Size and Forecast, By Deployment Mode, 2021 – 2034 ($ Million)
11.3.8.2. France: Market Size and Forecast, By Technology, 2021 – 2034 ($ Million)
11.3.8.3. France: Market Size and Forecast, By Application, 2021 – 2034 ($ Million)
11.3.8.4. France: Market Size and Forecast, By End User, 2021 – 2034 ($ Million)
11.3.9. ITALY
11.3.9.1. Italy: Market Size and Forecast, By Deployment Mode, 2021 – 2034 ($ Million)
11.3.9.2. Italy: Market Size and Forecast, By Technology, 2021 – 2034 ($ Million)
11.3.9.3. Italy: Market Size and Forecast, By Application, 2021 – 2034 ($ Million)
11.3.9.4. Italy: Market Size and Forecast, By End User, 2021 – 2034 ($ Million)
11.3.10. SPAIN
11.3.10.1. Spain: Market Size and Forecast, By Deployment Mode, 2021 – 2034 ($ Million)
11.3.10.2. Spain: Market Size and Forecast, By Technology, 2021 – 2034 ($ Million)
11.3.10.3. Spain: Market Size and Forecast, By Application, 2021 – 2034 ($ Million)
11.3.10.4. Spain: Market Size and Forecast, By End User, 2021 – 2034 ($ Million)
11.3.11. BENELUX
11.3.11.1. BeNeLux: Market Size and Forecast, By Deployment Mode, 2021 – 2034 ($ Million)
11.3.11.2. BeNeLux: Market Size and Forecast, By Technology, 2021 – 2034 ($ Million)
11.3.11.3. BeNeLux: Market Size and Forecast, By Application, 2021 – 2034 ($ Million)
11.3.11.4. BeNeLux: Market Size and Forecast, By End User, 2021 – 2034 ($ Million)
11.3.12. RUSSIA
11.3.12.1. Russia: Market Size and Forecast, By Deployment Mode, 2021 – 2034 ($ Million)
11.3.12.2. Russia: Market Size and Forecast, By Technology, 2021 – 2034 ($ Million)
11.3.12.3. Russia: Market Size and Forecast, By Application, 2021 – 2034 ($ Million)
11.3.12.4. Russia: Market Size and Forecast, By End User, 2021 – 2034 ($ Million)
11.3.13. REST OF EUROPE
11.3.13.1. Rest of Europe: Market Size and Forecast, By Deployment Mode, 2021 – 2034 ($ Million)
11.3.13.2. Rest of Europe: Market Size and Forecast, By Technology, 2021 – 2034 ($ Million)
11.3.13.3. Rest of Europe: Market Size and Forecast, By Application, 2021 – 2034 ($ Million)
11.3.13.4. Rest of Europe: Market Size and Forecast, By End User, 2021 – 2034 ($ Million)
11.4. Asia Pacific
11.4.1. Asia Pacific: Market Size and Forecast, By Country, 2021 – 2034 ($ Million)
11.4.2. Asia Pacific: Market Size and Forecast, By Deployment Mode, 2021 – 2034 ($ Million)
11.4.3. Asia Pacific: Market Size and Forecast, By Technology, 2021 – 2034 ($ Million)
11.4.4. Asia Pacific: Market Size and Forecast, By Application, 2021 – 2034 ($ Million)
11.4.5. Asia Pacific: Market Size and Forecast, By End User, 2021 – 2034 ($ Million)
11.4.6. CHINA
11.4.6.1. China: Market Size and Forecast, By Deployment Mode, 2021 – 2034 ($ Million)
11.4.6.2. China: Market Size and Forecast, By Technology, 2021 – 2034 ($ Million)
11.4.6.3. China: Market Size and Forecast, By Application, 2021 – 2034 ($ Million)
11.4.6.4. China: Market Size and Forecast, By End User, 2021 – 2034 ($ Million)
11.4.7. JAPAN
11.4.7.1. Japan: Market Size and Forecast, By Deployment Mode, 2021 – 2034 ($ Million)
11.4.7.2. Japan: Market Size and Forecast, By Technology, 2021 – 2034 ($ Million)
11.4.7.3. Japan: Market Size and Forecast, By Application, 2021 – 2034 ($ Million)
11.4.7.4. Japan: Market Size and Forecast, By End User, 2021 – 2034 ($ Million)
11.4.8. INDIA
11.4.8.1. India: Market Size and Forecast, By Deployment Mode, 2021 – 2034 ($ Million)
11.4.8.2. India: Market Size and Forecast, By Technology, 2021 – 2034 ($ Million)
11.4.8.3. India: Market Size and Forecast, By Application, 2021 – 2034 ($ Million)
11.4.8.4. India: Market Size and Forecast, By End User, 2021 – 2034 ($ Million)
11.4.9. SOUTH KOREA
11.4.9.1. South Korea: Market Size and Forecast, By Deployment Mode, 2021 – 2034 ($ Million)
11.4.9.2. South Korea: Market Size and Forecast, By Technology, 2021 – 2034 ($ Million)
11.4.9.3. South Korea: Market Size and Forecast, By Application, 2021 – 2034 ($ Million)
11.4.9.4. South Korea: Market Size and Forecast, By End User, 2021 – 2034 ($ Million)
11.4.10. THAILAND
11.4.10.1. Thailand: Market Size and Forecast, By Deployment Mode, 2021 – 2034 ($ Million)
11.4.10.2. Thailand: Market Size and Forecast, By Technology, 2021 – 2034 ($ Million)
11.4.10.3. Thailand: Market Size and Forecast, By Application, 2021 – 2034 ($ Million)
11.4.10.4. Thailand: Market Size and Forecast, By End User, 2021 – 2034 ($ Million)
11.4.11. INDONESIA
11.4.11.1. Indonesia: Market Size and Forecast, By Deployment Mode, 2021 – 2034 ($ Million)
11.4.11.2. Indonesia: Market Size and Forecast, By Technology, 2021 – 2034 ($ Million)
11.4.11.3. Indonesia: Market Size and Forecast, By Application, 2021 – 2034 ($ Million)
11.4.11.4. Indonesia: Market Size and Forecast, By End User, 2021 – 2034 ($ Million)
11.4.12. MALAYSIA
11.4.12.1. Malaysia: Market Size and Forecast, By Deployment Mode, 2021 – 2034 ($ Million)
11.4.12.2. Malaysia: Market Size and Forecast, By Technology, 2021 – 2034 ($ Million)
11.4.12.3. Malaysia: Market Size and Forecast, By Application, 2021 – 2034 ($ Million)
11.4.12.4. Malaysia: Market Size and Forecast, By End User, 2021 – 2034 ($ Million)
11.4.13. AUSTRALIA
11.4.13.1. Australia: Market Size and Forecast, By Deployment Mode, 2021 – 2034 ($ Million)
11.4.13.2. Australia: Market Size and Forecast, By Technology, 2021 – 2034 ($ Million)
11.4.13.3. Australia: Market Size and Forecast, By Application, 2021 – 2034 ($ Million)
11.4.13.4. Australia: Market Size and Forecast, By End User, 2021 – 2034 ($ Million)
11.4.14. REST FO ASIA PACIFIC
11.4.14.1. Rest fo Asia Pacific: Market Size and Forecast, By Deployment Mode, 2021 – 2034 ($ Million)
11.4.14.2. Rest fo Asia Pacific: Market Size and Forecast, By Technology, 2021 – 2034 ($ Million)
11.4.14.3. Rest fo Asia Pacific: Market Size and Forecast, By Application, 2021 – 2034 ($ Million)
11.4.14.4. Rest fo Asia Pacific: Market Size and Forecast, By End User, 2021 – 2034 ($ Million)
11.5. South America
11.5.1. South America: Market Size and Forecast, By Country, 2021 – 2034 ($ Million)
11.5.2. South America: Market Size and Forecast, By Deployment Mode, 2021 – 2034 ($ Million)
11.5.3. South America: Market Size and Forecast, By Technology, 2021 – 2034 ($ Million)
11.5.4. South America: Market Size and Forecast, By Application, 2021 – 2034 ($ Million)
11.5.5. South America: Market Size and Forecast, By End User, 2021 – 2034 ($ Million)
11.5.6. BRAZIL
11.5.6.1. Brazil: Market Size and Forecast, By Deployment Mode, 2021 – 2034 ($ Million)
11.5.6.2. Brazil: Market Size and Forecast, By Technology, 2021 – 2034 ($ Million)
11.5.6.3. Brazil: Market Size and Forecast, By Application, 2021 – 2034 ($ Million)
11.5.6.4. Brazil: Market Size and Forecast, By End User, 2021 – 2034 ($ Million)
11.5.7. ARGENTINA
11.5.7.1. Argentina: Market Size and Forecast, By Deployment Mode, 2021 – 2034 ($ Million)
11.5.7.2. Argentina: Market Size and Forecast, By Technology, 2021 – 2034 ($ Million)
11.5.7.3. Argentina: Market Size and Forecast, By Application, 2021 – 2034 ($ Million)
11.5.7.4. Argentina: Market Size and Forecast, By End User, 2021 – 2034 ($ Million)
11.5.8. REST OF SOUTH AMERICA
11.5.8.1. Rest of South America: Market Size and Forecast, By Deployment Mode, 2021 – 2034 ($ Million)
11.5.8.2. Rest of South America: Market Size and Forecast, By Technology, 2021 – 2034 ($ Million)
11.5.8.3. Rest of South America: Market Size and Forecast, By Application, 2021 – 2034 ($ Million)
11.5.8.4. Rest of South America: Market Size and Forecast, By End User, 2021 – 2034 ($ Million)
11.6. Middle East & Africa
11.6.1. Middle East & Africa: Market Size and Forecast, By Country, 2021 – 2034 ($ Million)
11.6.2. Middle East & Africa: Market Size and Forecast, By Deployment Mode, 2021 – 2034 ($ Million)
11.6.3. Middle East & Africa: Market Size and Forecast, By Technology, 2021 – 2034 ($ Million)
11.6.4. Middle East & Africa: Market Size and Forecast, By Application, 2021 – 2034 ($ Million)
11.6.5. Middle East & Africa: Market Size and Forecast, By End User, 2021 – 2034 ($ Million)
11.6.6. SAUDI ARABIA
11.6.6.1. Saudi Arabia: Market Size and Forecast, By Deployment Mode, 2021 – 2034 ($ Million)
11.6.6.2. Saudi Arabia: Market Size and Forecast, By Technology, 2021 – 2034 ($ Million)
11.6.6.3. Saudi Arabia: Market Size and Forecast, By Application, 2021 – 2034 ($ Million)
11.6.6.4. Saudi Arabia: Market Size and Forecast, By End User, 2021 – 2034 ($ Million)
11.6.7. UAE
11.6.7.1. UAE: Market Size and Forecast, By Deployment Mode, 2021 – 2034 ($ Million)
11.6.7.2. UAE: Market Size and Forecast, By Technology, 2021 – 2034 ($ Million)
11.6.7.3. UAE: Market Size and Forecast, By Application, 2021 – 2034 ($ Million)
11.6.7.4. UAE: Market Size and Forecast, By End User, 2021 – 2034 ($ Million)
11.6.8. EGYPT
11.6.8.1. Egypt: Market Size and Forecast, By Deployment Mode, 2021 – 2034 ($ Million)
11.6.8.2. Egypt: Market Size and Forecast, By Technology, 2021 – 2034 ($ Million)
11.6.8.3. Egypt: Market Size and Forecast, By Application, 2021 – 2034 ($ Million)
11.6.8.4. Egypt: Market Size and Forecast, By End User, 2021 – 2034 ($ Million)
11.6.9. SOUTH AFRICA
11.6.9.1. South Africa: Market Size and Forecast, By Deployment Mode, 2021 – 2034 ($ Million)
11.6.9.2. South Africa: Market Size and Forecast, By Technology, 2021 – 2034 ($ Million)
11.6.9.3. South Africa: Market Size and Forecast, By Application, 2021 – 2034 ($ Million)
11.6.9.4. South Africa: Market Size and Forecast, By End User, 2021 – 2034 ($ Million)
11.6.10. REST OF MIDDLE EAST & AFRICA
11.6.10.1. Rest of Middle East & Africa: Market Size and Forecast, By Deployment Mode, 2021 – 2034 ($ Million)
11.6.10.2. Rest of Middle East & Africa: Market Size and Forecast, By Technology, 2021 – 2034 ($ Million)
11.6.10.3. Rest of Middle East & Africa: Market Size and Forecast, By Application, 2021 – 2034 ($ Million)
11.6.10.4. Rest of Middle East & Africa: Market Size and Forecast, By End User, 2021 – 2034 ($ Million)
CHAPTER 12. Competitive Landscape
12.1. Competitior Benchmarking 2023
12.2. Market Share Analysis
12.3. Key Developments Analysis By Top 5 Companies
12.4. Market Share Acquisition Strategies: Analysis of Key Approaches Employed by Top Players
CHAPTER 13. Company Profiles
13.1. MSC Software
13.1.1. Business Overview
13.1.2. Financial Analysis
13.1.2.1. Business Segment Revenue, 2018, 2019, 2020, $ Million
13.1.2.2. Geographic Revenue Mix, 2020 (% Share)
13.1.3. Product Portfolio
13.1.4. Recent Development and Strategies Adopted
13.1.5. SWOT Analysis
13.2. Bentley Systems
13.3. Oracle
13.4. Synopsys
13.5. IBM
13.6. COMSOL
13.7. Dassault Systemes
13.8. MathWorks
13.9. Siemens
13.10. PTC.