Steel wire Market Analysis and Global Forecast 2023-2033

$ 1,390.00$ 5,520.00

Steel wire Market Research Report: By Type (Carbon Steel, Alloy Steel, Stainless Steel, Others), By Form (Non-rope, Rope), By Application (0.01 mm to 0.8 mm, 0.8 mm to 1.6 mm, 1.6 mm to 4 mm, 4 mm & above), By End Use (Construction, Automotive, Energy, Agriculture, Industrial, Others), and by Region — Forecast till 2033

Page: 129

Report Published on: October 22, 2024
$ 3,470.00
$ 5,520.00
$ 1,390.00
Report Code: EBI7183288 Categories: ,
Description

Steel wire Market Overview

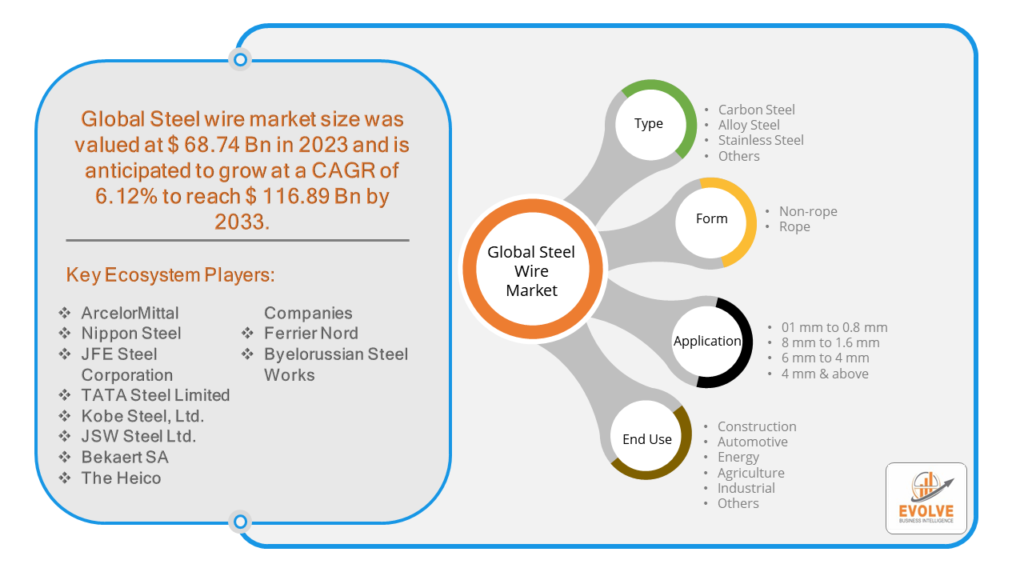
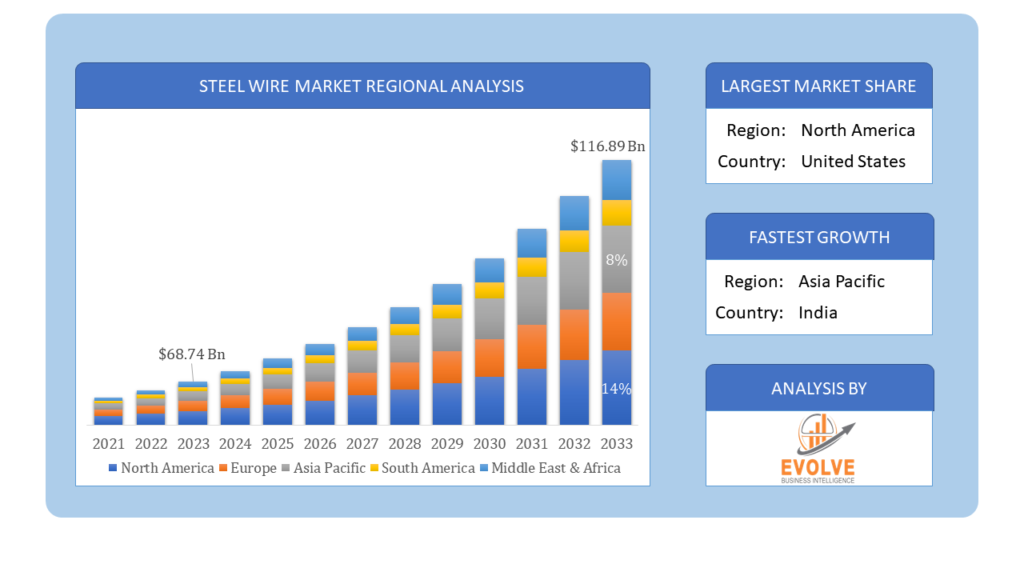
Steel wire Market Size is expected to reach USD 116.89 Billion by 2033. The Steel wire industry size accounted for USD 68.74 Billion in 2023 and is expected to expand at a compound annual growth rate (CAGR) of 6.12% from 2023 to 2033. The steel wire market refers to the production, distribution, and application of various types of steel wire used in industries such as construction, automotive, manufacturing, and aerospace. The market is driven by the versatile applications of steel wire and the growth of these industries. Factors such as increasing urbanization, infrastructure development, and the expansion of the automotive industry contribute significantly to the market’s growth. The market is highly competitive, with key players investing in research and development to stay ahead. The market is segmented by form, type, and end-use industry. Steel wire is used in various applications, including construction, automotive, manufacturing, and aerospace, with construction being the key application segment. The market is expected to grow at a compound annual growth rate of 4.7% from 2022 to 2030.

Global Steel wire Market Synopsis

Steel wire MarketCOVID-19 Impact Analysis

The Steel wire market experienced a detrimental effect due to the Covid-19 pandemic. The COVID-19 epidemic has caused supply chain hiccups that have resulted in shortages or decreased demand for steel wire. Spending by consumers and businesses has decreased significantly as a result of the travel restrictions and social distancing measures, and this trend is expected to persist for some time. The epidemic has altered end-user trends and tastes, prompting manufacturers, developers, and service providers to implement diverse tactics aimed at stabilizing their businesses.

Global Steel wire Market Dynamics

The major factors that have impacted the growth of Steel wire are as follows:

Drivers:

⮚      Technological Advancements

Advances in steel manufacturing technologies, such as improved alloys and production processes, can enhance the quality and performance of steel wire, making it more appealing for various applications and driving long-term demand.

Restraint:

  • Shifts in Consumer Preferences and Technological Advancements

Opportunity:

⮚      E-commerce and Logistics

The growth of e-commerce and the logistics industry creates demand for packaging materials, storage solutions, and transportation infrastructure, all of which rely on steel wire products. As online shopping continues to expand globally, there is a growing need for durable and reliable steel wire for pallets, shelving, and material handling equipment.

Steel wire Market Segment Overview

By Type
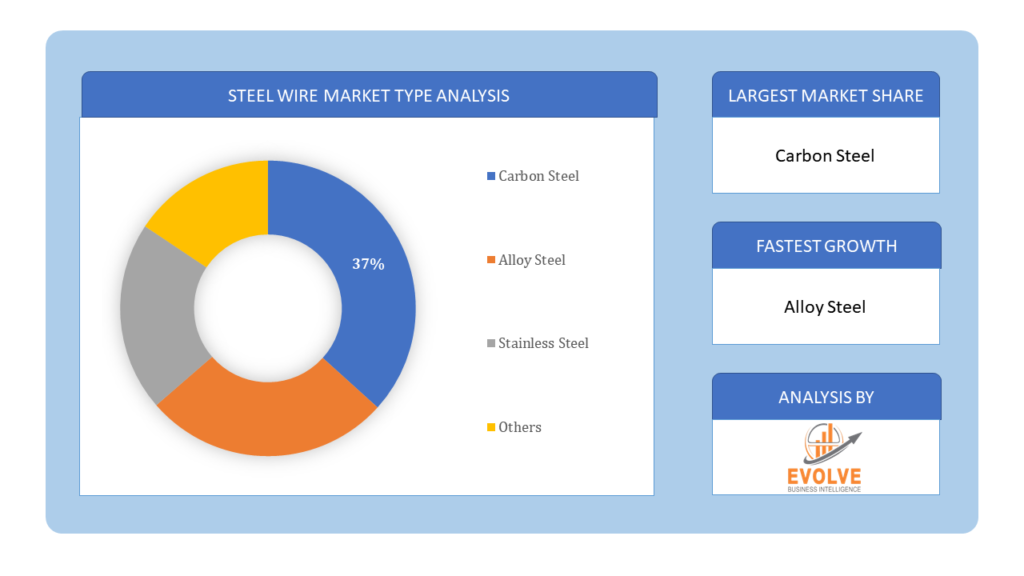
Steel wire Market type AnalysisBased on the Type, the market is segmented based on Carbon Steel, Alloy Steel, Stainless Steel, Others. With a revenue share of more than 64.0%, carbon steel led the global market in 2021, and it is expected that this trend would hold true for the duration of the forecast. Wires are made from both low- and high-carbon steel and are mostly utilized in the construction, automotive, and military industries.

By Form

Based on Form, the market has been divided into Non-rope, Rope. the Non-rope segment includes wire forms utilized in various industrial applications such as fencing, welding electrodes, and automotive components. Meanwhile, the Rope segment encompasses wire forms primarily employed in construction, marine, and utility sectors for their tensile strength and durability in rope manufacturing

By Application

Based on the Application, the market has been divided into 0.01 mm to 0.8 mm, 0.8 mm to 1.6 mm, 1.6 mm to 4 mm, 4 mm & above. he 0.01 mm to 0.8 mm segment caters to intricate applications like electronics and medical devices due to its fine diameter. The 0.8 mm to 1.6 mm segment serves diverse industries including construction and automotive for medium-duty applications like reinforcement and fastening. The 1.6 mm to 4 mm segment is vital in heavy machinery and infrastructure projects for its strength, while the 4 mm & above segment is crucial for heavy-duty applications like bridges, oil rigs, and lifting equipment.

By End Use

Based on End Use, the market has been divided into Construction, Automotive, Energy, Agriculture, Industrial, Others. Energy is anticipated to emerge as the fastest-growing application segment during the forecast period. The growing need for power and its distribution is propelling massive investments in the energy industry, which is benefiting market growth.

Global Steel wire Market Regional Analysis

Based on region, the market has been divided into North America, Europe, Asia-Pacific, the Middle East & Africa, and Latin America. The area of Asia Pacific is anticipated to dominate the market for the usage of Steel wire, followed by those in North America and Europe.

Global Steel wire Market Regional Analysis Steel wire Asia Pacific Market

The Asia Pacific region holds a dominant position in the Steel wire market. With a 56.0% revenue share, Asia Pacific led the global market, and this trend is anticipated to hold throughout the projection period. The region’s strength can be attributed to the presence of manufacturers, end consumers, and suppliers of raw materials. Manufacturers in Asia are increasing their output to meet the demands of both domestic and foreign markets.

Steel wire North America Market

The North America region is witnessing rapid growth and emerging as a significant market for the Steel wire industry. It is projected that the global market’s fastest-growing regional segment would be North America. Over the course of the forecast period, rising investments in the energy, industrial, and construction sectors are expected to boost product demand in the area

Competitive Landscape

The competitive landscape includes key players (tier 1, tier 2, and local) having a presence across the globe. Companies such as ArcelorMittal, Nippon Steel, JFE Steel Corporation, TATA Steel Limited, and Kobe Steel, Ltd are some of the leading players in the global Steel wire Industry. These players have adopted partnership, acquisition, expansion, and new product development, among others as their key strategies.

Key Market Players:

  • ArcelorMittal
  • Nippon Steel
  • JFE Steel Corporation
  • TATA Steel Limited
  • Kobe Steel, Ltd
  • JSW Steel Ltd.
  • Bekaert SA
  • The Heico Companies
  • Ferrier Nord
  • Byelorussian Steel Works

Key Development:

In September 2022, Nippon Steel announced a groundbreaking advancement in steel wire technology, introducing a new alloy formulation that significantly enhances tensile strength while maintaining flexibility. This innovation promises to revolutionize industries reliant on steel wire, such as automotive, construction, and manufacturing, by offering unprecedented durability and performance in their products and applications.

Scope of the Report

Global Steel wire Market, by Type
  • Carbon Steel
  • Alloy Steel
  • Stainless Steel
  • Others
Global Steel wire Market, by Form
  • Non-rope
  • Rope
Global Steel wire Market, by Application
  • 01 mm to 0.8 mm
  • 8 mm to 1.6 mm
  • 6 mm to 4 mm
  • 4 mm & above
Global Steel wire Market, by End Use
  • Construction
  • Automotive
  • Energy
  • Agriculture
  • Industrial
  • Others
Global Steel wire Market, by Region
  • North America
    • US
    • Canada
    • Mexico
  • Europe
    • UK
    • Germany
    • France
    • Italy
    • Spain
    • Benelux
    • Nordic
    • Rest of Europe
  • Asia Pacific
    • China
    • Japan
    • South Korea
    • Indonesia
    • Austalia
    • Malaysia
    • India
    • Rest of Asia Pacific
  • South America
    • Brazil
    • Argentina
    • Rest of South America
  • Middle East & Africa
    • Saudi Arabia
    • UAE
    • Egypt
    • South Africa
    • Rest of Middle East & Africa


Parameters Indicators
Market Size 2033: $116.89 Billion
CAGR 6.12% CAGR (2023-2033)
Base year 2022
Forecast Period 2023-2033
Historical Data 2021
Report Coverage Revenue Forecast, Competitive Landscape, Growth Factors, and Trends
Key Segmentations Type, Form, Application, End Use
Geographies Covered North America, Europe, Asia-Pacific, Latin America, Middle East, Africa
Key Vendors ArcelorMittal, Nippon Steel, JFE Steel Corporation, TATA Steel Limited, Kobe Steel, Ltd, JSW Steel Ltd., Bekaert SA, The Heico Companies, Ferrier Nord, Byelorussian Steel Works
Key Market Opportunities Automotive Lightweighting
Key Market Drivers Substitution and Innovation
Technological Advancements


REPORT CONTENT BRIEF:

  • High-level analysis of the current and future Steel wire Industry trends and opportunities
  • Detailed analysis of current market drivers, restraining factors, and opportunities analysis in the future
  • Historical market size for the year 2021, and forecast from 2023 to 2033
  • Steel wire market share analysis for each segment
  • Competitor analysis with a comprehensive insight into its product segment, financial strength, and strategies adopted.
  • Identifies key strategies adopted by the key players including new product development, mergers and acquisitions, joint ventures, collaborations, and partnerships.
  • To identify and understand the various factors involved in the global Steel wire market affected by the pandemic
  • To provide year-on-year growth from 2022 to 2033
  • To provide short-term, long-term, and overall CAGR comparison from 2022 to 2033.
  • Provide Total Addressable Market (TAM) for the Global Steel wire Market.

For more details mail us at

Ask a question / additional requirement

Frequently Asked Questions (FAQ)

The Steel wire market is expected to expand at a compound annual growth rate (CAGR) of 6.12% from 2023 to 2033.

The Asia Pacific region is anticipated to witness the highest growth rate in the Steel wire market due to the presence of manufacturers, end consumers, and suppliers of raw materials.

Currently, Asia Pacific holds the largest share of the Steel wire market, driven by factors such as rising investments in various sectors and increasing demand from domestic and foreign markets.

Key players in the Steel wire market include ArcelorMittal, Nippon Steel, JFE Steel Corporation, TATA Steel Limited, Kobe Steel, Ltd, JSW Steel Ltd., Bekaert SA, The Heico Companies, Ferrier Nord, and Byelorussian Steel Works, among others.

Yes, we offer 16 hours of analyst support to solve the queries

Yes, we provide regional as well as country-level reports. Other than this we also provide a sectional report. Please get in contact with our sales representatives.

Table of Content

Table of Content

CHAPTER 1.                 Executive Summary

CHAPTER 2.                 Scope of the Study

2.1.        Market Definition

2.2.        Market Scope & Segmentation

2.2.1.         Objective of Report

CHAPTER 3.                 Evolve BI Methodology

3.1.        Data Collection & Validation Approach

3.2.        Market Size Estimation and Forecast

CHAPTER 4.                 Exclusive Analysis

4.1.        Market Opportunity Score

4.1.1.         Type Segement – Market Opportunity Score

4.1.2.         Form Segment – Market Opportunity Score

4.1.3.         Application Segment – Market Opportunity Score

4.1.4.         End Use Segment – Market Opportunity Score

4.2.        Key Market Influencing Indicators

CHAPTER 5.                 Market Insights and Trends

5.1.        Value Chain Analysis

5.1.1.         Type

5.1.2.         Manufacturing Process

5.1.3.         Distribution Channel

5.1.4.         End User

5.2.        Porter’s Five Forces Analysis

5.2.1.         Bargaining Power of Buyers

5.2.2.         Bargaining Power of Suppliers

5.2.3.         Threat of New Entrant

5.2.4.         Threat of Substitute

5.2.5.         Industry Rivalry

5.3.        COVID-19 Impact and Post COVID Scenario on Steel wire Market

5.3.1.         Impact of COVID-19

5.3.2.         Government Support and Industry Revival Policies

5.3.3.         Measures Taken by Companies to Mitigate Negative Impact

5.3.4.         Post COVID Trend

CHAPTER 6.                 MArket Dynamics

6.1.        Introduction

6.2.        Drivers

6.2.1.         Driver 1

6.2.2.         Driver 2

6.2.3.         Driver 3

6.3.        Restraints

6.3.1.         Restraint 1

6.3.2.         Restraint 2

6.4.        Opportunity

6.4.1.         Opportunity 1

CHAPTER 7.                 Global Steel wire Market, By Type

7.1.        Introduction

7.1.1. Carbon Steel

7.1.2. Alloy Steel

7.1.3. Stainless Steel

7.1.4. Others

CHAPTER 8.                 Global Steel wire Market, By Form

8.1.        Introduction

8.1.1. Non-rope

8.1.2. Rope

CHAPTER 9.                 Global Steel wire Market, By Application

9.1.        Introduction

9.1.1 01 mm to 0.8 mm

9.1.2. 8 mm to 1.6 mm

9.1.3. 6 mm to 4 mm

9.1.4. 4 mm & above

CHAPTER 10.               Global Steel wire Market, By End Use

10.1.     Introduction

10.1.1. Construction

101.2. Automotive

10.1.3. Energy

10.1.4. Agriculture

10.1.5. Industrial

10.1.6. Others

CHAPTER 11.               Global Steel wire Market, By Region

11.1.     Introduction

11.2.     NORTH AMERICA

11.2.1.      North America: Market Size and Forecast, By Country, 2023 – 2033 ($ Million)

11.2.2.      North America: Market Size and Forecast, By Type, 2023 – 2033 ($ Million)

11.2.3.      North America: Market Size and Forecast, By Form, 2023 – 2033 ($ Million)

11.2.4.      North America: Market Size and Forecast, By Application, 2023 – 2033 ($ Million)

11.2.5.      North America: Market Size and Forecast, By End Use, 2023 – 2033 ($ Million)

11.2.6.      US

11.2.6.1.       US: Market Size and Forecast, By Type, 2023 – 2033 ($ Million)

11.2.6.2.       US: Market Size and Forecast, By Form, 2023 – 2033 ($ Million)

11.2.6.3.       US: Market Size and Forecast, By Application, 2023 – 2033 ($ Million)

11.2.6.4.       US: Market Size and Forecast, By End Use, 2023 – 2033 ($ Million)

11.2.7.      CANADA

11.2.7.1.       Canada: Market Size and Forecast, By Type, 2023 – 2033 ($ Million)

11.2.7.2.       Canada: Market Size and Forecast, By Form, 2023 – 2033 ($ Million)

11.2.7.3.       Canada: Market Size and Forecast, By Application, 2023 – 2033 ($ Million)

11.2.7.4.       Canada: Market Size and Forecast, By End Use, 2023 – 2033 ($ Million)

11.2.8.      MEXICO

11.2.8.1.       Mexico: Market Size and Forecast, By Type, 2023 – 2033 ($ Million)

11.2.8.2.       Mexico: Market Size and Forecast, By Form, 2023 – 2033 ($ Million)

11.2.8.3.       Mexico: Market Size and Forecast, By Application, 2023 – 2033 ($ Million)

11.2.8.4.       Mexico: Market Size and Forecast, By End Use, 2023 – 2033 ($ Million)

11.3.     Europe

11.3.1.      Europe: Market Size and Forecast, By Country, 2023 – 2033 ($ Million)

11.3.2.      Europe: Market Size and Forecast, By Type, 2023 – 2033 ($ Million)

11.3.3.      Europe: Market Size and Forecast, By Form, 2023 – 2033 ($ Million)

11.3.4.      Europe: Market Size and Forecast, By Application, 2023 – 2033 ($ Million)

11.3.5.      Europe: Market Size and Forecast, By End Use, 2023 – 2033 ($ Million)

11.3.6.      U.K.

11.3.6.1.       U.K.: Market Size and Forecast, By Type, 2023 – 2033 ($ Million)

11.3.6.2.       U.K.: Market Size and Forecast, By Form, 2023 – 2033 ($ Million)

11.3.6.3.       U.K.: Market Size and Forecast, By Application, 2023 – 2033 ($ Million)

11.3.6.4.       U.K.: Market Size and Forecast, By End Use, 2023 – 2033 ($ Million)

11.3.7.      GERMANY

11.3.7.1.       Germany: Market Size and Forecast, By Type, 2023 – 2033 ($ Million)

11.3.7.2.       Germany: Market Size and Forecast, By Form, 2023 – 2033 ($ Million)

11.3.7.3.       Germany: Market Size and Forecast, By Application, 2023 – 2033 ($ Million)

11.3.7.4.       Germany: Market Size and Forecast, By End Use, 2023 – 2033 ($ Million)

11.3.8.      FRANCE

11.3.8.1.       France: Market Size and Forecast, By Type, 2023 – 2033 ($ Million)

11.3.8.2.       France: Market Size and Forecast, By Form, 2023 – 2033 ($ Million)

11.3.8.3.       France: Market Size and Forecast, By Application, 2023 – 2033 ($ Million)

11.3.8.4.       France: Market Size and Forecast, By End Use, 2023 – 2033 ($ Million)

11.3.9.      ITALY

11.3.9.1.       Italy: Market Size and Forecast, By Type, 2023 – 2033 ($ Million)

11.3.9.2.       Italy: Market Size and Forecast, By Form, 2023 – 2033 ($ Million)

11.3.9.3.       Italy: Market Size and Forecast, By Application, 2023 – 2033 ($ Million)

11.3.9.4.       Italy: Market Size and Forecast, By End Use, 2023 – 2033 ($ Million)

11.3.10.         SPAIN

11.3.10.1.     Spain: Market Size and Forecast, By Type, 2023 – 2033 ($ Million)

11.3.10.2.     Spain: Market Size and Forecast, By Form, 2023 – 2033 ($ Million)

11.3.10.3.     Spain: Market Size and Forecast, By Application, 2023 – 2033 ($ Million)

11.3.10.4.     Spain: Market Size and Forecast, By End Use, 2023 – 2033 ($ Million)

11.3.11.         BENELUX

11.3.11.1.     BeNeLux: Market Size and Forecast, By Type, 2023 – 2033 ($ Million)

11.3.11.2.     BeNeLux: Market Size and Forecast, By Form, 2023 – 2033 ($ Million)

11.3.11.3.     BeNeLux: Market Size and Forecast, By Application, 2023 – 2033 ($ Million)

11.3.11.4.     BeNeLux: Market Size and Forecast, By End Use, 2023 – 2033 ($ Million)

11.3.12.         RUSSIA

11.3.12.1.     Russia: Market Size and Forecast, By Type, 2023 – 2033 ($ Million)

11.3.12.2.     Russia: Market Size and Forecast, By Form, 2023 – 2033 ($ Million)

11.3.12.3.     Russia: Market Size and Forecast, By Application, 2023 – 2033 ($ Million)

11.3.12.4.     Russia: Market Size and Forecast, By End Use, 2023 – 2033 ($ Million)

11.3.13.         REST OF EUROPE

11.3.13.1.     Rest of Europe: Market Size and Forecast, By Type, 2023 – 2033 ($ Million)

11.3.13.2.     Rest of Europe: Market Size and Forecast, By Form, 2023 – 2033 ($ Million)

11.3.13.3.     Rest of Europe: Market Size and Forecast, By Application, 2023 – 2033 ($ Million)

11.3.13.4.     Rest of Europe: Market Size and Forecast, By End Use, 2023 – 2033 ($ Million)

11.4.     Asia Pacific

11.4.1.      Asia Pacific: Market Size and Forecast, By Country, 2023 – 2033 ($ Million)

11.4.2.      Asia Pacific: Market Size and Forecast, By Type, 2023 – 2033 ($ Million)

11.4.3.      Asia Pacific: Market Size and Forecast, By Form, 2023 – 2033 ($ Million)

11.4.4.      Asia Pacific: Market Size and Forecast, By Application, 2023 – 2033 ($ Million)

11.4.5.      Asia Pacific: Market Size and Forecast, By End Use, 2023 – 2033 ($ Million)

11.4.6.      CHINA

11.4.6.1.       China: Market Size and Forecast, By Type, 2023 – 2033 ($ Million)

11.4.6.2.       China: Market Size and Forecast, By Form, 2023 – 2033 ($ Million)

11.4.6.3.       China: Market Size and Forecast, By Application, 2023 – 2033 ($ Million)

11.4.6.4.       China: Market Size and Forecast, By End Use, 2023 – 2033 ($ Million)

11.4.7.      JAPAN

11.4.7.1.       Japan: Market Size and Forecast, By Type, 2023 – 2033 ($ Million)

11.4.7.2.       Japan: Market Size and Forecast, By Form, 2023 – 2033 ($ Million)

11.4.7.3.       Japan: Market Size and Forecast, By Application, 2023 – 2033 ($ Million)

11.4.7.4.       Japan: Market Size and Forecast, By End Use, 2023 – 2033 ($ Million)

11.4.8.      INDIA

11.4.8.1.       India: Market Size and Forecast, By Type, 2023 – 2033 ($ Million)

11.4.8.2.       India: Market Size and Forecast, By Form, 2023 – 2033 ($ Million)

11.4.8.3.       India: Market Size and Forecast, By Application, 2023 – 2033 ($ Million)

11.4.8.4.       India: Market Size and Forecast, By End Use, 2023 – 2033 ($ Million)

11.4.9.      SOUTH KOREA

11.4.9.1.       South Korea: Market Size and Forecast, By Type, 2023 – 2033 ($ Million)

11.4.9.2.       South Korea: Market Size and Forecast, By Form, 2023 – 2033 ($ Million)

11.4.9.3.       South Korea: Market Size and Forecast, By Application, 2023 – 2033 ($ Million)

11.4.9.4.       South Korea: Market Size and Forecast, By End Use, 2023 – 2033 ($ Million)

11.4.10.         THAILAND

11.4.10.1.     Thailand: Market Size and Forecast, By Type, 2023 – 2033 ($ Million)

11.4.10.2.     Thailand: Market Size and Forecast, By Form, 2023 – 2033 ($ Million)

11.4.10.3.     Thailand: Market Size and Forecast, By Application, 2023 – 2033 ($ Million)

11.4.10.4.     Thailand: Market Size and Forecast, By End Use, 2023 – 2033 ($ Million)

11.4.11.         INDONESIA

11.4.11.1.     Indonesia: Market Size and Forecast, By Type, 2023 – 2033 ($ Million)

11.4.11.2.     Indonesia: Market Size and Forecast, By Form, 2023 – 2033 ($ Million)

11.4.11.3.     Indonesia: Market Size and Forecast, By Application, 2023 – 2033 ($ Million)

11.4.11.4.     Indonesia: Market Size and Forecast, By End Use, 2023 – 2033 ($ Million)

11.4.12.         MALAYSIA

11.4.12.1.     Malaysia: Market Size and Forecast, By Type, 2023 – 2033 ($ Million)

11.4.12.2.     Malaysia: Market Size and Forecast, By Form, 2023 – 2033 ($ Million)

11.4.12.3.     Malaysia: Market Size and Forecast, By Application, 2023 – 2033 ($ Million)

11.4.12.4.     Malaysia: Market Size and Forecast, By End Use, 2023 – 2033 ($ Million)

11.4.13.         AUSTRALIA

11.4.13.1.     Australia: Market Size and Forecast, By Type, 2023 – 2033 ($ Million)

11.4.13.2.     Australia: Market Size and Forecast, By Form, 2023 – 2033 ($ Million)

11.4.13.3.     Australia: Market Size and Forecast, By Application, 2023 – 2033 ($ Million)

11.4.13.4.     Australia: Market Size and Forecast, By End Use, 2023 – 2033 ($ Million)

11.4.14.         REST FO ASIA PACIFIC

11.4.14.1.     Rest fo Asia Pacific: Market Size and Forecast, By Type, 2023 – 2033 ($ Million)

11.4.14.2.     Rest fo Asia Pacific: Market Size and Forecast, By Form, 2023 – 2033 ($ Million)

11.4.14.3.     Rest fo Asia Pacific: Market Size and Forecast, By Application, 2023 – 2033 ($ Million)

11.4.14.4.     Rest fo Asia Pacific: Market Size and Forecast, By End Use, 2023 – 2033 ($ Million)

11.5.     South America

11.5.1.      South America: Market Size and Forecast, By Country, 2023 – 2033 ($ Million)

11.5.2.      South America: Market Size and Forecast, By Type, 2023 – 2033 ($ Million)

11.5.3.      South America: Market Size and Forecast, By Form, 2023 – 2033 ($ Million)

11.5.4.      South America: Market Size and Forecast, By Application, 2023 – 2033 ($ Million)

11.5.5.      South America: Market Size and Forecast, By End Use, 2023 – 2033 ($ Million)

11.5.6.      BRAZIL

11.5.6.1.       Brazil: Market Size and Forecast, By Type, 2023 – 2033 ($ Million)

11.5.6.2.       Brazil: Market Size and Forecast, By Form, 2023 – 2033 ($ Million)

11.5.6.3.       Brazil: Market Size and Forecast, By Application, 2023 – 2033 ($ Million)

11.5.6.4.       Brazil: Market Size and Forecast, By End Use, 2023 – 2033 ($ Million)

11.5.7.      ARGENTINA

11.5.7.1.       Argentina: Market Size and Forecast, By Type, 2023 – 2033 ($ Million)

11.5.7.2.       Argentina: Market Size and Forecast, By Form, 2023 – 2033 ($ Million)

11.5.7.3.       Argentina: Market Size and Forecast, By Application, 2023 – 2033 ($ Million)

11.5.7.4.       Argentina: Market Size and Forecast, By End Use, 2023 – 2033 ($ Million)

11.5.8.      REST OF SOUTH AMERICA

11.5.8.1.       Rest of South America: Market Size and Forecast, By Type, 2023 – 2033 ($ Million)

11.5.8.2.       Rest of South America: Market Size and Forecast, By Form, 2023 – 2033 ($ Million)

11.5.8.3.       Rest of South America: Market Size and Forecast, By Application, 2023 – 2033 ($ Million)

11.5.8.4.       Rest of South America: Market Size and Forecast, By End Use, 2023 – 2033 ($ Million)

11.6.     Middle East & Africa

11.6.1.      Middle East & Africa: Market Size and Forecast, By Country, 2023 – 2033 ($ Million)

11.6.2.      Middle East & Africa: Market Size and Forecast, By Type, 2023 – 2033 ($ Million)

11.6.3.      Middle East & Africa: Market Size and Forecast, By Form, 2023 – 2033 ($ Million)

11.6.4.      Middle East & Africa: Market Size and Forecast, By Application, 2023 – 2033 ($ Million)

11.6.5.      Middle East & Africa: Market Size and Forecast, By End Use, 2023 – 2033 ($ Million)

11.6.6.      SAUDI ARABIA

11.6.6.1.       Saudi Arabia: Market Size and Forecast, By Type, 2023 – 2033 ($ Million)

11.6.6.2.       Saudi Arabia: Market Size and Forecast, By Form, 2023 – 2033 ($ Million)

11.6.6.3.       Saudi Arabia: Market Size and Forecast, By Application, 2023 – 2033 ($ Million)

11.6.6.4.       Saudi Arabia: Market Size and Forecast, By End Use, 2023 – 2033 ($ Million)

11.6.7.      UAE

11.6.7.1.       UAE: Market Size and Forecast, By Type, 2023 – 2033 ($ Million)

11.6.7.2.       UAE: Market Size and Forecast, By Form, 2023 – 2033 ($ Million)

11.6.7.3.       UAE: Market Size and Forecast, By Application, 2023 – 2033 ($ Million)

11.6.7.4.       UAE: Market Size and Forecast, By End Use, 2023 – 2033 ($ Million)

11.6.8.      EGYPT

11.6.8.1.       Egypt: Market Size and Forecast, By Type, 2023 – 2033 ($ Million)

11.6.8.2.       Egypt: Market Size and Forecast, By Form, 2023 – 2033 ($ Million)

11.6.8.3.       Egypt: Market Size and Forecast, By Application, 2023 – 2033 ($ Million)

11.6.8.4.       Egypt: Market Size and Forecast, By End Use, 2023 – 2033 ($ Million)

11.6.9.      SOUTH AFRICA

11.6.9.1.       South Africa: Market Size and Forecast, By Type, 2023 – 2033 ($ Million)

11.6.9.2.       South Africa: Market Size and Forecast, By Form, 2023 – 2033 ($ Million)

11.6.9.3.       South Africa: Market Size and Forecast, By Application, 2023 – 2033 ($ Million)

11.6.9.4.       South Africa: Market Size and Forecast, By End Use, 2023 – 2033 ($ Million)

11.6.10.         REST OF MIDDLE EAST & AFRICA

11.6.10.1.     Rest of Middle East & Africa: Market Size and Forecast, By Type, 2023 – 2033 ($ Million)

11.6.10.2.     Rest of Middle East & Africa: Market Size and Forecast, By Form, 2023 – 2033 ($ Million)

11.6.10.3.     Rest of Middle East & Africa: Market Size and Forecast, By Application, 2023 – 2033 ($ Million)

11.6.10.4.     Rest of Middle East & Africa: Market Size and Forecast, By End Use, 2023 – 2033 ($ Million)

CHAPTER 12.               Competitive Landscape

12.1.     Competitior Benchmarking 2023

12.2.     Market Share Analysis

12.3.     Key Developments Analysis By Top 5 Companies

12.4.     Market Share Acquisition Strategies: Analysis of Key Approaches Employed by Top Players

CHAPTER 13.               Company Profiles

13.1.     ArcelorMittal

13.1.1.      Business Overview

13.1.2.      Financial Analysis

13.1.2.1.       Business Segment Revenue, 2018, 2019, 2020, $ Million

13.1.2.2.       Geographic Revenue Mix, 2020 (% Share)

13.1.3.      Product Portfolio

13.1.4.      Recent Development and Strategies Adopted

13.1.5.      SWOT Analysis

13.2.     Nippon Steel

13.3.     JFE Steel Corporation

13.4.     TATA Steel Limited

13.5.     Kobe Steel, Ltd

13.6.     JSW Steel Ltd.

13.7.     Bekaert SA

13.8.     The Heico Companies

13.9.     Ferrier Nord

13.10.  Byelorussian Steel Works

Connect to Analyst

Connect to Analyst

Research Methodology

Research Methodology