Press Release
Evolve Business Intelligence Evolve Business Intelligence
  • Home
  • About Us
  • Services
  • Market Research Report
    • Automotive Market Report
      • Automotive components
      • Vehicle Market Report
      • Chemical Automotive
      • Technology
      • Freight and Logistics market report
      • Material
      • Technology
      • Transport Mode
      • Utility
      • Vehicle Market Report
    • Chemical and Materials
      • Chemical
      • Advanced Materials
      • Coatings and Additives
      • Composites
      • Paints
      • Textile
    • Aerospace and Defence
      • Marine
      • Security
      • Technology
      • Aircraft Components
      • Aircraft Material
    • Construction & Manufacturing
    • Electronics and Semiconductor
      • Display Technology
      • Electronic Component
      • Electronic Devices
      • Semiconductor
      • Communication Equipment
      • Emerging Technologies
      • Security
      • Sensor & Control
      • Technology
    • Energy and Power
    • Life Science
    • Consumer and Goods
      • Baby products and supplies
      • Beauty & Personal Care
      • Consumer
      • Home Products
    • Information and Communication Technology
      • Emerging Technologies
      • Entertainment Technologies
      • Security
      • Communication
      • Data Center
      • Data Center and Networking
      • Software and Services
      • Technology
  • Competitive Intelligence (CI)
    • Automotive (CI)
    • Chemical and Materials (CI)
    • Construction & Manufacturing (CI)
    • Energy and Power (CI)
    • Electronics and Semiconductor (CI)
    • Healthcare (CI)
    • Information and Communication Technology ICT (CI)
  • Contact Us
Menu
Evolve Business Intelligence Evolve Business Intelligence
Press Release
Home Energy and Power Renewable Energy Solar Farm Market Analysis and Global Forecast 2023-2033
Energy and Power

Solar Farm Market Analysis and Global Forecast 2023-2033

$ 1,390.00 – $ 5,520.00

Solar Farm Market Research Report: Information Product Type (Surface Suction, Utility-scale, Distributed Generation, Microgrids, Others), By Application (Residential, Industrial, Commercial, Others), and by Region — Forecast till 2033

Page: 160

Report Published on: January 1, 2025
$ 3,470.00
$ 5,520.00
$ 1,390.00
Clear
Request Free Sample PDF
Report Code: EBI88562 Categories: Energy and Power, Renewable Energy Tags: largest solar farm, largest solar farm in the world, solar agriculture, solar cell farm, solar energy farm, solar farm Industry, solar farm Market Growth, solar farm Market Size, solar farm Market Trends, solar farm share, solar field, solar for agriculture, solar panel farm, solar panel fields
  • Description
  • Table of Content
  • Connect to Analyst
  • Research Methodology
Description

Solar Farm Market Overview

The Solar Farm Market Size is expected to reach USD 15.45 Billion by 2033. The Solar Farm Market industry size accounted for USD 1.53 Billion in 2023 and is expected to expand at a compound annual growth rate (CAGR) of 18.54% from 2023 to 2033. The Solar Farm Market refers to the sector of the energy industry focused on the development, installation, and operation of large-scale solar power plants, also known as solar farms or solar parks. These facilities use photovoltaic (PV) panels or concentrated solar power (CSP) systems to convert sunlight into electricity, which is then fed into the grid to supply power to residential, commercial, and industrial users.

The solar farm market plays a crucial role in the transition to sustainable energy systems, contributing to global efforts to reduce greenhouse gas emissions and mitigate climate change.

Global Solar Farm Market Synopsis
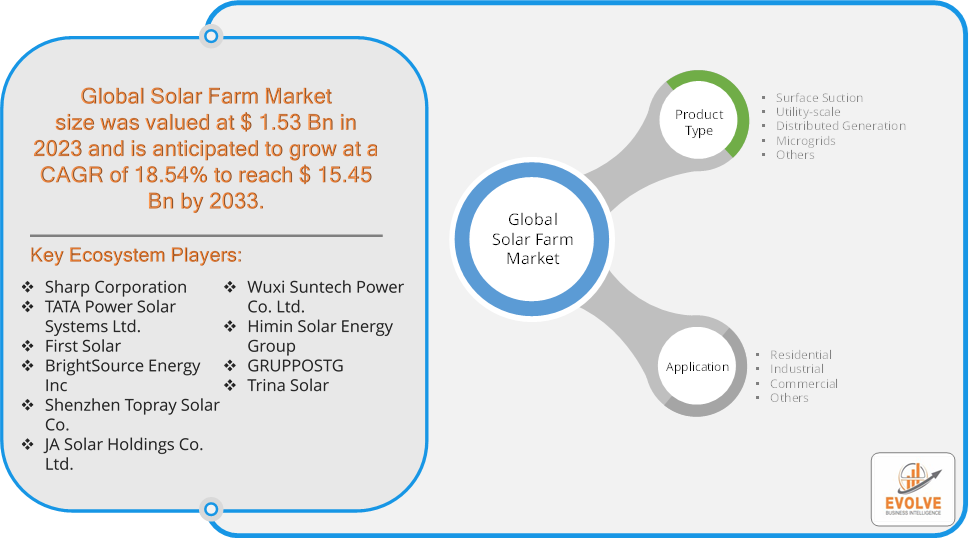
Solar Farm MarketCOVID-19 Impact Analysis

The COVID-19 pandemic had a significant impact on the Solar Farm Market. The pandemic caused disruptions in global supply chains, leading to delays in the delivery of solar panels, inverters, and other essential components. This affected the construction timelines for solar farm projects. Lockdowns and restrictions on movement affected the workforce, causing delays in the construction and commissioning of solar farms. Economic uncertainty led to cautious investment behavior, resulting in the postponement or cancellation of some solar projects. The pandemic altered energy consumption patterns, with reduced demand from commercial and industrial sectors and increased residential demand due to remote work and lockdowns. The crisis highlighted the importance of resilient and decentralized energy systems, increasing interest in solar farms as a stable and sustainable energy source. The pandemic raised awareness of the need for sustainable practices and energy security, boosting interest in solar energy as a reliable and environmentally friendly option. The post-pandemic period presents opportunities for growth, driven by continued demand for renewable energy and supportive government policies.

Solar Farm Market Dynamics

The major factors that have impacted the growth of Solar Farm Market are as follows:

Drivers:

Ø  Increasing Demand for Renewable Energy

The need to reduce greenhouse gas emissions and combat climate change is driving the shift from fossil fuels to renewable energy sources like solar power. Many countries and organizations have set ambitious sustainability and carbon-neutral goals, increasing the demand for solar energy. Advances in energy storage technologies, such as batteries, enhance the reliability and stability of solar power by addressing intermittency issues. Innovations in smart grid technology facilitate the integration of solar energy into existing energy systems. Combining solar power with other renewable sources or storage solutions improves energy efficiency and reliability.

Restraint:

  • Perception of High Initial Investment Costs and Grid Capacity and Stability

Developing and constructing solar farms requires significant upfront investment, which can be a barrier for some developers and investors. Securing financing for large-scale solar projects can be difficult, especially in regions with underdeveloped financial markets or high perceived risks. Integrating large amounts of solar power into existing grids can strain infrastructure and require upgrades to accommodate variable generation. Solar farms are often located in remote areas with abundant sunlight, necessitating investment in transmission infrastructure to deliver power to demand centers.

Opportunity:

⮚     Energy Storage Integration

Advances in battery technology can enhance the reliability and stability of solar farms, enabling them to provide consistent power supply. Combining solar with other renewable energy sources, such as wind or biomass, can create hybrid systems that maximize energy generation and efficiency. Solar farms can play a key role in developing decentralized energy systems, providing reliable power to remote and off-grid communities. Community solar initiatives allow individuals and businesses to invest in shared solar farms, increasing accessibility and participation in renewable energy. Post-pandemic recovery plans focused on sustainability and green energy investments can boost solar farm development.

Solar Farm Market Segment Overview
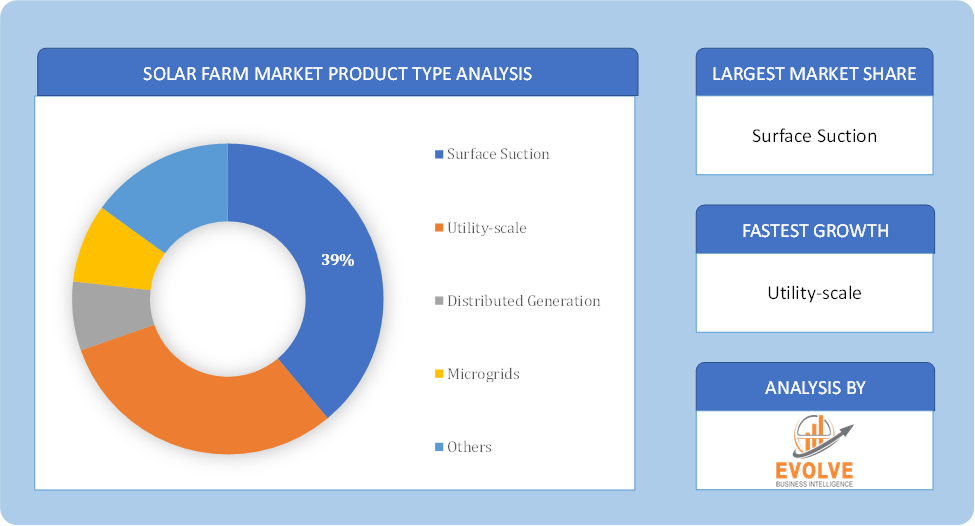
Solar Farm Market Product Type AnalysisBy Product Type

Based on Product Type, the market is segmented based on Surface Suction, Utility-scale, Distributed Generation, Microgrids and Others. The utility-scale segment dominant the market. The genuine scale of the undertaking and the amount of power these large-scale solar farms can generate sets them apart from more traditional photovoltaic alternatives. Either the utility company buys the power generated to sell to its customers through a power purchase agreement (PPA), or the utility company can own the farm itself. Utility companies can distribute the power to commercial or residential customers connected to their utility grid.

By Application

Based on Application, the market segment has been divided into Residential, Industrial, Commercial and Others. The commercial segment dominant the market. The shortage of electricity supply can be attributed to the expansion of economies worldwide and the growth of urban areas. The use of solar energy by commercial buildings such as offices, shopping malls, and airports, amongst others, helps to reduce the load on traditional fossil fuel power plants and further decreases the carbon footprint of these buildings. Because of the surge in solar photovoltaics, there has been an increase in the utilization of solar farms to produce electricity effectively.

Global Solar Farm Market Regional Analysis

Based on region, the global Solar Farm Market has been divided into North America, Europe, Asia-Pacific, the Middle East & Africa, and Latin America. North America is projected to dominate the use of the Solar Farm Market followed by the Asia-Pacific and Europe regions.
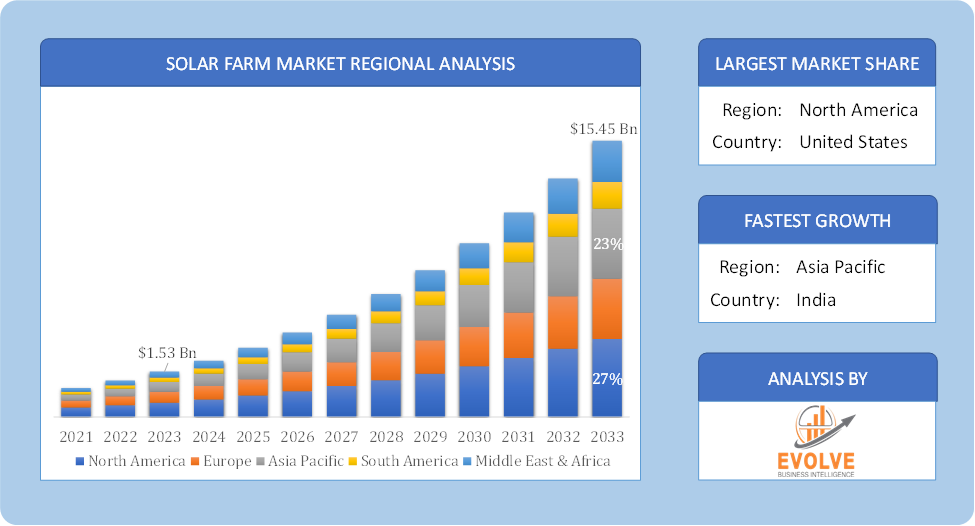
Global Solar Farm Market Regional AnalysisSolar Farm North America Market

North America holds a dominant position in the Solar Farm Market. The North American solar farm market is anticipated to be the second-largest globally. Here, the growth is driven by increasing demand for solar panels for electricity generation and distribution of solar lighting systems, particularly in rural regions. The United States is a key market in this region, with California leading the charge in solar farm development.

Solar Farm Asia-Pacific Market

The Asia-Pacific region has indeed emerged as the fastest-growing market for the Solar Farm Market industry. Asia-Pacific region is currently the dominant player in the solar farm market, accounting for the largest market share and experiencing a high compound annual growth rate (CAGR). This growth is driven by factors like government initiatives promoting solar power adoption, electrification of rural areas, and rising consumer interest in clean energy solutions. China is a major force in this region, with substantial government support for solar farm projects. India is another promising market, expected to witness the fastest growth rate in the coming years due to ambitious renewable energy targets.

Competitive Landscape

The global Solar Farm Market is highly competitive, with numerous players offering a wide range of software solutions. The competitive landscape is characterized by the presence of established companies, as well as emerging startups and niche players. To increase their market position and attract a wide consumer base, the businesses are employing various strategies, such as product launches, and strategic alliances.

Prominent Players:

  • Sharp Corporation
  • TATA Power Solar Systems Ltd.
  • First Solar
  • BrightSource Energy Inc
  • Shenzhen Topray Solar Co.
  • JA Solar Holdings Co. Ltd.
  • Wuxi Suntech Power Co. Ltd.
  • Himin Solar Energy Group
  • GRUPPOSTG
  • Trina Solar

Key Development

In June 2023, the US Environmental Protection Agency (EPA) launched a $7.0 billion grant competition as part of President Biden’s Investing in America initiative to boost access to affordable, resilient, and clean solar energy for millions of low-income homes. Residential distributed solar energy would reduce family energy costs, provide high-quality jobs in underserved places, promote environmental justice, and address the climate issue. The Solar for All competition, created by the Inflation Reduction Act’s Greenhouse Gas Reduction Fund (GGRF), will expand the number of low-income and disadvantaged communities primed for residential solar investment by awarding up to 60 grants to states, territories, Tribal governments, municipalities, and eligible nonprofits to create and expand low-income solar programs that provide financing and technical assistance.

Scope of the Report

Global Solar Farm Market, by Product Type
  • Surface Suction
  • Utility-scale
  • Distributed Generation
  • Microgrids
  • Others
Global Solar Farm Market, by Application
  • Residential
  • Industrial
  • Commercial
  • Others
Global Solar Farm Market, by Region
  • North America
    • US
    • Canada
    • Mexico
  • Europe
    • UK
    • Germany
    • France
    • Italy
    • Spain
    • Benelux
    • Nordic
    • Rest of Europe
  • Asia Pacific
    • China
    • Japan
    • South Korea
    • Indonesia
    • Austalia
    • Malaysia
    • India
    • Rest of Asia Pacific
  • South America
    • Brazil
    • Argentina
    • Rest of South America
  • Middle East & Africa
    • Saudi Arabia
    • UAE
    • Egypt
    • South Africa
    • Rest of Middle East & Africa


Parameters Indicators
Market Size 2033: USD 15.45 Billion
CAGR (2023-2033) 18.54%
Base year 2022
Forecast Period 2023-2033
Historical Data 2021 (2017 to 2020 On Demand)
Report Coverage Revenue Forecast, Competitive Landscape, Growth Factors, and Trends
Key Segmentations Product Type, Application
Geographies Covered North America, Europe, Asia-Pacific, South America, Middle East, Africa
Key Vendors Sharp Corporation, TATA Power Solar Systems Ltd., First Solar, BrightSource Energy Inc, Shenzhen Topray Solar Co., JA Solar Holdings Co. Ltd., Wuxi Suntech Power Co. Ltd., Himin Solar Energy Group, GRUPPOSTG and Trina Solar.
Key Market Opportunities ·       Energy Storage Integration

·       Decentralized and Distributed Energy Systems

Key Market Drivers ·       Increasing Demand for Renewable Energy

·       Technological Innovations


REPORT CONTENT BRIEF:

  • High-level analysis of the current and future Solar Farm Market trends and opportunities
  • Detailed analysis of current market drivers, restraining factors, and opportunities in the future
  • Solar Farm Market historical market size for the year 2021, and forecast from 2023 to 2033
  • Solar Farm Market share analysis at each product level
  • Competitor analysis with detailed insight into its product segment, Government & Defense strength, and strategies adopted.
  • Identifies key strategies adopted including product launches and developments, mergers and acquisitions, joint ventures, collaborations, and partnerships as well as funding taken and investment done, among others.
  • To identify and understand the various factors involved in the global Solar Farm Market affected by the pandemic
  • To provide a detailed insight into the major companies operating in the market. The profiling will include the Government & Defense health of the company’s past 2-3 years with segmental and regional revenue breakup, product offering, recent developments, SWOT analysis, and key strategies.

Frequently Asked Questions (FAQ)

What is the study period of this market?

The study period of the global Solar Farm Market is 2021- 2033

What is the growth rate of the global Solar Farm Market?

The global Solar Farm Market is growing at a CAGR of 4.41% over the next 10 years

Which region has the highest growth rate in the market of Solar Farm Market?

Asia Pacific is expected to register the highest CAGR during 2023-2033

Which region has the largest share of the global Solar Farm Market?

North America holds the largest share in 2022

Who are the key players in the global Solar Farm Market?

Sharp Corporation, TATA Power Solar Systems Ltd., First Solar, BrightSource Energy Inc, Shenzhen Topray Solar Co., JA Solar Holdings Co. Ltd., Wuxi Suntech Power Co. Ltd., Himin Solar Energy Group, GRUPPOSTG and Trina Solar are the major companies operating in the market.

Do you offer Post Sale Support?

Yes, we offer 16 hours of analyst support to solve the queries

Do you sell particular sections of a report?

Yes, we provide regional as well as country-level reports. Other than this we also provide a sectional report. Please get in contact with our sales representatives.

For more details mail us at

[email protected]

Ask a question / additional requirement

Press Release

  • Glue Stick Market to Reach USD 2.35 Billion by 2034

    Glue Stick Market to Reach USD 2.35 Billion by 2034

    April 27, 2025

  • Podiatry Service Market to Reach USD 11.88 Billion by 2034

    Podiatry Service Market to Reach USD 11.88 Billion by 2034

    April 24, 2025

  • Microfluidics Technology Market to Reach USD 32.58 Billion by 2034

    Microfluidics Technology Market to Reach USD 32.58 Billion by 2034

    April 24, 2025

  • Ferric Chloride Market to Reach USD 10.65 Billion by 2034

    Ferric Chloride Market to Reach USD 10.65 Billion by 2034

    April 23, 2025

  • Family Practice EMR Software Market to Reach USD 21.52 Billion by 2034

    Family Practice EMR Software Market to Reach USD 21.52 Billion by 2034

    April 23, 2025

  • Electric Hairbrush Market to Reach USD 15.95 Billion by 2034

    Electric Hairbrush Market to Reach USD 15.95 Billion by 2034

    April 23, 2025

  • Daily Bamboo Products Market to Reach USD 143.52 Billion by 2034

    Daily Bamboo Products Market to Reach USD 143.52 Billion by 2034

    April 22, 2025

  • Cross-border E-commerce Logistics Market to Reach USD 112.65 Billion by 2034

    Cross-border E-commerce Logistics Market to Reach USD 112.65 Billion by 2034

    April 22, 2025

  • Basic Silicone Market to Reach USD 28.74 Billion by 2034

    Basic Silicone Market to Reach USD 28.74 Billion by 2034

    April 21, 2025

  • Active Insulation Market to Reach USD 5.88 Billion by 2034

    Active Insulation Market to Reach USD 5.88 Billion by 2034

    April 21, 2025

Table of Content

Table of Content

Chapter 1.   Executive Summary

Chapter 2.   Scope Of The Study

                     2.1.   Market Definition

                     2.2.   Scope Of The Study

                               2.2.1.   Objectives of Report

                               2.2.2.   Limitations

                     2.3.   Market Structure

Chapter 3.   Evolve BI Methodology

Chapter 4.   Market Insights and Trends

                     4.1.   Supply/ Value Chain Analysis

                               4.1.1.   Raw End Users Providers

                               4.1.2.   Manufacturing Process

                               4.1.3.   Distributors/Retailers

                               4.1.4.   End-Use Industry

                     4.2.   Porter’s Five Forces Analysis

                               4.2.1.   Threat Of New Entrants

                               4.2.2.   Bargaining Power Of Buyers

                               4.2.3.   Bargaining Power Of Suppliers

                               4.2.4.   Threat Of Substitutes

                               4.2.5.   Industry Rivalry

                     4.3.   Impact Of COVID-19 on the Solar Farm Market

                               4.3.1.   Impact on Market Size

                               4.3.2.   End-Use Industry Trend, Preferences, and Budget Impact

                               4.3.3.   Regulatory Framework/Government Policies

                               4.3.4.   Key Players' Strategy to Tackle Negative Impact

                               4.3.5.   Opportunity Window

                     4.4.   Technology Overview

                     12.28.   Macro factor

                     4.6.   Micro Factor

                        4.7.   Demand Supply Gap Analysis of the Solar Farm Market

                        4.8.   Import Analysis of the Solar Farm Market

                        4.9.   Export Analysis of the Solar Farm Market

Chapter 5.   Market Dynamics

                     5.1.   Introduction

                     5.2.   DROC Analysis

                               5.2.1.   Drivers

                               5.2.2.   Restraints

                               5.2.3.   Opportunities

                               5.2.4.   Challenges

                     5.3.   Patent Analysis

                     5.4.   Industry Roadmap

                     5.5.   Parent/Peer Market Analysis

Chapter 6.   Global Solar Farm Market, By Product Type          

                     6.1.   Introduction

                     6.2.   Surface Suction

                     6.3.   Utility-scale

                     6.4.   Distributed Generation

                     6.5.   Microgrids

                     6.6.   Others

Chapter 7.   Global Solar Farm Market, By Application

                     7.1.   Introduction

                     7.2.   Residential

                     7.3.   Industrial

                   7.4.   Commercial

                   7.5.   Others

Chapter 8.   Global Solar Farm Market, By Region

                     8.1.   Introduction

                     8.2.   North America

                               8.2.1.   Introduction

                               8.2.2.   Driving Factors, Opportunity Analyzed, and Key Trends

                               8.2.3.   Market Size and Forecast, By Country, 2023-2033

                               8.2.4.   Market Size and Forecast, By Product Type, 2023-2033

                               8.2.5.   Market Size and Forecast, By End User, 2023-2033

                               8.2.6.   US

                                              8.2.6.1.   Introduction

                                              8.2.6.2.   Driving Factors, Opportunity Analyzed, and Key Trends

                                              8.2.6.3.   Market Size and Forecast, By Product Type, 2023-2033

                                              8.2.6.4.   Market Size and Forecast, By End User, 2023-2033

                               8.2.7.   Canada

                                              8.2.7.1.   Introduction

                                              8.2.7.2.   Driving Factors, Opportunity Analyzed, and Key Trends

                                              8.2.7.4.   Market Size and Forecast, By Product Type, 2023-2033

                                              8.2.7.5.   Market Size and Forecast, By End User, 2023-2033

                     8.3.   Europe

                               8.3.1.   Introduction

                               8.3.2.   Driving Factors, Opportunity Analyzed, and Key Trends

                               8.3.3.   Market Size and Forecast, By Country, 2023-2033

                               8.3.4.   Market Size and Forecast, By Product Type, 2023-2033

                               8.3.5.   Market Size and Forecast, By End User, 2023-2033

                               8.3.6.   Germany

                                              8.3.6.1.   Introduction

                                              8.3.6.2.   Driving Factors, Opportunity Analyzed, and Key Trends

                                              8.3.6.3.   Market Size and Forecast, By Product Type, 2023-2033

                                              8.3.6.4.   Market Size and Forecast, By End User, 2023-2033

                               8.3.7.   France

                                              8.3.7.1.   Introduction

                                              8.3.7.2.   Driving Factors, Opportunity Analyzed, and Key Trends

                                              8.3.7.3.   Market Size and Forecast, By Product Type, 2023-2033

                                              8.3.7.4.   Market Size and Forecast, By End User, 2023-2033

                               8.3.8.   UK

                                              8.3.8.1.   Introduction

                                              8.3.8.2.   Driving Factors, Opportunity Analyzed, and Key Trends

                                              8.3.8.3.   Market Size and Forecast, By Product Type, 2023-2033

                                              8.3.8.4.   Market Size and Forecast, By End User, 2023-2033

                               8.3.9.   Italy

                                              8.3.9.1.   Introduction

                                              8.3.9.2.   Driving Factors, Opportunity Analyzed, and Key Trends

                                              8.3.9.3.   Market Size and Forecast, By Product Type, 2023-2033

                                              8.3.9.4.   Market Size and Forecast, By End User, 2023-2033

                               8.3.11.   Rest Of Europe

                                              8.3.11.1.   Introduction

                                              8.3.11.2.   Driving Factors, Opportunity Analyzed, and Key Trends

                                              8.3.11.3.   Market Size and Forecast, By Product Type, 2023-2033

                                              8.3.11.4.   Market Size and Forecast, By End User, 2023-2033

                     8.4.   Asia-Pacific

                               8.4.1.   Introduction

                               8.4.2.   Driving Factors, Opportunity Analyzed, and Key Trends

                               8.4.3.   Market Size and Forecast, By Country, 2023-2033

                               8.4.4.   Market Size and Forecast, By Product Type, 2023-2033

                               8.12.28.   Market Size and Forecast, By End User, 2023-2033

                               8.4.6.   China

                                              8.4.6.1.   Introduction

                                              8.4.6.2.   Driving Factors, Opportunity Analyzed, and Key Trends

                                              8.4.6.3.   Market Size and Forecast, By Product Type, 2023-2033

                                              8.4.6.4.   Market Size and Forecast, By End User, 2023-2033

                               8.4.7.   India

                                              8.4.7.1.   Introduction

                                              8.4.7.2.   Driving Factors, Opportunity Analyzed, and Key Trends

                                              8.4.7.3.   Market Size and Forecast, By Product Type, 2023-2033

                                              8.4.7.4.   Market Size and Forecast, By End User, 2023-2033

                               8.4.8.   Japan

                                              8.4.8.1.   Introduction

                                              8.4.8.2.   Driving Factors, Opportunity Analyzed, and Key Trends

                                              8.4.8.3.   Market Size and Forecast, By Product Type, 2023-2033

                                              8.4.8.4.   Market Size and Forecast, By End User, 2023-2033

                               8.4.9.   South Korea

                                              8.4.9.1.   Introduction

                                              8.4.9.2.   Driving Factors, Opportunity Analyzed, and Key Trends

                                              8.4.9.3.   Market Size and Forecast, By Product Type, 2023-2033

                                              8.4.9.4.   Market Size and Forecast, By End User, 2023-2033

                               8.4.10.   Rest Of Asia-Pacific

                                              8.4.10.1.   Introduction

                                              8.4.10.2.   Driving Factors, Opportunity Analyzed, and Key Trends

                                              8.4.10.3.   Market Size and Forecast, By Product Type, 2023-2033

                                              8.4.10.4.   Market Size and Forecast, By End User, 2023-2033

                     8.5.   Rest Of The World (RoW)

                               8.5.1.   Introduction

                               8.5.2.   Driving Factors, Opportunity Analyzed, and Key Trends

                               8.5.3.   Market Size and Forecast, By Product Type, 2023-2033

                               8.5.4.   Market Size and Forecast, By End User, 2023-2033

Chapter 9.   Company Landscape

                     9.1.   Introduction

                     9.2.   Vendor Share Analysis

                     9.3.   Key Development Analysis

                     9.4.   Competitor Dashboard

Chapter 10.   Company Profiles

                     10.1.   Sharp Corporation

                               10.1.1.   Business Overview

                               10.1.2.   Government & Defense Analysis

                                              10.1.2.1.   Government & Defense – Existing/Funding

                               10.1.3.   Product Portfolio

                               10.1.4.   Recent Development and Strategies Adopted

                               10.1.5.   SWOT Analysis

                     10.2.   TATA Power Solar Systems Ltd.

                               10.2.1.   Business Overview

                               10.2.2.   Government & Defense Analysis

                                              10.2.2.1.   Government & Defense – Existing/Funding

                               10.2.3.   Product Portfolio

                               10.2.4.   Recent Development and Strategies Adopted

                               10.2.5.   SWOT Analysis

                     10.3.   First Solar

                               10.3.1.   Business Overview

                               10.3.2.   Government & Defense Analysis

                                              10.3.2.1.   Government & Defense – Existing/Funding

                               10.3.3.   Product Portfolio

                               10.3.4.   Recent Development and Strategies Adopted

                               10.3.5.   SWOT Analysis

                     10.4.   BrightSource Energy Inc

                               10.4.1.   Business Overview

                               10.4.2.   Government & Defense Analysis

                                              10.4.2.1.   Government & Defense – Existing/Funding

                               10.4.3.   Product Portfolio

                               10.4.4.   Recent Development and Strategies Adopted

                               10.12.28.   SWOT Analysis

                     10.5.   Shenzhen Topray Solar Co.

                               10.5.1.   Business Overview

                               10.5.2.   Government & Defense Analysis

                                              10.5.2.1.   Government & Defense – Existing/Funding

                               10.5.3.   Product Portfolio

                               10.5.4.   Recent Development and Strategies Adopted

                               10.5.5.   SWOT Analysis

                     10.6.   JA Solar Holdings Co. Ltd.

                               10.6.1.   Business Overview

                               10.6.2.   Government & Defense Analysis

                                              10.6.2.1.   Government & Defense – Existing/Funding

                               10.6.3.   Product Portfolio

                               10.6.4.   Recent Development and Strategies Adopted

                               10.6.5.   SWOT Analysis

                     10.7.   Wuxi Suntech Power Co. Ltd.

                               10.7.1.   Business Overview

                               10.7.2.   Government & Defense Analysis

                                              10.7.2.1.   Government & Defense – Existing/Funding

                               10.7.3.   Product Portfolio

                               10.7.4.   Recent Development and Strategies Adopted

                               10.7.5.   SWOT Analysis

                     10.8   Himin Solar Energy Group

                               10.8.1.   Business Overview

                               10.8.2.   Government & Defense Analysis

                                              10.8.2.1.   Government & Defense – Existing/Funding

                               10.8.3.   Product Portfolio

                               10.8.4.   Recent Development and Strategies Adopted

                               10.8.5.   SWOT Analysis

                     10.9   GRUPPOSTG

                               10.9.1.   Business Overview

                               10.9.2.   Government & Defense Analysis

                                              10.9.2.1.   Government & Defense – Existing/Funding

                               10.9.3.   Product Portfolio

                               10.9.4.   Recent Development and Strategies Adopted

                               10.9.5.   SWOT Analysis

                     10.10.   Trina Solar

                               10.10.1.   Business Overview

                               10.10.2.   Government & Defense Analysis

                                              10.10.2.1.   Government & Defense – Existing/Funding

                               10.10.3.   Product Portfolio

                               10.10.4.   Recent Development and Strategies Adopted

                               10.10.5.   SWOT Analysis


Connect to Analyst

Connect to Analyst

Research Methodology

Research Methodology

Our Most Viewed Report and gain instant expertise

Energy and Power
$ 3,470.00
$ 5,520.00
$ 1,390.00
Clear

Energy as a Service Market Analysis and Global Forecast 2023-2033

$ 1,390.00 – $ 5,520.00
Energy as a Service Market Research Report: Information By Service Type (Energy Supply Services, Operational and Maintenance Services, Energy Efficiency and Optimization Services, Others), By End-Users (Commercial, Industrial, Others), and by Region — Forecast till 2033
Page: 157
Select options This product has multiple variants. The options may be chosen on the product page
Quick view
Energy and Power
$ 3,470.00
$ 5,520.00
$ 1,390.00
Clear

Energy Storage Market Analysis and Global Forecast 2023-2033

$ 1,390.00 – $ 5,520.00
Energy Storage Market Research Report: Information By Type (Batteries, Pumped-storage Hydroelectricity (PSH), Thermal Energy Storage (TES), Flywheel Energy Storage (FES), Others), By Application (Residential, Commercial and Industrial), and by Region — Forecast till 2033 Page: 162
Select options This product has multiple variants. The options may be chosen on the product page
Quick view
$ 3,470.00
$ 5,520.00
$ 1,390.00
Clear

Global Hydropower Market Analysis and Global Forecast 2023-2033

$ 1,390.00 – $ 5,520.00
Global Hydropower Market Research Report: Information By Capacity (Small Hydropower, Large Hydropower, and Others), By Application (Residential, Commercial and Industrial), and by Region — Forecast till 2033 Page: 141
Select options This product has multiple variants. The options may be chosen on the product page
Quick view
Energy and Power
$ 3,470.00
$ 5,520.00
$ 1,390.00
Clear

High Voltage Capacitor Market Analysis and Global Forecast 2023-2033

$ 1,390.00 – $ 5,520.00
High Voltage Capacitor Market Research Report: Information By Type (Plastic Film, Ceramic, Electrolytic, and Others), By Capacity (500-1,000V, 1001-7000V, 7,001-14,000V, and Above 14,000V), By Application (Power Generation, Transmission, Distribution, and Others), and by Region — Forecast till 2033 Page: 134
Select options This product has multiple variants. The options may be chosen on the product page
Quick view
Energy and Power
$ 3,470.00
$ 5,520.00
$ 1,390.00
Clear

Hybrid Train Market Analysis and Global Forecast 2023-2033

$ 1,390.00 – $ 5,520.00
Hybrid Train Market Research Report: Information By Propulsion Type (Electro Diesel, Battery Operated, Hydrogen, CNG, LPG, Others), By Operational Speed (Below 100 km/h, 100-200 km/h, Above 200 km/h), By Application (Freight, Passenger, Others), By Battery Technology (Gel Tubular, Valve Regulated Lead-Acid, Conventional Lead-Acid, Sinter PNE, Fiber PNE, Pocket Plate, Lithium-Ion, Others), and by Region — Forecast till 2033
Page: 174
Select options This product has multiple variants. The options may be chosen on the product page
Quick view
Energy and Power
$ 3,470.00
$ 5,520.00
$ 1,390.00
Clear

Hydrogen Energy Storage Market Analysis and Global Forecast 2023-2033

$ 1,390.00 – $ 5,520.00
Hydrogen Energy Storage Market Research Report: Information By Storage Technology (Compression, Liquefaction, Material Based), By State (Liquid, Gas, Solid), By End User (Industrial, Commercial, Utilities), and by Region — Forecast till 2033 Page: 156
Select options This product has multiple variants. The options may be chosen on the product page
Quick view
$ 3,470.00
$ 5,520.00
$ 1,390.00
Clear

Nuclear Power Plant Market Analysis and Global Forecast 2023-2033

$ 1,390.00 – $ 5,520.00
Nuclear Power Plant Market Research Report: Information By Product (High Temperature Gas-Cooled Reactor, Pressurized Water Reactor, Boiling Water Reactor, Pressurized Heavy Water Reactor and Others), By Application (Island Equipment and Auxiliary Equipment), and by Region — Forecast till 2033.
Select options This product has multiple variants. The options may be chosen on the product page
Quick view
Energy and Power
$ 3,470.00
$ 5,520.00
$ 1,390.00
Clear

Well Intervention Market Analysis and Global Forecast 2023-2033

$ 1,390.00 – $ 5,520.00

Well Intervention Market Research Report: By well Type (Vertical Well, Horizontal Well), By Intervention Type (Light Intervention, Medium Intervention, Heavy Intervention), By Application (Onshore , Offshore), By services (Coiled Tubing , Slickline , Wireline Case Intervention, Thru Tube Intervention, Fishing Services, Sidetracking, Subsea Landing String Services), and by Region — Forecast till 2033.

Page: 169
Select options This product has multiple variants. The options may be chosen on the product page
Quick view

    Uncover Market Secrets: Get Market Insights in Your Inbox 🚀

    Join over 5,000 professionals staying ahead of industry trends. Subscribe to our weekly market research newsletter.

    Join our community of industry leaders and stay ahead of the curve. Subscribe now for data-driven market intelligence and strategic recommendations that will set your business on a path to success! Don't miss out on our FREE exclusive insights – sign up today and soar above your competition!🚀

    M/S Evolve Business Intelligence C-218, 2nd floor, M-Cube, N.H. – 48, Balitha, Vapi, Valsad- Gujarat
    Email: [email protected]

    Email: [email protected]

    • Important Links
      • About Evolvebi
      • Competitive Intelligence
      • Become a reseller
      • Contact Us
    • Top Search By Countries Hot
      • United State
      • Europe
      • Asia Pacific
      • Middle East & Africa
      • Latin America

    © 2024 Evolve Business Intelligence. All rights reserved. Developed by Nectron

    Privacy Policy | Terms and Conditions | Cancellation and Refund policy

    cards
    • Home
    • About Us
    • Services
    • Market Research Report
      • Automotive Market Report
        • Automotive components
        • Vehicle Market Report
        • Chemical Automotive
        • Technology
        • Freight and Logistics market report
        • Material
        • Technology
        • Transport Mode
        • Utility
        • Vehicle Market Report
      • Chemical and Materials
        • Chemical
        • Advanced Materials
        • Coatings and Additives
        • Composites
        • Paints
        • Textile
      • Aerospace and Defence
        • Marine
        • Security
        • Technology
        • Aircraft Components
        • Aircraft Material
      • Construction & Manufacturing
      • Electronics and Semiconductor
        • Display Technology
        • Electronic Component
        • Electronic Devices
        • Semiconductor
        • Communication Equipment
        • Emerging Technologies
        • Security
        • Sensor & Control
        • Technology
      • Energy and Power
      • Life Science
      • Consumer and Goods
        • Baby products and supplies
        • Beauty & Personal Care
        • Consumer
        • Home Products
      • Information and Communication Technology
        • Emerging Technologies
        • Entertainment Technologies
        • Security
        • Communication
        • Data Center
        • Data Center and Networking
        • Software and Services
        • Technology
    • Competitive Intelligence (CI)
      • Automotive (CI)
      • Chemical and Materials (CI)
      • Construction & Manufacturing (CI)
      • Energy and Power (CI)
      • Electronics and Semiconductor (CI)
      • Healthcare (CI)
      • Information and Communication Technology ICT (CI)
    • Contact Us
    We use cookies to improve your experience on our website. By browsing this website, you agree to our use of cookies.
    More info More info Accept
    Energy and Power

    Solar Farm Market Analysis and Global Forecast 2023-2033

    $ 1,390.00 – $ 5,520.00 Select options
    I allow the Site owner to contact me via email/phone to discuss this enquiry. (If you want to know more about the way this site handles the data, then please go through our privacy policy).

    Sending...

    Go to mobile version