Optical Communication and Networking Equipment Market Analysis and Global Forecast 2023-2033

$ 1,390.00$ 5,520.00

Optical Communication and Networking Equipment Market Research Report: Information By Component (Optical Fibers, Optical Transceivers, Optical Amplifiers, Optical Switches, Optical Splitters, Optical Circulators, Optical Sensors, Others), By Technology (WDM, CWDM, DWDM, SONET), By Vertical (BFSI, Government, Healthcare, Others), By Application (Telecom, Data Centre, Enterprise), and by Region — Forecast till 2033

Page: 158

Report Published on: October 25, 2024
$ 3,470.00
$ 5,520.00
$ 1,390.00
Report Code: EBI66966 Categories: ,
Description

Optical Communication and Networking Equipment Market Overview

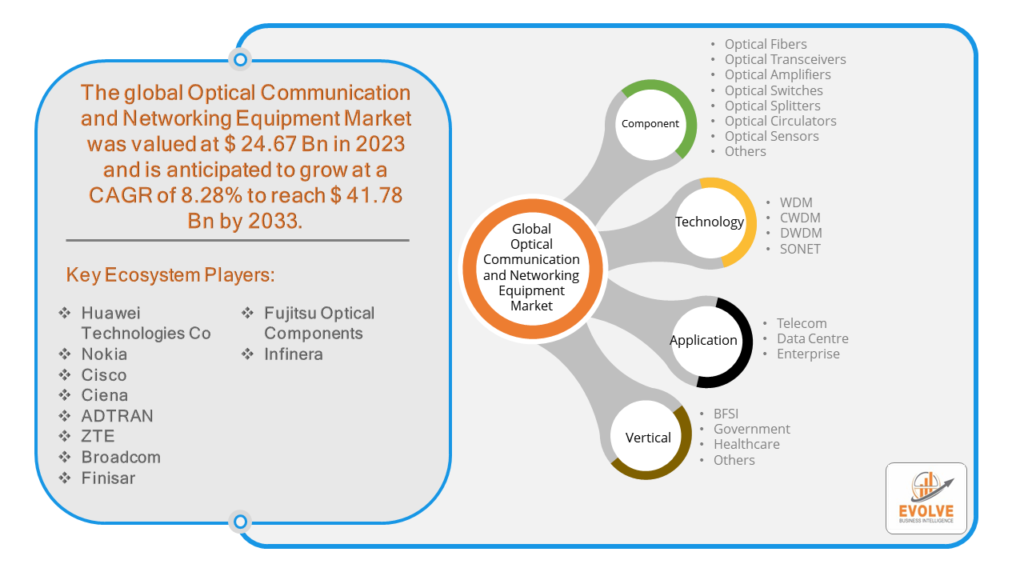
The Optical Communication and Networking Equipment Market Size is expected to reach USD 41.78 Billion by 2033. The Optical Communication and Networking Equipment Market industry size accounted for USD 24.67 Billion in 2023 and is expected to expand at a compound annual growth rate (CAGR) of 8.28% from 2023 to 2033. The Optical Communication and Networking Equipment Market refers to the industry segment involved in the manufacturing, distribution, and sales of devices and systems used for transmitting information over optical fibers. This market encompasses a variety of products and technologies designed to facilitate high-speed, long-distance communication through light signals.

The Optical Communication and Networking Equipment Market is a critical component of modern communication infrastructure, enabling high-speed, high-capacity data transmission across various industries and applications.

Global Optical Communication and Networking Equipment Market Synopsis

Optical Communication and Networking Equipment MarketCOVID-19 Impact Analysis

The COVID-19 pandemic had a significant impact on the Optical Communication and Networking Equipment Market. With lockdowns and social distancing measures in place, there was a massive increase in internet usage as people worked from home, attended online classes, and relied on digital entertainment. This drove demand for high-speed and reliable internet connections, boosting the need for optical communication and networking equipment. The shift to remote work and the increased use of video conferencing and other online collaboration tools required robust and high-capacity networking infrastructure, further propelling demand for optical communication solutions. The pandemic caused disruptions in manufacturing processes due to lockdowns, social distancing measures, and workforce shortages. This affected the production of optical communication and networking equipment. Restrictions on movement and transportation led to delays in the supply chain, affecting the timely delivery of components and finished products. The pandemic underscored the need for resilient and high-capacity communication networks, accelerating the deployment of 5G infrastructure, which relies heavily on optical communication technology.

Optical Communication and Networking Equipment Market Dynamics

The major factors that have impacted the growth of Optical Communication and Networking Equipment Market are as follows:

Drivers:

Technological Advancements

Continuous advancements in technology are enabling the development of high-speed optical networks, such as 100G, 400G, and beyond. These advancements are crucial for meeting the growing demand for faster data transmission rates. The adoption of WDM technology, which allows multiple signals to be transmitted simultaneously on a single optical fiber by using different wavelengths, is driving the market. WDM significantly increases the capacity and efficiency of optical networks. Innovations in optical amplifiers, such as Erbium-Doped Fiber Amplifiers (EDFAs), are enhancing the performance of optical communication systems by boosting signal strength without the need for electrical conversion. Advances in manufacturing processes and economies of scale are reducing the cost of optical communication equipment, making it more accessible to a broader range of users. Additionally, the higher efficiency and lower operational costs of optical networks compared to traditional copper-based networks are driving adoption.

Restraint:

  • Perception of High Initial Investment

The deployment of optical communication networks requires substantial capital investment in infrastructure, including fiber optic cables, transceivers, amplifiers, and other equipment. This high initial cost can be a significant barrier for some organizations. While optical networks are efficient, they can also involve high operational costs, including maintenance, upgrades, and energy consumption, which can be a constraint for some enterprises.

Opportunity:

⮚      Growing demand for 5G and Beyond

The deployment of 5G networks and the development of future communication standards (6G) present significant opportunities. These networks require high-capacity, low-latency backhaul and fronthaul solutions that optical communication equipment can provide. The exponential growth of data centers to support cloud services, big data, and AI applications drives demand for high-speed optical communication equipment. This trend offers substantial market growth opportunities. The ongoing digital transformation across industries, driven by the need for increased efficiency, productivity, and connectivity, creates opportunities for optical communication equipment in various sectors, including manufacturing, finance, and education.

Optical Communication and Networking Equipment Market Segment Overview

By Component
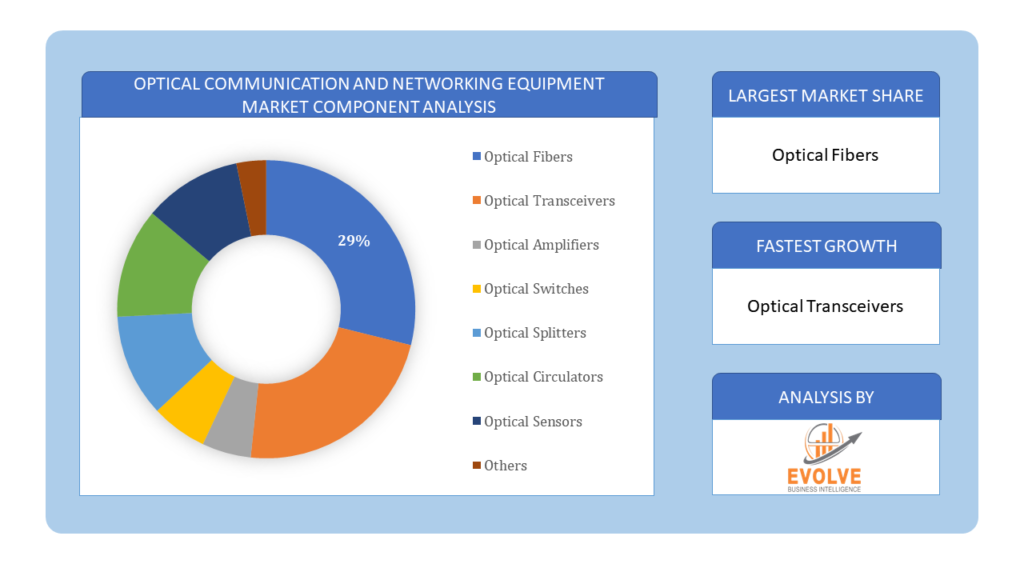
Optical Communication and Networking Equipment MarketBased on Component, the market is segmented based on Optical Fibers, Optical Transceivers, Optical Amplifiers, Optical Switches, Optical Splitters, Optical Circulators, Optical Sensors and Others. The optical transceivers segment dominated the market. This expansion is primarily attributed to the adoption of technological advances like artificial intelligence (AI), machine learning, and 5G connectivity, resulting in increased data traffic and a corresponding demand for massive data centers. As many people access the internet via smartphones and other connected devices and cloud computing spreads as a standard form of IT deployment, data centers become increasingly necessary.

By Technology

Based on Technology, the market segment has been divided into the WDM, CWDM, DWDM, SONET. The WDM segment dominant the market. The wavelength division multiplexing generates the maximum revenue due to the rising use of high-speed internet. Additionally, the optical communication and networking equipment market is increasing owing to the growing use of connected devices in residential and commercial structures.

By Application

Based on Application, the market segment has been divided into the Telecom, Data Centre and Enterprise. The Data Centre segment dominant the market. Increasing adoption of cloud based system, growing deployment of high speed network connectivity and rapidly increasing data traffic due to higher usage of smartphone and other network connected device are driving optical communication and network equipment market growth.

By Vertical

Based on Vertical, the market segment has been divided into the BFSI, Government, Healthcare and Others. The BFSI segment dominant the market. The BFSI category generated the most income due to the rising demand for high-speed data transfer capabilities that enable fast and efficient access to critical data.

Global Optical Communication and Networking Equipment Market Regional Analysis

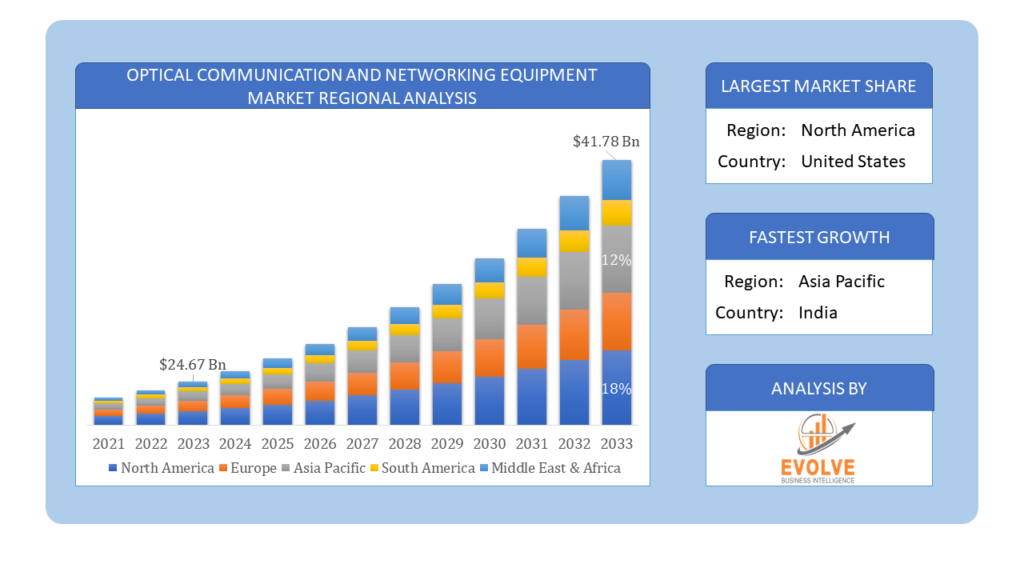
Based on region, the global Optical Communication and Networking Equipment Market has been divided into North America, Europe, Asia-Pacific, the Middle East & Africa, and Latin America. North America is projected to dominate the use of the Optical Communication and Networking Equipment Market followed by the Asia-Pacific and Europe regions.

Global Optical Communication and Networking Equipment Market Regional AnalysisOptical Communication and Networking Equipment North America Market

North America holds a dominant position in the Optical Communication and Networking Equipment Market. The North American market for optical communication and networking equipment is expected to grow at a steady pace over the next few years. The growth in this region is being driven by factors such as the increasing demand for bandwidth, the growth of cloud computing, and the expansion of data centers. Early adoption of 5G and emphasis on upgrading existing communication infrastructure.

Optical Communication and Networking Equipment Asia-Pacific Market

The Asia-Pacific region has indeed emerged as the fastest-growing market for the Optical Communication and Networking Equipment Market industry. Due to a number of factors, including the growing economies of China and India, the increasing adoption of cloud computing, and the expansion of data centers. The growth in this region is being driven by factors such as the increasing demand for bandwidth, the growth of cloud computing, and the expansion of data centers.

Competitive Landscape

The global Optical Communication and Networking Equipment Market is highly competitive, with numerous players offering a wide range of software solutions. The competitive landscape is characterized by the presence of established companies, as well as emerging startups and niche players. To increase their market position and attract a wide consumer base, the businesses are employing various strategies, such as product launches, and strategic alliances.

Prominent Players:

  • Huawei Technologies Co
  • Nokia
  • Cisco
  • Ciena
  • ADTRAN
  • ZTE
  • Broadcom
  • Finisar
  • Fujitsu Optical Components
  • Infinera

Key Development

In February 2023, Cisco Systems Inc., a digital technology company, declared that it had joined hands with V.tal to quicken the delivery of 5G services. V.tal is a Brazil-based end-to-end fiber optic neutral network company and owns the largest infrastructure in the country, with over 450,000 Km of terrestrial optical fiber connecting more than 2,380 municipalities.

Scope of the Report

Global Optical Communication and Networking Equipment Market, by Component
  • Optical Fibers
  • Optical Transceivers
  • Optical Amplifiers
  • Optical Switches
  • Optical Splitters
  • Optical Circulators
  • Optical Sensors
  • Others
Global Optical Communication and Networking Equipment Market, by Technology
  • WDM
  • CWDM
  • DWDM
  • SONET
Global Optical Communication and Networking Equipment Market, by Application
  • Telecom
  • Data Centre
  • Enterprise
Global Optical Communication and Networking Equipment Market, by Vertical
  • BFSI
  • Government
  • Healthcare
  • Others
Global Optical Communication and Networking Equipment Market, by Region
  • North America
    • US
    • Canada
    • Mexico
  • Europe
    • UK
    • Germany
    • France
    • Italy
    • Spain
    • Benelux
    • Nordic
    • Rest of Europe
  • Asia Pacific
    • China
    • Japan
    • South Korea
    • Indonesia
    • Austalia
    • Malaysia
    • India
    • Rest of Asia Pacific
  • South America
    • Brazil
    • Argentina
    • Rest of South America
  • Middle East & Africa
    • Saudi Arabia
    • UAE
    • Egypt
    • South Africa
    • Rest of Middle East & Africa


Parameters Indicators
Market Size 2033: $41.78 Billion
CAGR 8.28% CAGR (2023-2033)
Base year 2022
Forecast Period 2023-2033
Historical Data 2021
Report Coverage Revenue Forecast, Competitive Landscape, Growth Factors, and Trends
Key Segmentations Component, Technology, Application, Vertical
Geographies Covered North America, Europe, Asia-Pacific, Latin America, Middle East, Africa
Key Vendors Huawei Technologies Co, Nokia, Cisco, Ciena, ADTRAN, ZTE, Broadcom, Finisar, Fujitsu Optical Components and Infinera.
Key Market Opportunities • Growing demand for 5G and Beyond
• Growing Data Center Demand
Key Market Drivers • Technological Advancements
• Cost Reduction and Efficiency


REPORT CONTENT BRIEF:

  • High-level analysis of the current and future Optical Communication and Networking Equipment Market trends and opportunities
  • Detailed analysis of current market drivers, restraining factors, and opportunities in the future
  • Optical Communication and Networking Equipment Market historical market size for the year 2021, and forecast from 2023 to 2033
  • Optical Communication and Networking Equipment Market share analysis at each product level
  • Competitor analysis with detailed insight into its product segment, Government & Defense strength, and strategies adopted.
  • Identifies key strategies adopted including product launches and developments, mergers and acquisitions, joint ventures, collaborations, and partnerships as well as funding taken and investment done, among others.
  • To identify and understand the various factors involved in the global Optical Communication and Networking Equipment Market affected by the pandemic
  • To provide a detailed insight into the major companies operating in the market. The profiling will include the Government & Defense health of the company’s past 2-3 years with segmental and regional revenue breakup, product offering, recent developments, SWOT analysis, and key strategies.

For more details mail us at

Ask a question / additional requirement

Frequently Asked Questions (FAQ)

  • The global Optical Communication and Networking Equipment Market is growing at a CAGR of 8.28% over the next 10 years

Huawei Technologies Co, Nokia, Cisco, Ciena, ADTRAN, ZTE, Broadcom, Finisar, Fujitsu Optical Components and Infinera. are the major companies operating in the market

  • Yes, we offer 16 hours of analyst support to solve the queries

Yes, we provide regional as well as country-level reports. Other than this we also provide a sectional report. Please get in contact with our sales representatives

Table of Content

Table of Content

CHAPTER 1.           Executive Summary

CHAPTER 2.           Scope of the Study

2.1.        Market Definition

2.2.        Market Scope & Segmentation

2.2.1.         Objective of Report

CHAPTER 3.           Evolve BI Methodology

3.1.        Data Collection & Validation Approach

3.2.        Market Size Estimation and Forecast

CHAPTER 4.           Exclusive Analysis

4.1.        Market Opportunity Score

4.1.1.         Component Segement – Market Opportunity Score

4.1.2.         Technology Segment – Market Opportunity Score

4.1.3.         Application Segment – Market Opportunity Score

4.1.4.         Vertical  Segment – Market Opportunity Score

4.2.        Key Market Influencing Indicators

CHAPTER 5.           Market Insights and Trends

5.1.        Value Chain Analysis

5.1.1.         Raw Material

5.1.2.         Manufacturing Process

5.1.3.         Distribution Channel

5.1.4.         End Users

5.2.        Porter’s Five Forces Analysis

5.2.1.         Bargaining Power of Buyers

5.2.2.         Bargaining Power of Suppliers

5.2.3.         Threat of New Entrant

5.2.4.         Threat of Substitute

5.2.5.         Industry Rivalry

5.3.        COVID-19 Impact and Post COVID Scenario on Optical Communication and Networking Equipment Market

5.3.1.         Impact of COVID-19

5.3.2.         Government Support and Industry Revival Policies

5.3.3.         Measures Taken by Companies to Mitigate Negative Impact

5.3.4.         Post COVID Trend

CHAPTER 6.           MArket Dynamics

6.1.        Introduction

6.2.        Drivers

6.2.1.         Driver 1

6.2.2.         Driver 2

6.2.3.         Driver 3

6.3.        Restraints

6.3.1.         Restraint 1

6.3.2.         Restraint 2

6.4.        Opportunity

6.4.1.         Opportunity 1

CHAPTER 7.           Optical Communication and Networking Equipment Market, By Component

7.1.        Introduction

7.1.1.   Optical Fibers

7.1.2.   Optical Transceivers

7.1.3.   Optical Amplifiers

7.1.4.   Optical Switches

7.1.5.   Optical Splitters

7.1.6.   Optical Circulators

7.1.7.   Optical Sensors

7.1.8.    Others

CHAPTER 8.           Optical Communication and Networking Equipment Market, By Technology

8.1.                           Introduction

8.1.1. WDM

8.1.2. CWDM

8.1.3.  DWDM

8.1.4.   SONET

CHAPTER 9.           Optical Communication and Networking Equipment Market, By Application

9.1.        Introduction

9.1.1. Telecom

9.1.2. Data Centre

9.1.3.   Enterprise

CHAPTER 10.        Optical Communication and Networking Equipment Market, By Vertical

10.1.Introduction

10.1.1. BFSI

10.1.2. Government

10.1.3.  Healthcare

10.1.4.   Others

sCHAPTER 11.      Optical Communication and Networking Equipment Market, By Region

11.1.     Introduction

11.2.     NORTH AMERICA

11.2.1.      North America: Market Size and Forecast, By Country, 2023 – 2033 ($ Million)

11.2.2.      North America: Market Size and Forecast, By Component, 2023 – 2033 ($ Million)

11.2.3.      North America: Market Size and Forecast, By Technology, 2023 – 2033 ($ Million)

11.2.4.      North America: Market Size and Forecast, By Application, 2023 – 2033 ($ Million)

11.2.5.      North America: Market Size and Forecast, By Vertical, 2023 – 2033 ($ Million)

11.2.6.      US

11.2.6.1.       US: Market Size and Forecast, By Component, 2023 – 2033 ($ Million)

11.2.6.2.       US: Market Size and Forecast, By Technology, 2023 – 2033 ($ Million)

11.2.6.3.       US: Market Size and Forecast, By Application, 2023 – 2033 ($ Million)

11.2.6.4.       US: Market Size and Forecast, By Vertical, 2023 – 2033 ($ Million)

11.2.7.      CANADA

11.2.7.1.       Canada: Market Size and Forecast, By Component, 2023 – 2033 ($ Million)

11.2.7.2.       Canada: Market Size and Forecast, By Technology, 2023 – 2033 ($ Million)

11.2.7.3.       Canada: Market Size and Forecast, By Application, 2023 – 2033 ($ Million)

11.2.7.4.       Canada: Market Size and Forecast, By Vertical, 2023 – 2033 ($ Million)

11.2.8.      MEXICO

11.2.8.1.       Mexico: Market Size and Forecast, By Component, 2023 – 2033 ($ Million)

11.2.8.2.       Mexico: Market Size and Forecast, By Technology, 2023 – 2033 ($ Million)

11.2.8.3.       Mexico: Market Size and Forecast, By Application, 2023 – 2033 ($ Million)

11.2.8.4.       Mexico: Market Size and Forecast, By Vertical, 2023 – 2033 ($ Million)

11.3.     Europe

11.3.1.      Europe: Market Size and Forecast, By Country, 2023 – 2033 ($ Million)

11.3.2.      Europe: Market Size and Forecast, By Component, 2023 – 2033 ($ Million)

11.3.3.      Europe: Market Size and Forecast, By Technology, 2023 – 2033 ($ Million)

11.3.4.      Europe: Market Size and Forecast, By Application, 2023 – 2033 ($ Million)

11.3.5.      Europe: Market Size and Forecast, By Vertical, 2023 – 2033 ($ Million)

11.3.6.      U.K.

11.3.6.1.       U.K.: Market Size and Forecast, By Component, 2023 – 2033 ($ Million)

11.3.6.2.       U.K.: Market Size and Forecast, By Technology, 2023 – 2033 ($ Million)

11.3.6.3.       U.K.: Market Size and Forecast, By Application, 2023 – 2033 ($ Million)

11.3.6.4.       U.K.: Market Size and Forecast, By Vertical, 2023 – 2033 ($ Million)

11.3.7.      GERMANY

11.3.7.1.       Germany: Market Size and Forecast, By Component, 2023 – 2033 ($ Million)

11.3.7.2.       Germany: Market Size and Forecast, By Technology, 2023 – 2033 ($ Million)

11.3.7.3.       Germany: Market Size and Forecast, By Application, 2023 – 2033 ($ Million)

11.3.7.4.       Germany: Market Size and Forecast, By Vertical, 2023 – 2033 ($ Million)

11.3.8.      FRANCE

11.3.8.1.       France: Market Size and Forecast, By Component, 2023 – 2033 ($ Million)

11.3.8.2.       France: Market Size and Forecast, By Technology, 2023 – 2033 ($ Million)

11.3.8.3.       France: Market Size and Forecast, By Application, 2023 – 2033 ($ Million)

11.3.8.4.       France: Market Size and Forecast, By Vertical, 2023 – 2033 ($ Million)

11.3.9.      ITALY

11.3.9.1.       Italy: Market Size and Forecast, By Component, 2023 – 2033 ($ Million)

11.3.9.2.       Italy: Market Size and Forecast, By Technology, 2023 – 2033 ($ Million)

11.3.9.3.       Italy: Market Size and Forecast, By Application, 2023 – 2033 ($ Million)

11.3.9.4.       Italy: Market Size and Forecast, By Vertical, 2023 – 2033 ($ Million)

11.3.10.         SPAIN

11.3.10.1.     Spain: Market Size and Forecast, By Component, 2023 – 2033 ($ Million)

11.3.10.2.     Spain: Market Size and Forecast, By Technology, 2023 – 2033 ($ Million)

11.3.10.3.     Spain: Market Size and Forecast, By Application, 2023 – 2033 ($ Million)

11.3.10.4.     Spain: Market Size and Forecast, By Vertical, 2023 – 2033 ($ Million)

11.3.11.         BENELUX

11.3.11.1.     BeNeLux: Market Size and Forecast, By Component, 2023 – 2033 ($ Million)

11.3.11.2.     BeNeLux: Market Size and Forecast, By Technology, 2023 – 2033 ($ Million)

11.3.11.3.     BeNeLux: Market Size and Forecast, By Application, 2023 – 2033 ($ Million)

11.3.11.4.     BeNeLux: Market Size and Forecast, By Vertical, 2023 – 2033 ($ Million)

11.3.12.         RUSSIA

11.3.12.1.     Russia: Market Size and Forecast, By Component, 2023 – 2033 ($ Million)

11.3.12.2.     Russia: Market Size and Forecast, By Technology, 2023 – 2033 ($ Million)

11.3.12.3.     Russia: Market Size and Forecast, By Application, 2023 – 2033 ($ Million)

11.3.12.4.     Russia: Market Size and Forecast, By Vertical, 2023 – 2033 ($ Million)

11.3.13.         REST OF EUROPE

11.3.13.1.     Rest of Europe: Market Size and Forecast, By Component, 2023 – 2033 ($ Million)

11.3.13.2.     Rest of Europe: Market Size and Forecast, By Technology, 2023 – 2033 ($ Million)

11.3.13.3.     Rest of Europe: Market Size and Forecast, By Application, 2023 – 2033 ($ Million)

11.3.13.4.     Rest of Europe: Market Size and Forecast, By Vertical, 2023 – 2033 ($ Million)

11.4.     Asia Pacific

11.4.1.      Asia Pacific: Market Size and Forecast, By Country, 2023 – 2033 ($ Million)

11.4.2.      Asia Pacific: Market Size and Forecast, By Component, 2023 – 2033 ($ Million)

11.4.3.      Asia Pacific: Market Size and Forecast, By Technology, 2023 – 2033 ($ Million)

11.4.4.      Asia Pacific: Market Size and Forecast, By Application, 2023 – 2033 ($ Million)

11.4.5.      Asia Pacific: Market Size and Forecast, By Vertical, 2023 – 2033 ($ Million)

11.4.6.      CHINA

11.4.6.1.       China: Market Size and Forecast, By Component, 2023 – 2033 ($ Million)

11.4.6.2.       China: Market Size and Forecast, By Technology, 2023 – 2033 ($ Million)

11.4.6.3.       China: Market Size and Forecast, By Application, 2023 – 2033 ($ Million)

11.4.6.4.       China: Market Size and Forecast, By Vertical, 2023 – 2033 ($ Million)

11.4.7.      JAPAN

11.4.7.1.       Japan: Market Size and Forecast, By Component, 2023 – 2033 ($ Million)

11.4.7.2.       Japan: Market Size and Forecast, By Technology, 2023 – 2033 ($ Million)

11.4.7.3.       Japan: Market Size and Forecast, By Application, 2023 – 2033 ($ Million)

11.4.7.4.       Japan: Market Size and Forecast, By Vertical, 2023 – 2033 ($ Million)

11.4.8.      INDIA

11.4.8.1.       India: Market Size and Forecast, By Component, 2023 – 2033 ($ Million)

11.4.8.2.       India: Market Size and Forecast, By Technology, 2023 – 2033 ($ Million)

11.4.8.3.       India: Market Size and Forecast, By Application, 2023 – 2033 ($ Million)

11.4.8.4.       India: Market Size and Forecast, By Vertical, 2023 – 2033 ($ Million)

11.4.9.      SOUTH KOREA

11.4.9.1.       South Korea: Market Size and Forecast, By Component, 2023 – 2033 ($ Million)

11.4.9.2.       South Korea: Market Size and Forecast, By Technology, 2023 – 2033 ($ Million)

11.4.9.3.       South Korea: Market Size and Forecast, By Application, 2023 – 2033 ($ Million)

11.4.9.4.       South Korea: Market Size and Forecast, By Vertical, 2023 – 2033 ($ Million)

11.4.10.         THAILAND

11.4.10.1.     Thailand: Market Size and Forecast, By Component, 2023 – 2033 ($ Million)

11.4.10.2.     Thailand: Market Size and Forecast, By Technology, 2023 – 2033 ($ Million)

11.4.10.3.     Thailand: Market Size and Forecast, By Application, 2023 – 2033 ($ Million)

11.4.10.4.     Thailand: Market Size and Forecast, By Vertical, 2023 – 2033 ($ Million)

11.4.11.         INDONESIA

11.4.11.1.     Indonesia: Market Size and Forecast, By Component, 2023 – 2033 ($ Million)

11.4.11.2.     Indonesia: Market Size and Forecast, By Technology, 2023 – 2033 ($ Million)

11.4.11.3.     Indonesia: Market Size and Forecast, By Application, 2023 – 2033 ($ Million)

11.4.11.4.     Indonesia: Market Size and Forecast, By Vertical, 2023 – 2033 ($ Million)

11.4.12.         MALAYSIA

11.4.12.1.     Malaysia: Market Size and Forecast, By Component, 2023 – 2033 ($ Million)

11.4.12.2.     Malaysia: Market Size and Forecast, By Technology, 2023 – 2033 ($ Million)

11.4.12.3.     Malaysia: Market Size and Forecast, By Application, 2023 – 2033 ($ Million)

11.4.12.4.     Malaysia: Market Size and Forecast, By Vertical, 2023 – 2033 ($ Million)

11.4.13.         AUSTRALIA

11.4.13.1.     Australia: Market Size and Forecast, By Component, 2023 – 2033 ($ Million)

11.4.13.2.     Australia: Market Size and Forecast, By Technology, 2023 – 2033 ($ Million)

11.4.13.3.     Australia: Market Size and Forecast, By Application, 2023 – 2033 ($ Million)

11.4.13.4.     Australia: Market Size and Forecast, By Vertical, 2023 – 2033 ($ Million)

11.4.14.         REST FO ASIA PACIFIC

11.4.14.1.     Rest fo Asia Pacific: Market Size and Forecast, By Component, 2023 – 2033 ($ Million)

11.4.14.2.     Rest fo Asia Pacific: Market Size and Forecast, By Technology, 2023 – 2033 ($ Million)

11.4.14.3.     Rest fo Asia Pacific: Market Size and Forecast, By Application, 2023 – 2033 ($ Million)

11.4.14.4.     Rest fo Asia Pacific: Market Size and Forecast, By Vertical, 2023 – 2033 ($ Million)

11.5.     South America

11.5.1.      South America: Market Size and Forecast, By Country, 2023 – 2033 ($ Million)

11.5.2.      South America: Market Size and Forecast, By Component, 2023 – 2033 ($ Million)

11.5.3.      South America: Market Size and Forecast, By Technology, 2023 – 2033 ($ Million)

11.5.4.      South America: Market Size and Forecast, By Application, 2023 – 2033 ($ Million)

11.5.5.      South America: Market Size and Forecast, By Vertical, 2023 – 2033 ($ Million)

11.5.6.      BRAZIL

11.5.6.1.       Brazil: Market Size and Forecast, By Component, 2023 – 2033 ($ Million)

11.5.6.2.       Brazil: Market Size and Forecast, By Technology, 2023 – 2033 ($ Million)

11.5.6.3.       Brazil: Market Size and Forecast, By Application, 2023 – 2033 ($ Million)

11.5.6.4.       Brazil: Market Size and Forecast, By Vertical, 2023 – 2033 ($ Million)

11.5.7.      ARGENTINA

11.5.7.1.       Argentina: Market Size and Forecast, By Component, 2023 – 2033 ($ Million)

11.5.7.2.       Argentina: Market Size and Forecast, By Technology, 2023 – 2033 ($ Million)

11.5.7.3.       Argentina: Market Size and Forecast, By Application, 2023 – 2033 ($ Million)

11.5.7.4.       Argentina: Market Size and Forecast, By Vertical, 2023 – 2033 ($ Million)

11.5.8.      REST OF SOUTH AMERICA

11.5.8.1.       Rest of South America: Market Size and Forecast, By Component, 2023 – 2033 ($ Million)

11.5.8.2.       Rest of South America: Market Size and Forecast, By Technology, 2023 – 2033 ($ Million)

11.5.8.3.       Rest of South America: Market Size and Forecast, By Application, 2023 – 2033 ($ Million)

11.5.8.4.       Rest of South America: Market Size and Forecast, By Vertical, 2023 – 2033 ($ Million)

11.6.     Middle East & Africa

11.6.1.      Middle East & Africa: Market Size and Forecast, By Country, 2023 – 2033 ($ Million)

11.6.2.      Middle East & Africa: Market Size and Forecast, By Component, 2023 – 2033 ($ Million)

11.6.3.      Middle East & Africa: Market Size and Forecast, By Technology, 2023 – 2033 ($ Million)

11.6.4.      Middle East & Africa: Market Size and Forecast, By Application, 2023 – 2033 ($ Million)

11.6.5.      Middle East & Africa: Market Size and Forecast, By Vertical, 2023 – 2033 ($ Million)

11.6.6.      SAUDI ARABIA

11.6.6.1.       Saudi Arabia: Market Size and Forecast, By Component, 2023 – 2033 ($ Million)

11.6.6.2.       Saudi Arabia: Market Size and Forecast, By Technology, 2023 – 2033 ($ Million)

11.6.6.3.       Saudi Arabia: Market Size and Forecast, By Application, 2023 – 2033 ($ Million)

11.6.6.4.       Saudi Arabia: Market Size and Forecast, By Vertical, 2023 – 2033 ($ Million)

11.6.7.      UAE

11.6.7.1.       UAE: Market Size and Forecast, By Component, 2023 – 2033 ($ Million)

11.6.7.2.       UAE: Market Size and Forecast, By Technology, 2023 – 2033 ($ Million)

11.6.7.3.       UAE: Market Size and Forecast, By Application, 2023 – 2033 ($ Million)

11.6.7.4.       UAE: Market Size and Forecast, By Vertical, 2023 – 2033 ($ Million)

11.6.8.      EGYPT

11.6.8.1.       Egypt: Market Size and Forecast, By Component, 2023 – 2033 ($ Million)

11.6.8.2.       Egypt: Market Size and Forecast, By Technology, 2023 – 2033 ($ Million)

11.6.8.3.       Egypt: Market Size and Forecast, By Application, 2023 – 2033 ($ Million)

11.6.8.4.       Egypt: Market Size and Forecast, By Vertical, 2023 – 2033 ($ Million)

11.6.9.      SOUTH AFRICA

11.6.9.1.       South Africa: Market Size and Forecast, By Component, 2023 – 2033 ($ Million)

11.6.9.2.       South Africa: Market Size and Forecast, By Technology, 2023 – 2033 ($ Million)

11.6.9.3.       South Africa: Market Size and Forecast, By Application, 2023 – 2033 ($ Million)

11.6.9.4.       South Africa: Market Size and Forecast, By Vertical, 2023 – 2033 ($ Million)

11.6.10.         REST OF MIDDLE EAST & AFRICA

11.6.10.1.     Rest of Middle East & Africa: Market Size and Forecast, By Component, 2023 – 2033 ($ Million)

11.6.10.2.     Rest of Middle East & Africa: Market Size and Forecast, By Technology, 2023 – 2033 ($ Million)

11.6.10.3.     Rest of Middle East & Africa: Market Size and Forecast, By Application, 2023 – 2033 ($ Million)

11.6.10.4.     Rest of Middle East & Africa: Market Size and Forecast, By Vertical, 2023 – 2033 ($ Million)

CHAPTER 12.        Competitive Landscape

12.1.     Competitior Benchmarking 2023

12.2.     Market Share Analysis

12.3.     Key Developments Analysis By Top 5 Companies

12.4.     Market Share Acquisition Strategies: Analysis of Key Approaches Employed by Top Players

CHAPTER 13.        Company Profiles

13.1.     Huawei Technologies Co

13.1.1.  Business Overview

13.1.2.      Financial Analysis

13.1.2.1.       Business Segment Revenue, 2018, 2019, 2020, $ Million

13.1.2.2.       Geographic Revenue Mix, 2020 (% Share)

13.1.3.      Product Portfolio

13.1.4.      Recent Development and Strategies Adopted

13.1.5.      SWOT Analysis

13.2.     Nokia

13.3.     Cisco

13.4.     Ciena

13.5.     ADTRAN

13.6.     ZTE

13.7.     Broadcom

13.8.     Finisar

13.9.     Fujitsu Optical Components

13.10.  Infinera

Connect to Analyst

Connect to Analyst

Research Methodology

Research Methodology