Mammography Market Analysis and Global Forecast 2023-2033
$ 1,390.00 – $ 5,520.00Price range: $ 1,390.00 through $ 5,520.00
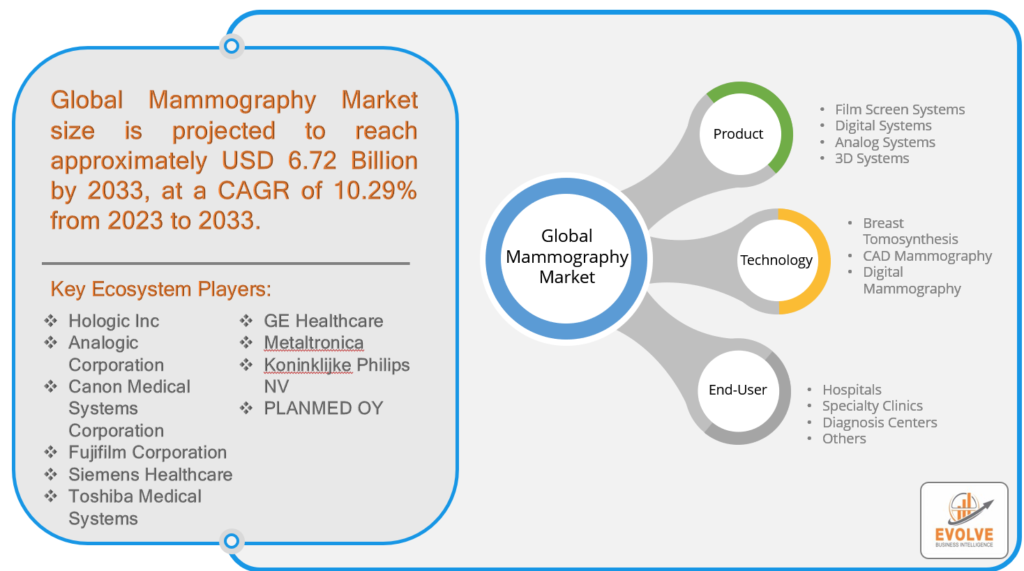
Mammography Market Research Report: Information By Product (Film Screen Systems, Digital Systems, Analog Systems, 3D Systems), By Technology (Breast Tomosynthesis, CAD Mammography, Digital Mammography), By End-user (Hospitals, Specialty Clinics, Diagnosis Centers, Others), and By Region — Forecast till 2033
The global Mammography market size is projected to reach approximately USD 6.72 Billion by 2033, at a CAGR of 10.29% from 2023 to 2033. Mammography is a medical imaging technique used to detect breast abnormalities, such as tumors or cysts, in their early stages. It involves taking X-ray images of breast tissue using a specialized machine called a mammogram. Mammography is primarily used for breast cancer screening, as it can detect small tumors that may not be palpable during a physical examination. It is also used for diagnostic purposes to further evaluate breast abnormalities found during clinical examinations or other imaging studies. Mammography is a critical tool in the early detection of breast cancer, which can improve the chances of successful treatment and survival.
The COVID-19 pandemic had a negative impact on the mammography market. The pandemic has disrupted routine healthcare services, including mammography screenings, due to various factors such as lockdowns, social distancing measures, prioritization of COVID-19 patients, and concerns about infection transmission in healthcare facilities. As a result, many mammography screening programs and facilities have experienced reduced patient volumes and delayed or canceled appointments.
Mammography Market Dynamics
The major factors that have impacted the growth of Mammography are as follows:
Drivers:
Increasing awareness about breast cancer
Rising awareness about breast cancer and the importance of early detection has been a significant driving factor for the mammography market. Breast cancer is a leading cause of cancer-related deaths among women worldwide, and mammography screening is recognized as an effective method for early detection and improved treatment outcomes.
Restraint:
- Limited access to healthcare facilities
Accessibility to mammography facilities can be a restraint factor, especially in rural or remote areas where access to healthcare facilities may be limited. Lack of proximity to mammography centers, transportation challenges, and geographical barriers can hinder patients’ ability to undergo regular mammography screenings, leading to reduced utilization and early detection.
Opportunity:
Personalized medicine and precision imaging
The development of personalized medicine and precision imaging approaches for breast cancer, such as molecular profiling, genomic testing, and targeted therapies, presents opportunities for the integration of mammography with other advanced diagnostic techniques. This can potentially lead to improved patient outcomes and more effective breast cancer management strategies.
Mammography Market Segment Overview
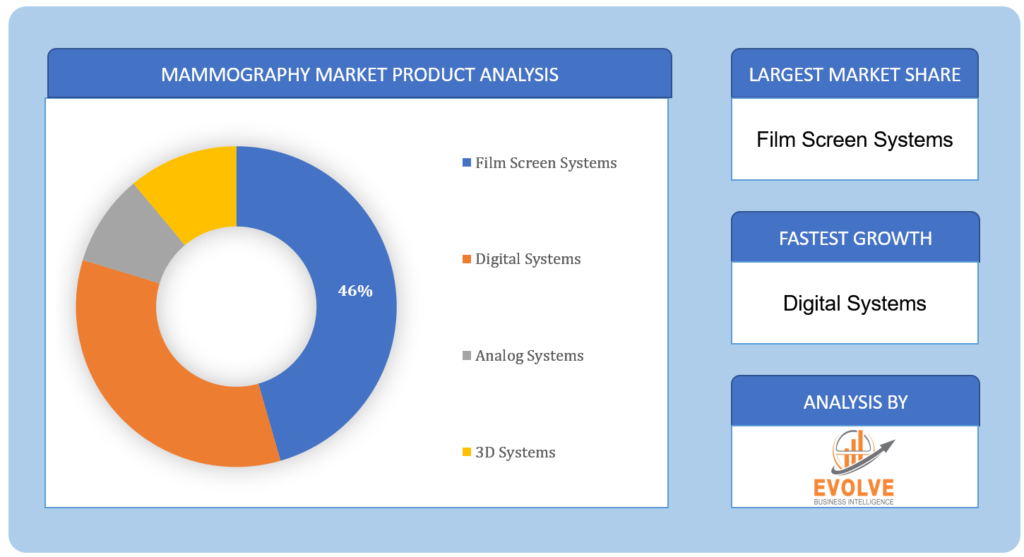
Based on the Product, the Mammography market is segmented based on Film Screen Systems, Digital Systems, Analog Systems, and 3D Systems. During the projection period, the Digital Systems segment is expected to hold the largest market share. Digital mammography is a type of mammography that uses digital detectors to capture and convert X-ray images of the breast into digital images that can be viewed and analyzed on a computer. Digital mammography offers several advantages over traditional film-based mammography, including higher image resolution, improved image quality, reduced radiation dose, and digital storage and retrieval capabilities.
By Technology
Based on Technology, the global Mammography market has been divided into Breast Tomosynthesis, CAD Mammography, and Digital Mammography. The Breast Tomosynthesis segment is expected to hold the largest market share. The segment’s larger market share can be attributed to the growing awareness about the benefits of breast tomosynthesis, advancements in tomosynthesis technology, and increasing demand for more accurate and reliable breast cancer screening methods.
By End-User
Based on End-User, the global Mammography market has been divided into Hospitals, Specialty Clinics, Diagnosis Centers, and Others. The Hospitals segment is expected to hold the largest market share. Hospitals may have well-equipped facilities, skilled personnel, and established quality assurance programs, which can contribute to the accurate and reliable delivery of mammography services.
Global Mammography Market Share, by Segmentation
 Mammography Market Regional Analysis
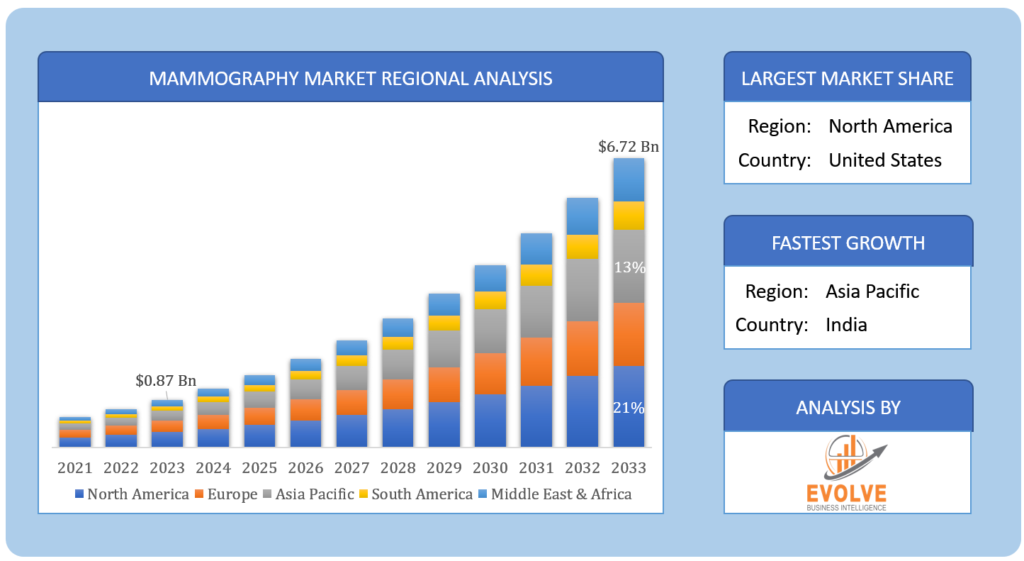
Based on region, the global Mammography market has been divided into North America, Europe, Asia-Pacific, and the Rest of the World. North America is projected to dominate the use of the Mammography market followed by the Asia-Pacific and Europe regions.
North America Market
North America has historically been one of the major regions in the mammography market and has held a significant market share. The region is known for its advanced healthcare infrastructure, well-established breast cancer screening programs, and increasing awareness about the importance of early breast cancer detection. Several factors contribute to North America’s significant market share in the mammography market. These include a high prevalence of breast cancer, favorable reimbursement policies for mammography services, well-developed healthcare facilities, and advanced imaging technologies. Additionally, increased awareness about breast cancer screening and advocacy efforts to promote regular mammography screenings have contributed to the growth of the mammography market in North America.
Asia-Pacific Market
Asia-Pacific is expected to be a significant growth market for mammography. The region has a large and growing population, increasing healthcare awareness, improving healthcare infrastructure, and rising incidences of breast cancer. These factors are driving the demand for mammography services in the Asia-Pacific region. Several key factors contribute to the expected growth of the mammography market in Asia-Pacific. These include increasing awareness about breast cancer and the importance of early detection, improving healthcare infrastructure, rising disposable incomes, and changing lifestyle patterns leading to an increased risk of breast cancer. Moreover, the governments in many Asia-Pacific countries are focusing on developing breast cancer screening programs and policies to promote early detection and reduce breast cancer-related morbidity and mortality.
Competitive Landscape
The market comprises tier-1, tier-2, and local players. With their wide product portfolios, tier-1 and tier-2 players have a global reach. Since of their strategic innovations and broad regional presence, companies such as Analogic Corporation, Canon Medical Systems Corporation, Fujifilm Corporation, and Siemens Healthcare lead the global Mammography business. To increase their market position and attract a wide consumer base, the businesses are employing various strategies, such as growth, product releases, and alliances.
Prominent Players:
- Hologic Inc
- Analogic Corporation
- Canon Medical Systems Corporation
- Fujifilm Corporation
- Siemens Healthcare
- Toshiba Medical Systems
- GE Healthcare
- Metaltronica
- Koninklijke Philips NV
- PLANMED OY
Scope of the Report
Global Mammography Market, by Product
- Film Screen Systems
- Digital Systems
- Analog Systems
- 3D Systems
Global Mammography Market, by Technology
- Breast Tomosynthesis
- CAD Mammography
- Digital Mammography
Global Mammography Market, by End-User
- Hospitals
- Specialty Clinics
- Diagnosis Centers
- Others
Global Mammography Market, by Region
- North America
- US
- Canada
- Mexico
- Europe
- UK
- Germany
- France
- Italy
- Rest of Europe
- Asia Pacific
- China
- Japan
- South Korea
- India
- Rest of Asia Pacific
- Rest of the World
| Parameters | Indicators |
|---|---|
| Market Size | 2033: $ 6.72 Billion |
| CAGR | 10.29% CAGR (2023-2033) |
| Base year | 2022 |
| Forecast Period | 2023-2033 |
| Historical Data | 2021 |
| Report Coverage | Revenue Forecast, Competitive Landscape, Growth Factors, and Trends |
| Key Segmentations | Product, Technology, End-User |
| Geographies Covered | North America, Europe, Asia-Pacific, Latin America, Middle East, Africa |
| Key Vendors | Hologic Inc, Analogic Corporation, Canon Medical Systems Corporation, Fujifilm Corporation, Siemens Healthcare, Toshiba Medical Systems, GE Healthcare, Metaltronica, Koninklijke Philips NV, PLANMED OY |
| Key Market Opportunities | Personalized medicine and precision imaging |
| Key Market Drivers | Increasing awareness about breast cancer |
REPORT CONTENT BRIEF:
- High-level analysis of the current and future Mammography market trends and opportunities
- Detailed analysis of current market drivers, restraining factors, and opportunities in the future
- Mammography market historical market size for the year 2021, and forecast from 2023 to 2033
- Mammography market share analysis at each product level
- Competitor analysis with a detailed insight into its product segment, financial strength, and strategies adopted.
- Identifies key strategies adopted including product launches and developments, mergers and acquisitions, joint ventures, collaborations, and partnerships as well as funding taken and investment done, among others.
- To identify and understand the various factors involved in the global Mammography market affected by the pandemic
- To provide a detailed insight into the major companies operating in the market. The profiling will include the financial health of the company’s past 2-3 years with segmental and regional revenue breakup, product offering, recent developments, SWOT analysis, and key strategies.
Press Release

Global Pharmaceutical Manufacturing Market to Reach $1.38 Trillion by 2035 with 7.35% CAGR, New Research Shows

The Global Mammography Market Is Estimated To Record a CAGR of Around 10.29% During The Forecast Period

Glue Stick Market to Reach USD 2.35 Billion by 2034

Podiatry Service Market to Reach USD 11.88 Billion by 2034

Microfluidics Technology Market to Reach USD 32.58 Billion by 2034

Ferric Chloride Market to Reach USD 10.65 Billion by 2034

Family Practice EMR Software Market to Reach USD 21.52 Billion by 2034

Electric Hairbrush Market to Reach USD 15.95 Billion by 2034

Daily Bamboo Products Market to Reach USD 143.52 Billion by 2034

Cross-border E-commerce Logistics Market to Reach USD 112.65 Billion by 2034
Frequently Asked Questions (FAQ)
What is the study period of this market?
The study period of the global Mammography market is 2022- 2033
What is the growth rate of the global Mammography market?
The global Mammography market is growing at a CAGR of ~10.29% over the next 10 years
Which region has the highest growth rate in the global Mammography market?
Asia Pacific is expected to register the highest CAGR during 2023-2033
Which region has the largest share of the global Mammography market?
North America holds the largest share in 2022
Who are the key players in the global Mammography market?
Hologic Inc, Analogic Corporation, Canon Medical Systems Corporation, Fujifilm Corporation, Siemens Healthcare, Toshiba Medical Systems, GE Healthcare, Metaltronica, Koninklijke Philips NV, and Planmed OY are the major companies operating in the global Mammography
Do you offer Post Sale Support?
Yes, we offer 16 hours of analyst support to solve the queries
Do you sell particular sections of a report?
Yes, we provide regional as well as country-level reports. Other than this we also provide a sectional report. Please get in contact with our sales representatives.
Table of Content
Chapter 1. Executive Summary Chapter 2. Scope Of The Study 2.1. Market Definition 2.2. Scope Of The Study 2.2.1. Objectives of Report 2.2.2. Limitations 2.3. Market Structure Chapter 3. Evolve BI Methodology Chapter 4. Market Insights and Trends 4.1. Supply/ Value Chain Analysis 4.1.1. Raw Application Providers 4.1.2. Manufacturing Process 4.1.3. Distributors/Retailers 4.1.4. End-Use Industry 4.2. Porter’s Five Forces Analysis 4.2.1. Threat Of New Entrants 4.2.2. Bargaining Power Of Buyers 4.2.3. Bargaining Power Of Suppliers 4.2.4. Threat Of Substitutes 4.2.5. Industry Rivalry 4.3. Impact Of COVID-19 on the Mammography Market 4.3.1. Impact on Market Size 4.3.2. End-Use Industry Trend, Preferences, and Budget Impact 4.3.3. Regulatory Framework/Government Policies 4.3.4. Key Players' Strategy to Tackle Negative Impact 4.3.5. Opportunity Window 4.4. Technology Overview 4.5. Macro factor 4.6. Micro Factor 4.7. Demand Supply Gap Analysis of the Mammography Market 4.8. Import Analysis of the Mammography Market 4.9. Export Analysis of the Mammography Market Chapter 5. Market Dynamics 5.1. Introduction 5.2. DROC Analysis 5.2.1. Drivers 5.2.2. Restraints 5.2.3. Opportunities 5.2.4. Challenges 5.3. Patent Analysis 5.4. Industry Roadmap 5.5. Parent/Peer Market Analysis Chapter 6. Global Mammography Market, By Product 6.1. Introduction 6.2. Film Screen Systems 6.3. Digital Systems 6.4. Analog Systems 6.5. 3D Systems Chapter 7. Global Mammography Market, By Technology 7.1. Introduction 7.2. Breast Tomosynthesis 7.3. CAD Mammography 7.4. Digital Mammography Chapter 8. Global Mammography Market, By End-User 8.1. Introduction 8.2. Hospitals 8.3. Specialty Clinics 8.4. Diagnosis Centers 8.5. Others Chapter 9. Global Mammography Market, By Region 9.1. Introduction 9.2. North America 9.2.1. Introduction 9.2.2. Driving Factors, Opportunity Analyzed, and Key Trends 9.2.3. Market Size and Forecast, By Country, 2023-2033 9.2.4. Market Size and Forecast, By Product, 2023-2033 9.2.5. Market Size and Forecast, By Technology, 2023-2033 9.2.6. Market Size and Forecast, By End-User, 2023-2033 9.2.7. US 9.2.7.1. Introduction 9.2.7.2. Driving Factors, Opportunity Analyzed, and Key Trends 9.2.7.3. Market Size and Forecast, By Product, 2023-2033 9.2.7.4. Market Size and Forecast, By Technology, 2023-2033 9.2.7.5. Market Size and Forecast, By End-User, 2023-2033 9.2.8. Canada 9.2.8.1. Introduction 9.2.8.2. Driving Factors, Opportunity Analyzed, and Key Trends 9.2.8.4. Market Size and Forecast, By Product, 2023-2033 9.2.8.5. Market Size and Forecast, By Technology, 2023-2033 9.2.8.6. Market Size and Forecast, By End-User, 2023-2033 9.3. Europe 9.3.1. Introduction 9.3.2. Driving Factors, Opportunity Analyzed, and Key Trends 9.3.3. Market Size and Forecast, By Country, 2023-2033 9.3.4. Market Size and Forecast, By Product, 2023-2033 9.3.5. Market Size and Forecast, By Technology, 2023-2033 9.3.6. Market Size and Forecast, By End-User, 2023-2033 9.3.7. Germany 9.3.7.1. Introduction 9.3.7.2. Driving Factors, Opportunity Analyzed, and Key Trends 9.3.7.3. Market Size and Forecast, By Product, 2023-2033 9.3.7.4. Market Size and Forecast, By Technology, 2023-2033 9.3.7.5. Market Size and Forecast, By End-User, 2023-2033 9.3.8. France 9.3.8.1. Introduction 9.3.8.2. Driving Factors, Opportunity Analyzed, and Key Trends 9.3.8.3. Market Size and Forecast, By Product, 2023-2033 9.3.8.4. Market Size and Forecast, By Technology, 2023-2033 9.3.8.5. Market Size and Forecast, By End-User, 2023-2033 9.3.9. UK 9.3.9.1. Introduction 9.3.9.2. Driving Factors, Opportunity Analyzed, and Key Trends 9.3.9.3. Market Size and Forecast, By Product, 2023-2033 9.3.9.4. Market Size and Forecast, By Technology, 2023-2033 9.3.9.5. Market Size and Forecast, By End-User, 2023-2033 9.3.10. Italy 9.3.10.1. Introduction 9.3.10.2. Driving Factors, Opportunity Analyzed, and Key Trends 9.3.10.3. Market Size and Forecast, By Product, 2023-2033 9.3.10.4. Market Size and Forecast, By Technology, 2023-2033 9.3.10.5. Market Size and Forecast, By End-User, 2023-2033 9.3.11. Rest Of Europe 9.3.11.1. Introduction 9.3.11.2. Driving Factors, Opportunity Analyzed, and Key Trends 9.3.11.3. Market Size and Forecast, By Product, 2023-2033 9.3.11.4. Market Size and Forecast, By Technology, 2023-2033 9.3.11.5. Market Size and Forecast, By End-User, 2023-2033 9.4. Asia-Pacific 9.4.1. Introduction 9.4.2. Driving Factors, Opportunity Analyzed, and Key Trends 9.4.3. Market Size and Forecast, By Country, 2023-2033 9.4.4. Market Size and Forecast, By Product, 2023-2033 9.4.5. Market Size and Forecast, By Technology, 2023-2033 9.4.7. Market Size and Forecast, By End-User, 2023-2033 9.4.8. China 9.4.8.1. Introduction 9.4.8.2. Driving Factors, Opportunity Analyzed, and Key Trends 9.4.8.3. Market Size and Forecast, By Product, 2023-2033 9.4.8.4. Market Size and Forecast, By Technology, 2023-2033 9.4.8.5. Market Size and Forecast, By End-User, 2023-2033 9.4.9. India 9.4.9.1. Introduction 9.4.9.2. Driving Factors, Opportunity Analyzed, and Key Trends 9.4.9.3. Market Size and Forecast, By Product, 2023-2033 9.4.9.4. Market Size and Forecast, By Technology, 2023-2033 9.4.9.5. Market Size and Forecast, By End-User, 2023-2033 9.4.10. Japan 9.4.10.1. Introduction 9.4.10.2. Driving Factors, Opportunity Analyzed, and Key Trends 9.4.10.3. Market Size and Forecast, By Product, 2023-2033 9.4.10.4. Market Size and Forecast, By Technology, 2023-2033 9.4.10.5. Market Size and Forecast, By End-User, 2023-2033 9.4.11. South Korea 9.4.11.1. Introduction 9.4.11.2. Driving Factors, Opportunity Analyzed, and Key Trends 9.4.11.3. Market Size and Forecast, By Product, 2023-2033 9.4.11.4. Market Size and Forecast, By Technology, 2023-2033 9.4.11.5. Market Size and Forecast, By End-User, 2023-2033 9.4.12. Rest Of Asia-Pacific 9.4.11.1. Introduction 9.4.12.2. Driving Factors, Opportunity Analyzed, and Key Trends 9.4.12.3. Market Size and Forecast, By Product, 2023-2033 9.4.12.4. Market Size and Forecast, By Technology, 2023-2033 9.4.12.5. Market Size and Forecast, By End-User, 2023-2033 9.5. Rest Of The World (RoW) 9.5.1. Introduction 9.5.2. Driving Factors, Opportunity Analyzed, and Key Trends 9.5.3. Market Size and Forecast, By Product, 2023-2033 9.5.4. Market Size and Forecast, By Technology, 2023-2033 9.5.5. Market Size and Forecast, By End-User, 2023-2033 Chapter 10. Company Landscape 10.1. Introduction 10.2. Vendor Share Analysis 10.3. Key Development Analysis 10.4. Competitor Dashboard Chapter 11. Company Profiles 11.1. Hologic Inc 11.1.1. Business Overview 11.1.2. Financial Analysis 11.1.2.1. Financial – Existing/Funding 11.1.3. Product Portfolio 11.1.4. Recent Development and Strategies Adopted 11.1.5. SWOT Analysis 11.2. Analogic Corporation 11.2.1. Business Overview 11.2.2. Financial Analysis 11.2.2.1. Financial – Existing/Funding 11.2.3. Product Portfolio 11.2.4. Recent Development and Strategies Adopted 11.2.5. SWOT Analysis 11.3. Canon Medical Systems Corporation 11.3.1. Business Overview 11.3.2. Financial Analysis 11.3.2.1. Financial – Existing/Funding 11.3.3. Product Portfolio 11.3.4. Recent Development and Strategies Adopted 11.3.5. SWOT Analysis 11.4. Fujifilm Corporation 11.4.1. Business Overview 11.4.2. Financial Analysis 11.4.2.1. Financial – Existing/Funding 11.4.3. Product Portfolio 11.4.4. Recent Development and Strategies Adopted 11.4.5. SWOT Analysis 11.5. Siemens Healthcare 11.5.1. Business Overview 11.5.2. Financial Analysis 11.5.2.1. Financial – Existing/Funding 11.5.3. Product Portfolio 11.5.4. Recent Development and Strategies Adopted 11.5.5. SWOT Analysis 11.6. Toshiba Medical Systems 11.6.1. Business Overview 11.6.2. Financial Analysis 11.6.2.1. Financial – Existing/Funding 11.6.3. Product Portfolio 11.6.4. Recent Development and Strategies Adopted 11.6.5. SWOT Analysis 11.7. GE Healthcare 11.7.1. Business Overview 11.7.2. Financial Analysis 11.7.2.1. Financial – Existing/Funding 11.7.3. Product Portfolio 11.7.4. Recent Development and Strategies Adopted 11.7.5. SWOT Analysis 11.8 Metaltronica 11.8.1. Business Overview 11.8.2. Financial Analysis 11.8.2.1. Financial – Existing/Funding 11.8.3. Product Portfolio 11.8.4. Recent Development and Strategies Adopted 11.8.5. SWOT Analysis 11.9. Koninklijke Philips NV 11.9.1. Business Overview 11.9.2. Financial Analysis 11.9.2.1. Financial – Existing/Funding 11.9.3. Product Portfolio 11.9.4. Recent Development and Strategies Adopted 11.9.5. SWOT Analysis 11.10. PLANMED OY 11.10.1. Business Overview 11.10.2. Financial Analysis 11.10.2.1. Financial – Existing/Funding 11.10.3. Product Portfolio 11.9.4. Recent Development and Strategies Adopted 11.9.5. SWOT Analysis Chapter 12. Key Takeaways
Connect to Analyst
Research Methodology


