Industrial Robots & Automation Market Analysis and Global Forecast 2023-2033

$ 1,390.00$ 5,520.00

Industrial Robots & Automation Market Research Report: By Robot Type (Articulated, SCARA, Cylindrical, Cartesian/Linear, Parallel, and Others), By Application (Pick and Place, Welding & Soldering, Material Handling, Assembling, Cutting & Processing, and Others), By Industry (Automotive, Electrical & Electronics, Healthcare & Pharmaceutical, Food & Beverages, Rubber & Plastic, Metals & Machinery, and Others), and by Region — Forecast till 2033

Report Published on: October 16, 2024
$ 3,470.00
$ 5,520.00
$ 1,390.00
Description

Industrial Robots & Automation Market Overview

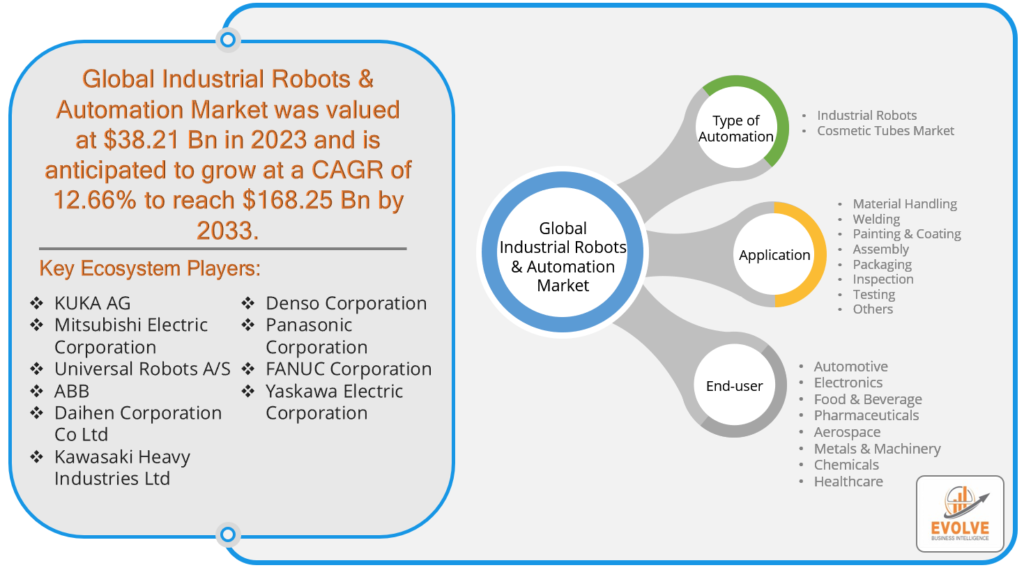
The Industrial Robots & Automation Market Size is expected to reach USD 168.25 Billion by 2033. The Industrial Robots and Automation Industry size accounted for USD 38.21 Billion in 2023 and is expected to expand at a CAGR of 12.66% from 2023 to 2033. Industrial robots are programmable mechanical devices designed to perform a variety of tasks in manufacturing and industrial settings, such as assembly, welding, painting, and material handling, with a high degree of precision and efficiency. Automation refers to the use of various technologies, including robots, computer systems, and control systems, to replace or enhance human labor in the production and operation of machinery and processes. Together, industrial robots and automation technologies aim to streamline production, improve quality, reduce costs, and increase overall productivity in industrial and manufacturing environments.

Global Industrial Robots & Automation Market Synopsis

Industrial Robots & Automation Market AnalysisCOVID-19 Impact Analysis

The Industrial Robots & Automation market experienced a moderate impact from the COVID-19 pandemic. While the initial outbreak disrupted supply chains and temporarily slowed down production in some sectors, the crisis also highlighted the value of automation and robotics in maintaining business continuity and ensuring worker safety. Consequently, many industries accelerated their adoption of automation solutions to minimize human interaction, enhance operational resilience, and meet changing market demands. As a result, the sector witnessed increased interest and investment, particularly in industries like e-commerce, healthcare, and logistics, underscoring the adaptability and long-term growth potential of the industrial robotics and automation market in the face of global challenges.

Global Industrial Robots & Automation Market Dynamics

The major factors that have impacted the growth of Industrial Robots & Automation are as follows:

Drivers:

⮚      Increasing Labor Costs Drive Demand for Industrial Robots & Automation

The rising labor costs, coupled with the need for improved productivity and quality, are compelling industries to invest in industrial robots and automation. This driver is especially significant in sectors such as manufacturing, where the automation of repetitive and labor-intensive tasks can reduce operational expenses and enhance output, making it a cost-effective solution.

Restraint:

  • Integration Challenges Pose a Restraint to Industrial Robots & Automation Adoption

The industrial robots and automation market is the complexity and cost of integrating automation systems into existing processes. Many industries face challenges in seamlessly transitioning to automated solutions, including the need for substantial capital investments, retrofitting existing infrastructure, and retraining the workforce. These integration hurdles can slow down the adoption of automation technologies.

Opportunity:

⮚      Industry 4.0 and IoT Unlock New Growth Opportunities for Industrial Robots & Automation

The advent of Industry 4.0 and the Internet of Things (IoT) presents a significant opportunity for the industrial robots and automation market. By leveraging connected devices, data analytics, and real-time monitoring, industries can achieve greater efficiency, predictive maintenance, and customization in their production processes. This not only enhances operational performance but also opens up new horizons for automation in various sectors, including smart factories, healthcare, and logistics.

Industrial Robots & Automation Market Segment Overview

By Type of Automation
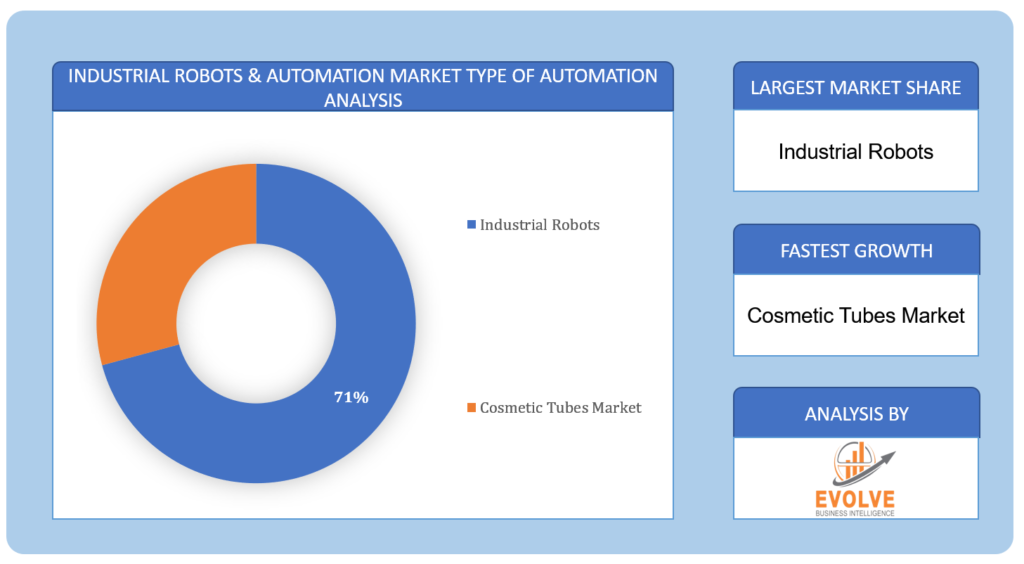
Industrial Robots & Automation Market Type of Automation Analysis Based on the Type of Automation, the market is segmented based on Industrial Robots and Cosmetic Tubes Market. The Industrial Robots segment was projected to hold the largest market share in the Industrial Robots & Automation market due to its versatility and ability to cater to a wide range of manufacturing and industrial applications.

By Application

Based on the Application, the market has been divided into Material Handling, Welding, Painting & Coating, Assembly, Packaging, Inspection, Testing, and Others. The Material Handling segment is expected to hold the largest market share in the Elbow Sleeve market due to its broad utility in various industries, from logistics and e-commerce to manufacturing and healthcare, driving demand for protective and supportive solutions.

By End-user

Based on End-users, the market has been divided into Automotive, Electronics, Food & Beverage, Pharmaceuticals, Aerospace, Metals & Machinery, Chemicals, and Healthcare. The Automotive segment is expected to hold the largest market share in the Industrial Robots & Automation market due to its extensive adoption of robotics and automation for manufacturing and assembly processes, streamlining production and enhancing efficiency.

Global Industrial Robots & Automation Market Regional Analysis

Based on region, the market has been divided into North America, Europe, Asia-Pacific, the Middle East & Africa, and Latin America. The area of North America is anticipated to dominate the market for the usage of Industrial Robots & Automation, followed by those in Asia-Pacific and Europe.

North America Market

Global Industrial Robots & Automation Market Regional AnalysisNorth America significantly dominates the Industrial Robots & Automation market. This leadership is attributed to several factors, including the region’s strong manufacturing base, technological innovation, and a robust focus on automation. The presence of major automotive, aerospace, and electronics industries, as well as increasing demand for automation in e-commerce and logistics, has fueled the growth of industrial robots in the region. Moreover, North America boasts a thriving ecosystem of robotics and automation companies, research institutions, and a skilled workforce, making it a global hub for technology development and adoption in this field. Additionally, government initiatives, such as tax incentives and funding for automation projects, have further accelerated the adoption of industrial robots and automation solutions across various industries, solidifying North America’s position as a dominant force in this market.

Asia Pacific Market

The Asia-Pacific region has been experiencing remarkable growth in the Industrial Robots & Automation market. This surge can be attributed to several factors, including the rapid industrialization of countries like China and India, coupled with the need to meet increasing consumer demand efficiently. The automotive and electronics industries, in particular, have been major drivers of automation adoption in the region, seeking to enhance production capacity and product quality. Additionally, government initiatives, such as “Made in China 2025” and “Made in India,” have further incentivized the use of industrial robots and automation technologies, promoting local manufacturing and innovation. The region’s well-established supply chain networks, expanding middle-class population, and a growing emphasis on smart manufacturing and Industry 4.0 practices have all contributed to the remarkable growth of the Industrial Robots & Automation market in the Asia-Pacific region.

Competitive Landscape

The competitive landscape includes key players (tier 1, tier 2, and local) having a presence across the globe. Companies such as KUKA AG, Mitsubishi Electric Corporation, Universal Robots A/S, ABB, and Daihen Corporation Co Ltd are some of the leading players in the global  Industrial Robots & Automation Industry. These players have adopted partnership, acquisition, expansion, and new product development, among others as their key strategies.

Key Market Players:

  • KUKA AG
  • Mitsubishi Electric Corporation
  • Universal Robots A/S
  • ABB
  • Daihen Corporation Co Ltd
  • Kawasaki Heavy Industries Ltd
  • Denso Corporation
  • Panasonic Corporation
  • FANUC Corporation
  • Yaskawa Electric Corporation

Key development:

In June 2023, ABB Robotics revealed their plans for extending the GoFa cobot family, introducing the latest models, GoFa 10 and GoFa 12. These new cobots come with improved efficiency, increased payload capacity, and a host of other advanced features.

In October 2022, ABB Robotics introduced the IRB1010, their smallest industrial robot ever, in response to the growing demand for smart device production. Specifically tailored for the electronics manufacturing sector, including products like earphones, health trackers, smartwatches, and similar devices, the robot is designed to meet the needs of this industry.

Scope of the Report

Global Industrial Robots & Automation Market, by Type of Automation
  • Industrial Robots
  • Cosmetic Tubes Market
Global Industrial Robots & Automation Market, by Application
  • Material Handling
  • Welding
  • Painting & Coating
  • Assembly
  • Packaging
  • Inspection
  • Testing
  • Others
Global Industrial Robots & Automation Market, by End User
  • Automotive
  • Electronics
  • Food & Beverage
  • Pharmaceuticals
  • Aerospace
  • Metals & Machinery
  • Chemicals
  • Healthcare
Global Industrial Robots & Automation Market, by Region
  • North America
    • US
    • Canada
    • Mexico
  • Europe
    • UK
    • Germany
    • France
    • Italy
    • Spain
    • Benelux
    • Nordic
    • Rest of Europe
  • Asia Pacific
    • China
    • Japan
    • South Korea
    • Indonesia
    • Austalia
    • Malaysia
    • India
    • Rest of Asia Pacific
  • South America
    • Brazil
    • Argentina
    • Rest of South America
  • Middle East & Africa
    • Saudi Arabia
    • UAE
    • Egypt
    • South Africa
    • Rest of Middle East & Africa


Parameters Indicators
Market Size 2033: $168.25 Billion
CAGR 12.66% CAGR (2023-2033)
Base year 2022
Forecast Period 2023-2033
Historical Data 2021
Report Coverage Revenue Forecast, Competitive Landscape, Growth Factors, and Trends
Key Segmentations Type of Automation, Application, End-user
Geographies Covered North America, Europe, Asia-Pacific, Latin America, Middle East, Africa
Key Vendors KUKA AG, Mitsubishi Electric Corporation, Universal Robots A/S, ABB, Daihen Corporation Co Ltd, Kawasaki Heavy Industries Ltd, Denso Corporation, Panasonic Corporation, FANUC Corporation, Yaskawa Electric Corporation
Key Market Opportunities • Industry 4.0 and IoT Integration
• Expanding Applications in Various Sectors
• Long-Term Growth Potential
Key Market Drivers • Labor Cost Pressures
• Enhanced Productivity and Quality
• Resilience and Business Continuity


REPORT CONTENT BRIEF:
  • High-level analysis of the current and future Industrial Robots & Automation Industry trends and opportunities
  • Detailed analysis of current market drivers, restraining factors, and opportunities analysis in the future
  • Historical market size for the year 2021, and forecast from 2023 to 2033
  • Industrial Robots & Automation market share analysis for each segment
  • Competitor analysis with a comprehensive insight into its product segment, financial strength, and strategies adopted.
  • Identifies key strategies adopted by the key players including new product development, mergers and acquisitions, joint ventures, collaborations, and partnerships.
  • To identify and understand the various factors involved in the global Industrial Robots & Automation market affected by the pandemic
  • To provide year-on-year growth from 2022 to 2033
  • To provide short-term, long-term, and overall CAGR comparison from 2022 to 2033.
  • Provide Total Addressable Market (TAM) for the Global Industrial Robots & Automation Market.

For more details mail us at

Ask a question / additional requirement

Frequently Asked Questions (FAQ)

The global Industrial Robots & Automation market is growing at a CAGR of ~68% over the next 10 years

North America is expected to register the highest CAGR during 2023-2033

ABB (Switzerland), YASKAWA ELECTRIC CORPORATION (Japan), MITSUBISHI ELECTRIC CORPORATION (JAPAN), NACHI-FUJIKOSHI CORP. (Japan), Comau Spa (Italy), KUKA AG (Germany), FANUC CORPORATION (Japan), DENSO CORPORATION (Japan), Kawasaki Heavy Industries, Ltd. (Japan), Omron Corporation (Japan).

Yes, we offer 16 hours of analyst support to solve the queries

Yes, we do provide regional as well as country-level reports. Other than this we also provide a sectional report. Please get in contact with our sales representatives.

Table of Content

Table of Content

CHAPTER 1.                 Executive Summary

CHAPTER 2.                 Scope of the Study

2.1.    Market Definition

2.2.    Market Scope & Segmentation

2.2.1.       Objective of Report

CHAPTER 3.                 Evolve BI Methodology

3.1.    Data Collection & Validation Approach

3.2.    Market Size Estimation and Forecast

CHAPTER 4.                 Exclusive Analysis

4.1.    Market Opportunity Score

4.1.1.    OfferingsSegement – Market Opportunity Score

4.1.2.    Application Segment – Market Opportunity Score

4.1.3.    VerticalsSegment – Market Opportunity Score

4.2.    Key Market Influencing Indicators

CHAPTER 5.                 Market Insights and Trends

5.1.    Value Chain Analysis

5.1.1.    Raw Material

5.1.2.    Manufacturing Process

5.1.3.    Distribution Channel

5.1.4.    End User

5.2.    Porter’s Five Forces Analysis

5.2.1.    Bargaining Power of Buyers

5.2.2.    Bargaining Power of Suppliers

5.2.3.    Threat of New Entrant

5.2.4.    Threat of Substitute

5.2.5.    Industry Rivalry

5.3.    COVID-19 Impact and Post COVID Scenario on Industrial Robots & Automation Market

5.3.1.    Impact of COVID-19

5.3.2.    Government Support and Industry Revival Policies

5.3.3.    Measures Taken by Companies to Mitigate Negative Impact

5.3.4.    Post COVID Trend

CHAPTER 6.                 MArket Dynamics

6.1.    Introduction

6.2.    Drivers

6.2.1.    Driver 1

6.2.2.    Driver 2

6.2.3.    Driver 3

6.3.    Restraints

6.3.1.    Restraint 1

6.3.2.    Restraint 2

6.4.    Opportunity

6.4.1.    Opportunity 1

CHAPTER 7. Global Industrial Robots & Automation Market, By Robot Type

7.1. Introduction _______________________________________________________________

7.1.1. Articulated

7.1.2. SCARA

7.1.3. Cylindrical

7.1.4. Cartesian/Linear

7.1.5. Parallel

7.1.6. Others (Collaborative)

CHAPTER 8. Global Industrial Robots & Automation Market, By Application

8.1.Introduction

8.1.1. Pick & Place

8.1.2. Welding & Soldering

8.1.3. Material Handling

8.1.4 Assembling

8.1.5. Cutting & Processing

8.1.6. Others (Painting)

CHAPTER 9. Global Industrial Robots & Automation Market, By Industry

9.1. Introduction

9.1.1. Automotive

9.1.2. Electrical & Electronics

9.1.3. Healthcare & Pharmaceutical

9.1.4 Food & Beverages

9.1.5. Rubber & Plastic

9.1.6. Metals & Machinery

9.1.7. Others (Construction, Defense)

CHAPTER 10.Global Industrial Robots & Automation Market, By Region

10.1. Introduction

10.2. NORTH AMERICA

10.2.1.      North America: Market Size and Forecast, By Country, 2023 – 2033 ($ Million)

10.2.2.      North America: Market Size and Forecast, By Offerings, 2023 – 2033 ($ Million)

10.2.3.      North America: Market Size and Forecast, By Application, 2023 – 2033 ($ Million)

10.2.4.      North America: Market Size and Forecast, By Verticals, 2023 – 2033 ($ Million)

10.2.5.      US

10.2.5.1.       US: Market Size and Forecast, By Offerings, 2023 – 2033 ($ Million)

10.2.5.2.       US: Market Size and Forecast, By Application, 2023 – 2033 ($ Million)

10.2.5.3.       US: Market Size and Forecast, By Verticals, 2023 – 2033 ($ Million)

10.2.6.      CANADA

10.2.6.1.       Canada: Market Size and Forecast, By Offerings, 2023 – 2033 ($ Million)

10.2.6.2.       Canada: Market Size and Forecast, By Application, 2023 – 2033 ($ Million)

10.2.6.3.       Canada: Market Size and Forecast, By Verticals, 2023 – 2033 ($ Million)

10.2.7.      MEXICO

10.2.7.1.       Mexico: Market Size and Forecast, By Offerings, 2023 – 2033 ($ Million)

10.2.7.2.       Mexico: Market Size and Forecast, By Application, 2023 – 2033 ($ Million)

10.2.7.3.       Mexico: Market Size and Forecast, By Verticals, 2023 – 2033 ($ Million)

10.3. Europe

10.3.1.      Europe: Market Size and Forecast, By Country, 2023 – 2033 ($ Million)

10.3.2.      Europe: Market Size and Forecast, By Offerings, 2023 – 2033 ($ Million)

10.3.3.      Europe: Market Size and Forecast, By Application, 2023 – 2033 ($ Million)

10.3.4.      Europe: Market Size and Forecast, By Verticals, 2023 – 2033 ($ Million)

10.3.5.      U.K.

10.3.5.1.       U.K.: Market Size and Forecast, By Offerings, 2023 – 2033 ($ Million)

10.3.5.2.       U.K.: Market Size and Forecast, By Application, 2023 – 2033 ($ Million)

10.3.5.3.       U.K.: Market Size and Forecast, By Verticals, 2023 – 2033 ($ Million)

10.3.6.      GERMANY

10.3.6.1.       Germany: Market Size and Forecast, By Offerings, 2023 – 2033 ($ Million)

10.3.6.2.       Germany: Market Size and Forecast, By Application, 2023 – 2033 ($ Million)

10.3.6.3.       Germany: Market Size and Forecast, By Verticals, 2023 – 2033 ($ Million)

10.3.7.      FRANCE

10.3.7.1.       France: Market Size and Forecast, By Offerings, 2023 – 2033 ($ Million)

10.3.7.2.       France: Market Size and Forecast, By Application, 2023 – 2033 ($ Million)

10.3.7.3.       France: Market Size and Forecast, By Verticals, 2023 – 2033 ($ Million)

10.3.8.      ITALY

10.3.8.1.       Italy: Market Size and Forecast, By Offerings, 2023 – 2033 ($ Million)

10.3.8.2.       Italy: Market Size and Forecast, By Application, 2023 – 2033 ($ Million)

10.3.8.3.       Italy: Market Size and Forecast, By Verticals, 2023 – 2033 ($ Million)

10.3.9.           SPAIN

10.3.9.1.        Spain: Market Size and Forecast, By Offerings, 2023 – 2033 ($ Million)

10.3.9.2.        Spain: Market Size and Forecast, By Application, 2023 – 2033 ($ Million)

10.3.9.3.        Spain: Market Size and Forecast, By Verticals, 2023 – 2033 ($ Million)

10.3.10.         BENELUX

10.3.10.1.     BeNeLux: Market Size and Forecast, By Offerings, 2023 – 2033 ($ Million)

10.3.10.2.     BeNeLux: Market Size and Forecast, By Application, 2023 – 2033 ($ Million)

10.3.10.3.     BeNeLux: Market Size and Forecast, By Verticals, 2023 – 2033 ($ Million)

10.3.11.         RUSSIA

10.3.11.1.     Russia: Market Size and Forecast, By Offerings, 2023 – 2033 ($ Million)

10.3.11.2.     Russia: Market Size and Forecast, By Application, 2023 – 2033 ($ Million)

10.3.11.3.     Russia: Market Size and Forecast, By Verticals, 2023 – 2033 ($ Million)

10.3.12.         REST OF EUROPE

10.3.12.1.     Rest of Europe: Market Size and Forecast, By Offerings, 2023 – 2033 ($ Million)

10.3.12.2.     Rest of Europe: Market Size and Forecast, By Application, 2023 – 2033 ($ Million)

10.3.12.3.     Rest of Europe: Market Size and Forecast, By Verticals, 2023 – 2033 ($ Million)

10.4. Asia Pacific

10.4.1.      Asia Pacific: Market Size and Forecast, By Country, 2023 – 2033 ($ Million)

10.4.2.      Asia Pacific: Market Size and Forecast, By Offerings, 2023 – 2033 ($ Million)

10.4.3.      Asia Pacific: Market Size and Forecast, By Application, 2023 – 2033 ($ Million)

10.4.4.      Asia Pacific: Market Size and Forecast, By Verticals, 2023 – 2033 ($ Million)

10.4.5.      CHINA

10.4.5.1.       China: Market Size and Forecast, By Offerings, 2023 – 2033 ($ Million)

10.4.5.2.       China: Market Size and Forecast, By Application, 2023 – 2033 ($ Million)

10.4.5.3.       China: Market Size and Forecast, By Verticals, 2023 – 2033 ($ Million)

10.4.6.      JAPAN

10.4.6.1.       Japan: Market Size and Forecast, By Offerings, 2023 – 2033 ($ Million)

10.4.6.2.       Japan: Market Size and Forecast, By Application, 2023 – 2033 ($ Million)

10.4.6.3.       Japan: Market Size and Forecast, By Verticals, 2023 – 2033 ($ Million)

10.4.7.      INDIA

10.4.7.1.       India: Market Size and Forecast, By Offerings, 2023 – 2033 ($ Million)

10.4.7.2.       India: Market Size and Forecast, By Application, 2023 – 2033 ($ Million)

10.4.7.3.       India: Market Size and Forecast, By Verticals, 2023 – 2033 ($ Million)

10.4.8.      SOUTH KOREA

10.4.8.1.       South Korea: Market Size and Forecast, By Offerings, 2023 – 2033 ($ Million)

10.4.8.2.       South Korea: Market Size and Forecast, By Application, 2023 – 2033 ($ Million)

10.4.8.3.       South Korea: Market Size and Forecast, By Verticals, 2023 – 2033 ($ Million)

10.4.9.           THAILAND

10.4.9.1.        Thailand: Market Size and Forecast, By Offerings, 2023 – 2033 ($ Million)

10.4.9.2.        Thailand: Market Size and Forecast, By Application, 2023 – 2033 ($ Million)

10.4.9.3.        Thailand: Market Size and Forecast, By Verticals, 2023 – 2033 ($ Million)

10.4.10.         INDONESIA

10.4.10.1.     Indonesia: Market Size and Forecast, By Offerings, 2023 – 2033 ($ Million)

10.4.10.2.     Indonesia: Market Size and Forecast, By Application, 2023 – 2033 ($ Million)

10.4.10.3.     Indonesia: Market Size and Forecast, By Verticals, 2023 – 2033 ($ Million)

10.4.11.         MALAYSIA

10.4.11.1.     Malaysia: Market Size and Forecast, By Offerings, 2023 – 2033 ($ Million)

10.4.11.2.     Malaysia: Market Size and Forecast, By Application, 2023 – 2033 ($ Million)

10.4.11.3.     Malaysia: Market Size and Forecast, By Verticals, 2023 – 2033 ($ Million)

10.4.12.         AUSTRALIA

10.4.12.1.     Australia: Market Size and Forecast, By Offerings, 2023 – 2033 ($ Million)

10.4.12.2.     Australia: Market Size and Forecast, By Application, 2023 – 2033 ($ Million)

10.4.12.3.     Australia: Market Size and Forecast, By Verticals, 2023 – 2033 ($ Million)

10.4.13.         REST FO ASIA PACIFIC

10.4.13.1.     Rest fo Asia Pacific: Market Size and Forecast, By Offerings, 2023 – 2033 ($ Million)

10.4.13.2.     Rest fo Asia Pacific: Market Size and Forecast, By Application, 2023 – 2033 ($ Million)

10.4.13.3.     Rest fo Asia Pacific: Market Size and Forecast, By Verticals, 2023 – 2033 ($ Million)

10.5. South America

10.5.1.      South America: Market Size and Forecast, By Country, 2023 – 2033 ($ Million)

10.5.2.      South America: Market Size and Forecast, By Offerings, 2023 – 2033 ($ Million)

10.5.3.      South America: Market Size and Forecast, By Application, 2023 – 2033 ($ Million)

10.5.4.      South America: Market Size and Forecast, By Verticals, 2023 – 2033 ($ Million)

10.5.5.      BRAZIL

10.5.5.1.       Brazil: Market Size and Forecast, By Offerings, 2023 – 2033 ($ Million)

10.5.5.2.       Brazil: Market Size and Forecast, By Application, 2023 – 2033 ($ Million)

10.5.5.3.       Brazil: Market Size and Forecast, By Verticals, 2023 – 2033 ($ Million)

10.5.6.      ARGENTINA

10.5.6.1.       Argentina: Market Size and Forecast, By Offerings, 2023 – 2033 ($ Million)

10.5.6.2.       Argentina: Market Size and Forecast, By Application, 2023 – 2033 ($ Million)

10.5.6.3.       Argentina: Market Size and Forecast, By Verticals, 2023 – 2033 ($ Million)

10.5.7.      REST OF SOUTH AMERICA

10.5.7.1.       Rest of South America: Market Size and Forecast, By Offerings, 2023 – 2033 ($ Million)

10.5.7.2.       Rest of South America: Market Size and Forecast, By Application, 2023 – 2033 ($ Million)

10.5.7.3.       Rest of South America: Market Size and Forecast, By Verticals, 2023 – 2033 ($ Million)

10.6. Middle East & Africa

10.6.1.      Middle East & Africa: Market Size and Forecast, By Country, 2023 – 2033 ($ Million)

10.6.2.      Middle East & Africa: Market Size and Forecast, By Offerings, 2023 – 2033 ($ Million)

10.6.3.      Middle East & Africa: Market Size and Forecast, By Application, 2023 – 2033 ($ Million)

10.6.4.      Middle East & Africa: Market Size and Forecast, By Verticals, 2023 – 2033 ($ Million)

10.6.5.      SAUDI ARABIA

10.6.5.1.       Saudi Arabia: Market Size and Forecast, By Offerings, 2023 – 2033 ($ Million)

10.6.5.2.       Saudi Arabia: Market Size and Forecast, By Application, 2023 – 2033 ($ Million)

10.6.5.3.       Saudi Arabia: Market Size and Forecast, By Verticals, 2023 – 2033 ($ Million)

10.6.6.      UAE

10.6.6.1.       UAE: Market Size and Forecast, By Offerings, 2023 – 2033 ($ Million)

10.6.6.2.       UAE: Market Size and Forecast, By Application, 2023 – 2033 ($ Million)

10.6.6.3.       UAE: Market Size and Forecast, By Verticals, 2023 – 2033 ($ Million)

10.6.7.      EGYPT

10.6.7.1.       Egypt: Market Size and Forecast, By Offerings, 2023 – 2033 ($ Million)

10.6.7.2.       Egypt: Market Size and Forecast, By Application, 2023 – 2033 ($ Million)

10.6.7.3.       Egypt: Market Size and Forecast, By Verticals, 2023 – 2033 ($ Million)

10.6.8.      SOUTH AFRICA

10.6.8.1.       South Africa: Market Size and Forecast, By Offerings, 2023 – 2033 ($ Million)

10.6.8.2.       South Africa: Market Size and Forecast, By Application, 2023 – 2033 ($ Million)

10.6.8.3.       South Africa: Market Size and Forecast, By Verticals, 2023 – 2033 ($ Million)

10.6.9.           REST OF MIDDLE EAST & AFRICA

10.6.9.1.        Rest of Middle East & Africa: Market Size and Forecast, By Offerings, 2023 – 2033 ($ Million)

10.6.9.2.        Rest of Middle East & Africa: Market Size and Forecast, By Application, 2023 – 2033 ($ Million)

10.6.9.3.        Rest of Middle East & Africa: Market Size and Forecast, By Verticals, 2023 – 2033 ($ Million)

CHAPTER 12.               Competitive Landscape

12.1. Competitior Benchmarking 2023

12.2. Market Share Analysis

12.3. Key Developments Analysis By Top 5 Companies

12.4. Market Share Acquisition Strategies: Analysis of Key Approaches Employed by Top Players

CHAPTER 13.               Company Profiles

13.1. ABB (Switzerland)

13.1.1.      Business Overview

13.1.2.      Financial Analysis

13.1.2.1.       Business Segment Revenue, 2020, 2021, 2022, $ Million

13.1.2.2.       Geographic Revenue Mix, 2022 (% Share)

13.1.3.      Product Portfolio

13.1.4.      Recent Development and Strategies Adopted

13.1.5.      SWOT Analysis

13.2. YASKAWA ELECTRIC CORPORATION (Japan)

13.3. MITSUBISHI ELECTRIC CORPORATION (JAPAN)

13.4. NACHI-FUJIKOSHI CORP. (Japan)

13.5. Comau SpA (Italy)

13.6. KUKA AG (Germany)

13.7. FANUC CORPORATION (Japan)

13.8. DENSO CORPORATION (Japan)

13.9. Kawasaki Heavy Industries, Ltd. (Japan)

13.10.   Omron Corporation (Japan)


Connect to Analyst

Connect to Analyst

Research Methodology

Research Methodology