Industrial Robotics Market Analysis and Global Forecast 2023-2033

$1,898.24$7,538.33(Approx. $ 1,390.00 - $ 5,520.00)

Industrial Robotics Market Research Report: Information By Payload (Up to 16.00 Kg, 16.01–60.00 Kg, 60.01–225.00 Kg, More Than 225.00 Kg), By Industry (Automotive, Electrical & Electronics, Metals & Machinery, Others), By Application (Handling, Assembling & Disassembling, Welding & Soldering, Others), and by Region — Forecast till 2033

Page: 135

Report Published on: October 3, 2024
$4,738.77(Approx. $ 3,470.00)
$7,538.33(Approx. $ 5,520.00)
$1,898.24(Approx. $ 1,390.00)
Description

Industrial Robotics Market Overview

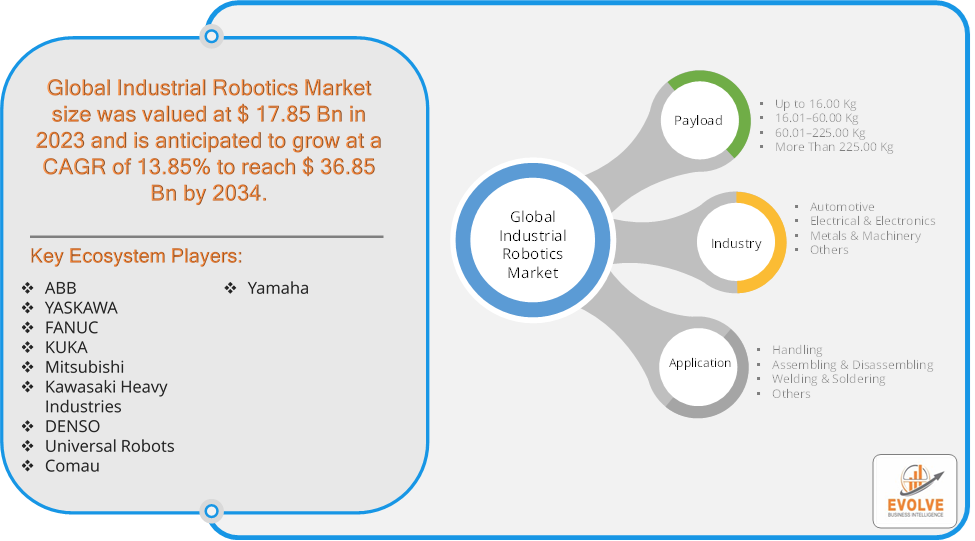
The Industrial Robotics Market Size is expected to reach USD 36.85 Billion by 2034. The Industrial Robotics Market industry size accounted for USD 17.85 Billion in 2023 and is expected to expand at a compound annual growth rate (CAGR) of 13.85% from 2021 to 2034. The Industrial Robotics Market refers to the industry focused on the production, sales, and utilization of robotic systems designed for industrial applications. These robots are used in various manufacturing processes to automate tasks, enhance productivity, improve precision, and reduce human labour.

The market is driven by technological advancements, the need for increased efficiency, and the ongoing trend towards automation in various industries.

Global Industrial Robotics Market Synopsis

Industrial Robotics MarketCOVID-19 Impact Analysis

The COVID-19 pandemic had a significant impact on the Industrial Robotics Market. The pandemic caused significant disruptions in global supply chains, impacting the availability of Components and materials needed for robotics manufacturing. This led to delays in production and increased costs. The need for social distancing and reduced human contact accelerated the adoption of automation technologies. Companies increasingly turned to industrial robots to minimize reliance on human labour and to maintain operations amidst workforce shortages. The pandemic highlighted the importance of resilient and flexible manufacturing systems. As a result, there was increased investment in robotics and automation technologies to enhance operational efficiency and adapt to future disruptions. The crisis spurred innovation in robotics, with increased focus on developing robots capable of handling new tasks related to the pandemic, such as disinfecting public spaces and delivering medical supplies.

Industrial Robotics Market Dynamics

The major factors that have impacted the growth of Industrial Robotics Market are as follows:

Drivers:

Ø  Technological Advancements

Innovations in robotics technology, such as advancements in artificial intelligence (AI), machine learning, and sensor technology, are making robots more versatile and capable. This drives demand for more advanced and capable robotic systems. As the cost of robotic systems decreases and their ROI improves, more companies are investing in robotics. The long-term cost savings from reduced labor and increased productivity make robotics a financially attractive option. Robotics allows manufacturers to scale their production capabilities, enter new markets, and handle complex tasks that require high precision and repeatability. This is essential for industries such as automotive, electronics, and aerospace.

Restraint:

  • Perception of High Initial Investment Costs and Technological Obsolescence

The cost of purchasing and installing industrial robots can be substantial. Small and medium-sized enterprises (SMEs) may find it challenging to justify the initial capital expenditure, especially if they have limited budgets. Rapid advancements in robotics technology can lead to concerns about obsolescence. Companies may be hesitant to invest in robots that could become outdated quickly due to new innovations and upgrades.

Opportunity:

⮚     Development of Modular and Flexible Robotics Solutions

There is an opportunity to develop modular and adaptable robotic systems that can be easily reconfigured for different tasks and applications. This flexibility can help companies quickly adapt to changing production requirements and market demands. Providing comprehensive training and support services for robotics users can create opportunities for growth. As businesses invest in robotics, there is a demand for training programs, technical support, and consulting services to ensure successful implementation and operation.

Industrial Robotics Market Segment Overview

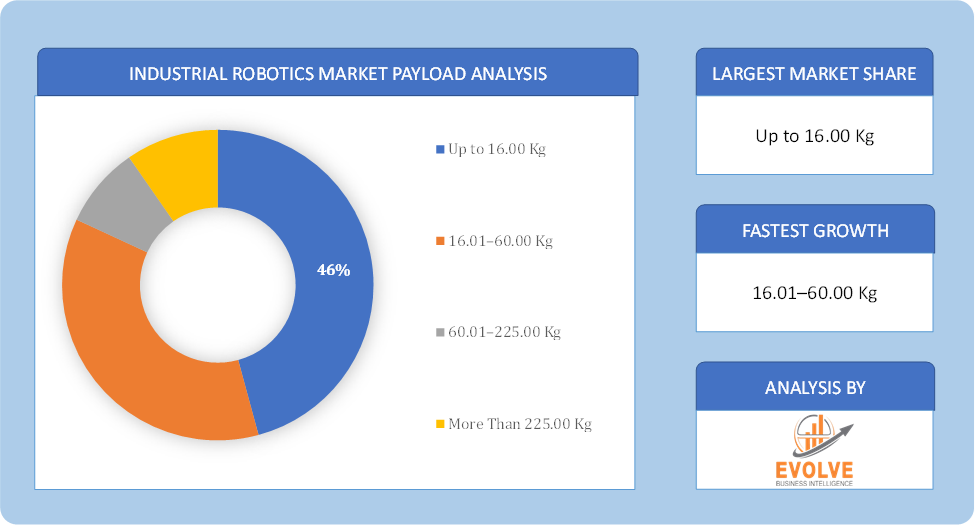
Industrial Robotics Market Payload AnalysisBy Payload

Based on Payload, the market is segmented based on Up to 16.00 Kg, 16.01–60.00 Kg, 60.01–225.00 Kg and More Than 225.00 Kg. The 16.0- 60.00 kg payload segment dominant the market. Robots in this category include collaborative, SCARA, and articulated robots. The rapidly expanding demand for automation in the electrical and electronics industry, where SCARA robots are widely employed for assembly and handling applications, is responsible for the segment’s rapid expansion in the up to 16.01-60.00 kg weight range. SCARA robots have a higher operating speed and optional cleanroom requirements.

By Industry

Based on Industry, the market segment has been divided into Automotive, Electrical & Electronics, Metals & Machinery and Others. The electronics segment dominates the market owing to its ability to carry out different activities, like, dispensing, labeling, insertion, and screw driving, with good repeatability. The increase in innovation with rising research and development efforts by the market player will increase the adoption of such robots in order to enhance productivity, cost-efficiency, and minimum manufacturing overheads.

By Application

Based on Application, the market segment has been divided into Handling, Assembling & Disassembling, Welding & Soldering and Others. The handling segment dominates the market because of the increasing drift of shopping on e-commerce and quick deliveries. The fast-developing industries, like automotive and electronics, use handling robots for handling and moving around small or heavy materials on the floor of the factories expeditiously and safely.

Global Industrial Robotics Market Regional Analysis

Based on region, the global Industrial Robotics Market has been divided into North America, Europe, Asia-Pacific, the Middle East & Africa, and Latin America. North America is projected to dominate the use of the Industrial Robotics Market followed by the Asia-Pacific and Europe regions.
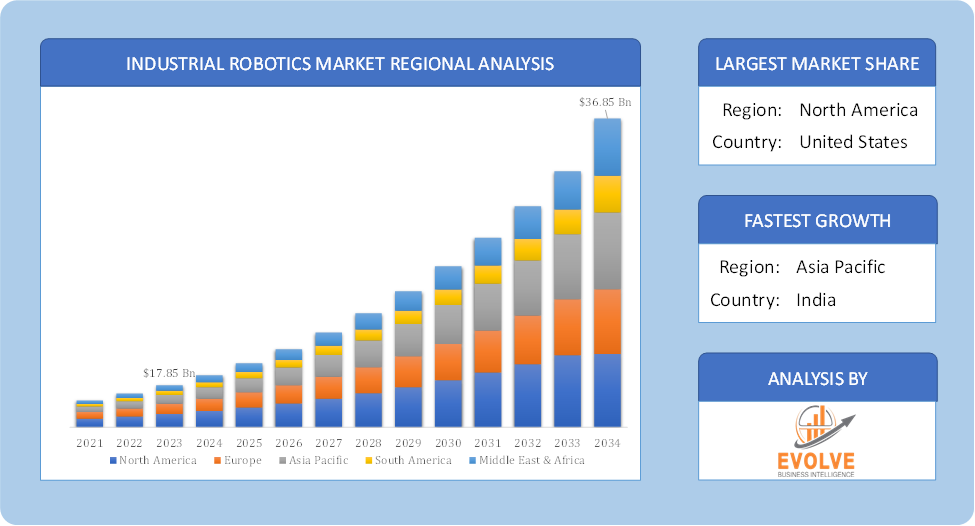
Global Industrial Robotics Market Regional AnalysisIndustrial Robotics North America Market

North America holds a dominant position in the Industrial Robotics Market. The North American market for industrial robotics is characterized by steady growth, driven by increased automation in various industries. The automotive and aerospace industries are significant drivers of robotics adoption in North America.

Industrial Robotics Asia-Pacific Market

The Asia-Pacific region has indeed emerged as the fastest-growing market for the Industrial Robotics Market industry. Asia-Pacific is the largest and fastest-growing market for industrial robotics, accounting for a significant portion of global installations. Rapid industrialization, rising labor costs, and government initiatives promoting automation in countries like China, Japan, and South Korea and China is the world’s largest market for industrial robots, followed by Japan and South Korea.

Competitive Landscape

The global Industrial Robotics Market is highly competitive, with numerous players offering a wide range of software solutions. The competitive landscape is characterized by the presence of established companies, as well as emerging startups and niche players. To increase their market position and attract a wide consumer base, the businesses are employing various strategies, such as product launches, and strategic alliances.

Prominent Players:

  • ABB
  • YASKAWA
  • FANUC
  • KUKA
  • Mitsubishi
  • Kawasaki Heavy Industries
  • DENSO
  • Universal Robots
  • Comau
  • Yamaha

Key Development

In March 2022, FANUC introduced the new CRX-5iA, CRX-20iA/L, and CRX-25iA collaborative robots. The newest CRX cobots are an addition to FANUC’s line of CR and CRX cobots, which currently includes 11 cobot model variations to handle products from 4 kg to 35 kg.

In February 2021, Kawasaki Heavy Industries, Ltd., completed a domestic automated polymerase chain reaction (PCR) test system installation in Japan that operates Kawasaki robots at Fujita Medical University in Aichi Prefecture.

Scope of the Report

Global Industrial Robotics Market, by Payload
  • Up to 16.00 Kg
  • 01–60.00 Kg
  • 01–225.00 Kg
  • More Than 225.00 Kg
Global Industrial Robotics Market, by Industry
  • Automotive
  • Electrical & Electronics
  • Metals & Machinery
  • Others
Global Industrial Robotics Market, by Application
  • Handling
  • Assembling & Disassembling
  • Welding & Soldering
  • Others
Global Industrial Robotics Market, by Region
  • North America
    • US
    • Canada
    • Mexico
  • Europe
    • UK
    • Germany
    • France
    • Italy
    • Spain
    • Benelux
    • Nordic
    • Rest of Europe
  • Asia Pacific
    • China
    • Japan
    • South Korea
    • Indonesia
    • Austalia
    • Malaysia
    • India
    • Rest of Asia Pacific
  • South America
    • Brazil
    • Argentina
    • Rest of South America
  • Middle East & Africa
    • Saudi Arabia
    • UAE
    • Egypt
    • South Africa
    • Rest of Middle East & Africa


Parameters Indicators
Market Size 2033: USD 36.85 Billion
CAGR (2023-2033) 13.85%
Base year 2022
Forecast Period 2023-2033
Historical Data 2021 (2017 to 2020 On Demand)
Report Coverage Revenue Forecast, Competitive Landscape, Growth Factors, and Trends
Key Segmentations Payload, Industry, Application
Geographies Covered North America, Europe, Asia-Pacific, South America, Middle East, Africa
Key Vendors ABB, YASKAWA, FANUC, KUKA, Mitsubishi, Kawasaki Heavy Industries, DENSO, Universal Robots, Comau and Yamaha.
Key Market Opportunities ·       Development of Modular and Flexible Robotics Solutions

·       Enhanced Training and Support Services

Key Market Drivers ·       Technological Advancements

·       Cost Reduction and Return on Investment (ROI)


REPORT CONTENT BRIEF:

  • High-level analysis of the current and future Industrial Robotics Market trends and opportunities
  • Detailed analysis of current market drivers, restraining factors, and opportunities in the future
  • Industrial Robotics Market historical market size for the year 2021, and forecast from 2023 to 2033
  • Industrial Robotics Market share analysis at each product level
  • Competitor analysis with detailed insight into its product segment, Government & Defense strength, and strategies adopted.
  • Identifies key strategies adopted including product launches and developments, mergers and acquisitions, joint ventures, collaborations, and partnerships as well as funding taken and investment done, among others.
  • To identify and understand the various factors involved in the global Industrial Robotics Market affected by the pandemic
  • To provide a detailed insight into the major companies operating in the market. The profiling will include the Government & Defense health of the company’s past 2-3 years with segmental and regional revenue breakup, product offering, recent developments, SWOT analysis, and key strategies.

Frequently Asked Questions (FAQ)

The global Industrial Robotics Market is growing at a CAGR of 13.85% over the next 10 years

Asia Pacific is expected to register the highest CAGR during 2023-2033

ABB, YASKAWA, FANUC, KUKA, Mitsubishi, Kawasaki Heavy Industries, DENSO, Universal Robots, Comau and Yamaha are the major companies operating in the market.

Yes, we offer 16 hours of analyst support to solve the queries

Yes, we provide regional as well as country-level reports. Other than this we also provide a sectional report. Please get in contact with our sales representatives.

For more details mail us at

Ask a question / additional requirement

Table of Content

Table of Content

CHAPTER 1.      Executive Summary

CHAPTER 2.      Scope of the Study

2.1.       Market Definition

2.2.       Market Scope & Segmentation

2.2.1.    Objective of Report

CHAPTER 3.         Evolve BI Methodology

3.1.       Data Collection & Validation Approach

3.2.       Market Size Estimation and Forecast

CHAPTER 4.         Exclusive Analysis

4.1.       Market Opportunity Score

4.1.1.    Payload Segement – Market Opportunity Score

4.1.2.    Industry Segment – Market Opportunity Score

4.1.3.    Application Segment – Market Opportunity Score

4.2.       Key Market Influencing Indicators

CHAPTER 5.         Market Insights and Trends

5.1.       Value Chain Analysis

5.1.1.    Raw Material

5.1.2.    Manufacturing Process

5.1.3.    Distribution Channel

5.1.4.    End User

5.2.       Porter’s Five Forces Analysis

5.2.1.    Bargaining Power of Buyers

5.2.2.    Bargaining Power of Suppliers

5.2.3.    Threat of New Entrant

5.2.4.    Threat of Substitute

5.2.5.    Industry Rivalry

5.3.       COVID-19 Impact and Post COVID Scenario on Industrial Robotics Market

5.3.1.    Impact of COVID-19

5.3.2.    Government Support and Industry Revival Policies

5.3.3.    Measures Taken by Companies to Mitigate Negative Impact

5.3.4.    Post COVID Trend

CHAPTER 6.             Market Dynamics

6.1.       Introduction

6.2.       Drivers

6.2.1.    Driver 1

6.2.2.    Driver 2

6.2.3.    Driver 3

6.3.       Restraints

6.3.1.    Restraint 1

6.3.2.    Restraint 2

6.4.       Opportunity

6.4.1.    Opportunity 1

CHAPTER 7.           Industrial Robotics Market, By Payload

7.1.       Introduction

7.1.1.    Up to 16.00 Kg

7.1.2.    16.01–60.00 Kg

7.1.3.   60.01–225.00 Kg

7.1.4.   More Than 225.00 Kg

CHAPTER 8    Industrial Robotics Market, By Industry

8.1.       Introduction

8.1.1.    Automotive

8.1.2.    Electrical & Electronics

8.1.3.    Metals & Machinery

8.1.4   Others

CHAPTER 9.     Industrial Robotics Market, By Application

9.1.       Introduction

9.1.1.    Handling

9.1.2     Assembling & Disassembling

9.1.3    Welding & Soldering

9.1.4    Others

CHAPTER 10.    Industrial Robotics Market, By Region

10.1.     Introduction

10.2.     NORTH AMERICA

10.2.1. North America: Market Size and Forecast, By Country, 2023 – 2033 ($ Million)

10.2.2. North America: Market Size and Forecast, By Industry, 2023 – 2033 ($ Million)

10.2.3. North America: Market Size and Forecast, By Payload, 2023 – 2033 ($ Million)

10.2.4. North America: Market Size and Forecast, By Application, 2023 – 2033 ($ Million)

10.2.5. US

10.2.5.1. US: Market Size and Forecast, By Industry, 2023 – 2033 ($ Million)

10.2.5.2. US: Market Size and Forecast, By Payload, 2023 – 2033 ($ Million)

10.2.5.3. US: Market Size and Forecast, By Application, 2023 – 2033 ($ Million)

10.2.6. CANADA

10.2.6.1. Canada: Market Size and Forecast, By Industry, 2023 – 2033 ($ Million)

10.2.6.2. Canada: Market Size and Forecast, By Payload, 2023 – 2033 ($ Million)

10.2.6.3. Canada: Market Size and Forecast, By Application, 2023 – 2033 ($ Million)

10.2.7. MEXICO

10.2.7.1. Mexico: Market Size and Forecast, By Industry, 2023 – 2033 ($ Million)

10.2.7.2. Mexico: Market Size and Forecast, By Payload, 2023 – 2033 ($ Million)

10.2.7.3. Mexico: Market Size and Forecast, By Application, 2023 – 2033 ($ Million)

10.3.     Europe

10.3.1. Europe: Market Size and Forecast, By Country, 2023 – 2033 ($ Million)

10.3.2. Europe: Market Size and Forecast, By Industry, 2023 – 2033 ($ Million)

10.3.3. Europe: Market Size and Forecast, By Payload, 2023 – 2033 ($ Million)

10.3.4. Europe: Market Size and Forecast, By Application, 2023 – 2033 ($ Million)

10.3.5. U.K.

10.3.5.1. U.K.: Market Size and Forecast, By Industry, 2023 – 2033 ($ Million)

10.3.5.2. U.K.: Market Size and Forecast, By Payload, 2023 – 2033 ($ Million)

10.3.5.3. U.K.: Market Size and Forecast, By Application, 2023 – 2033 ($ Million)

10.3.6. GERMANY

10.3.6.1. Germany: Market Size and Forecast, By Industry, 2023 – 2033 ($ Million)

10.3.6.2. Germany: Market Size and Forecast, By Payload, 2023 – 2033 ($ Million)

10.3.6.3. Germany: Market Size and Forecast, By Application, 2023 – 2033 ($ Million)

10.3.7. FRANCE

10.3.7.1. France: Market Size and Forecast, By Industry, 2023 – 2033 ($ Million)

10.3.7.2. France: Market Size and Forecast, By Payload, 2023 – 2033 ($ Million)

10.3.7.3. France: Market Size and Forecast, By Application, 2023 – 2033 ($ Million)

10.3.8. ITALY

10.3.8.1. Italy: Market Size and Forecast, By Industry, 2023 – 2033 ($ Million)

10.3.8.2. Italy: Market Size and Forecast, By Payload, 2023 – 2033 ($ Million)

10.3.8.3. Italy: Market Size and Forecast, By Application, 2023 – 2033 ($ Million)

10.3.9. SPAIN

10.3.9.1. Spain: Market Size and Forecast, By Industry, 2023 – 2033 ($ Million)

10.3.9.2. Spain: Market Size and Forecast, By Payload, 2023 – 2033 ($ Million)

10.3.9.3. Spain: Market Size and Forecast, By Application, 2023 – 2033 ($ Million)

10.3.10. BENELUX

10.3.10.1. BeNeLux: Market Size and Forecast, By Industry, 2023 – 2033 ($ Million)

10.3.10.2. BeNeLux: Market Size and Forecast, By Payload, 2023 – 2033 ($ Million)

10.3.10.3. BeNeLux: Market Size and Forecast, By Application, 2023 – 2033 ($ Million)

10.3.11. RUSSIA

10.3.11.1. Russia: Market Size and Forecast, By Industry, 2023 – 2033 ($ Million)

10.3.11.2. Russia: Market Size and Forecast, By Payload, 2023 – 2033 ($ Million)

10.3.11.3. Russia: Market Size and Forecast, By Application, 2023 – 2033 ($ Million)

10.3.12. REST OF EUROPE

10.3.12.1. Rest of Europe: Market Size and Forecast, By Industry, 2023 – 2033 ($ Million)

10.3.12.2. Rest of Europe: Market Size and Forecast, By Payload, 2023 – 2033 ($ Million)

10.3.12.3. Rest of Europe: Market Size and Forecast, By Application, 2023 – 2033 ($ Million)

10.4.     Asia Pacific

10.4.1. Asia Pacific: Market Size and Forecast, By Country, 2023 – 2033 ($ Million)

10.4.2. Asia Pacific: Market Size and Forecast, By Industry, 2023 – 2033 ($ Million)

10.4.3. Asia Pacific: Market Size and Forecast, By Payload, 2023 – 2033 ($ Million)

10.4.4. Asia Pacific: Market Size and Forecast, By Application, 2023 – 2033 ($ Million)

10.4.5. CHINA

10.4.5.1. China: Market Size and Forecast, By Industry, 2023 – 2033 ($ Million)

10.4.5.2. China: Market Size and Forecast, By Payload, 2023 – 2033 ($ Million)

10.4.5.3. China: Market Size and Forecast, By Application, 2023 – 2033 ($ Million)

10.4.6. JAPAN

10.4.6.1. Japan: Market Size and Forecast, By Industry, 2023 – 2033 ($ Million)

10.4.6.2. Japan: Market Size and Forecast, By Payload, 2023 – 2033 ($ Million)

10.4.6.3. Japan: Market Size and Forecast, By Application, 2023 – 2033 ($ Million)

10.4.7. INDIA

10.4.7.1. India: Market Size and Forecast, By Industry, 2023 – 2033 ($ Million)

10.4.7.2. India: Market Size and Forecast, By Payload, 2023 – 2033 ($ Million)

10.4.7.3. India: Market Size and Forecast, By Application, 2023 – 2033 ($ Million)

10.4.8. SOUTH KOREA

10.4.8.1. South Korea: Market Size and Forecast, By Industry, 2023 – 2033 ($ Million)

10.4.8.2. South Korea: Market Size and Forecast, By Payload, 2023 – 2033 ($ Million)

10.4.8.3. South Korea: Market Size and Forecast, By Application, 2023 – 2033 ($ Million)

10.4.9. THAILAND

10.4.9.1. Thailand: Market Size and Forecast, By Industry, 2023 – 2033 ($ Million)

10.4.9.2. Thailand: Market Size and Forecast, By Payload, 2023 – 2033 ($ Million)

10.4.9.3. Thailand: Market Size and Forecast, By Application, 2023 – 2033 ($ Million)

10.4.10. INDONESIA

10.4.10.1. Indonesia: Market Size and Forecast, By Industry, 2023 – 2033 ($ Million)

10.4.10.2. Indonesia: Market Size and Forecast, By Payload, 2023 – 2033 ($ Million)

10.4.10.3. Indonesia: Market Size and Forecast, By Application, 2023 – 2033 ($ Million)

10.4.11. MALAYSIA

10.4.11.1. Malaysia: Market Size and Forecast, By Industry, 2023 – 2033 ($ Million)

10.4.11.2. Malaysia: Market Size and Forecast, By Payload, 2023 – 2033 ($ Million)

10.4.11.3. Malaysia: Market Size and Forecast, By Application, 2023 – 2033 ($ Million)

10.4.12. AUSTRALIA

10.4.12.1. Australia: Market Size and Forecast, By Industry, 2023 – 2033 ($ Million)

10.4.12.2. Australia: Market Size and Forecast, By Payload, 2023 – 2033 ($ Million)

10.4.12.3. Australia: Market Size and Forecast, By Application, 2023 – 2033 ($ Million)

10.4.13. REST FO ASIA PACIFIC

10.4.13.1. Rest fo Asia Pacific: Market Size and Forecast, By Industry, 2023 – 2033 ($ Million)

10.4.13.2. Rest fo Asia Pacific: Market Size and Forecast, By Payload, 2023 – 2033 ($ Million)

10.4.13.3. Rest fo Asia Pacific: Market Size and Forecast, By Application, 2023 – 2033 ($ Million)

10.5.     South America

10.5.1. South America: Market Size and Forecast, By Country, 2023 – 2033 ($ Million)

10.5.2. South America: Market Size and Forecast, By Industry, 2023 – 2033 ($ Million)

10.5.3. South America: Market Size and Forecast, By Payload, 2023 – 2033 ($ Million)

10.5.4. South America: Market Size and Forecast, By Application, 2023 – 2033 ($ Million)

10.5.5. BRAZIL

10.5.5.1. Brazil: Market Size and Forecast, By Industry, 2023 – 2033 ($ Million)

10.5.5.2. Brazil: Market Size and Forecast, By Payload, 2023 – 2033 ($ Million)

10.5.5.3. Brazil: Market Size and Forecast, By Application, 2023 – 2033 ($ Million)

10.5.6. ARGENTINA

10.5.6.1. Argentina: Market Size and Forecast, By Industry, 2023 – 2033 ($ Million)

10.5.6.2. Argentina: Market Size and Forecast, By Payload, 2023 – 2033 ($ Million)

10.5.6.3. Argentina: Market Size and Forecast, By Application, 2023 – 2033 ($ Million)

10.5.7. REST OF SOUTH AMERICA

10.5.7.1. Rest of South America: Market Size and Forecast, By Industry, 2023 – 2033 ($ Million)

10.5.7.2. Rest of South America: Market Size and Forecast, By Payload, 2023 – 2033 ($ Million)

10.5.7.3. Rest of South America: Market Size and Forecast, By Application, 2023 – 2033 ($ Million)

10.6.     Middle East & Africa

10.6.1. Middle East & Africa: Market Size and Forecast, By Country, 2023 – 2033 ($ Million)

10.6.2. Middle East & Africa: Market Size and Forecast, By Industry, 2023 – 2033 ($ Million)

10.6.3. Middle East & Africa: Market Size and Forecast, By Payload, 2023 – 2033 ($ Million)

10.6.4. Middle East & Africa: Market Size and Forecast, By Application, 2023 – 2033 ($ Million)

10.6.5. SAUDI ARABIA

10.6.5.1. Saudi Arabia: Market Size and Forecast, By Industry, 2023 – 2033 ($ Million)

10.6.5.2. Saudi Arabia: Market Size and Forecast, By Payload, 2023 – 2033 ($ Million)

10.6.5.3. Saudi Arabia: Market Size and Forecast, By Application, 2023 – 2033 ($ Million)

10.6.6. UAE

10.6.6.1. UAE: Market Size and Forecast, By Industry, 2023 – 2033 ($ Million)

10.6.6.2. UAE: Market Size and Forecast, By Payload, 2023 – 2033 ($ Million)

10.6.6.3. UAE: Market Size and Forecast, By Application, 2023 – 2033 ($ Million)

10.6.7. EGYPT

10.6.7.1. Egypt: Market Size and Forecast, By Industry, 2023 – 2033 ($ Million)

10.6.7.2. Egypt: Market Size and Forecast, By Payload, 2023 – 2033 ($ Million)

10.6.7.3. Egypt: Market Size and Forecast, By Application, 2023 – 2033 ($ Million)

10.6.8. SOUTH AFRICA

10.6.8.1. South Africa: Market Size and Forecast, By Industry, 2023 – 2033 ($ Million)

10.6.8.2. South Africa: Market Size and Forecast, By Payload, 2023 – 2033 ($ Million)

10.6.8.3. South Africa: Market Size and Forecast, By Application, 2023 – 2033 ($ Million)

10.6.9. REST OF MIDDLE EAST & AFRICA

10.6.9.1. Rest of Middle East & Africa: Market Size and Forecast, By Industry, 2023 – 2033 ($ Million)

10.6.9.2. Rest of Middle East & Africa: Market Size and Forecast, By Payload, 2023 – 2033 ($ Million)

10.6.9.3. Rest of Middle East & Africa: Market Size and Forecast, By Application, 2023 – 2033 ($ Million)

CHAPTER 12. Competitive Landscape

12.1.     Competitior Benchmarking 2023

12.2.     Market Share Analysis

12.3.     Key Developments Analysis By Top 5 Companies

12.4.     Market Share Acquisition Strategies: Analysis of Key Approaches Employed by Top Players

CHAPTER 13. Company Profiles

13.1.     ABB

13.1.1. Hanon Systems

13.1.2. Financial Analysis

13.1.2.1. Business Segment Revenue, 2020, 2021, 2022, $ Million

13.1.2.2. Geographic Revenue Mix, 2022 (% Share)

13.1.3. Product Portfolio

13.1.4. Recent Development and Strategies Adopted

13.1.5. SWOT Analysis

13.2.     YASKAWA

13.3.     FANUC

13.4.     KUKA

13.5.     Mitsubishi

13.6.     Kawasaki Heavy Industries

13.7.     DENSO

13.8.     Universal Robots

13.9      Comau

13.10    Yamaha


Connect to Analyst

Connect to Analyst

Research Methodology

Research Methodology