Hydrographic Survey Equipment Market Analysis and Global Forecast 2023-2033
$ 1,390.00 – $ 5,520.00
Hydrographic Survey Equipment Market Research Report: By Platform (Surface Vehicles, UUVs & USVs, Aircraft), By Type (Sensing Systems, Positioning Systems, Subsea Sensors, Others), By Application (Charting Application, Offshore Oil & Gas Survey, Port & Harbor Management, Others), and by Region — Forecast till 2033
Page: 157
Hydrographic Survey Equipment Market Overview
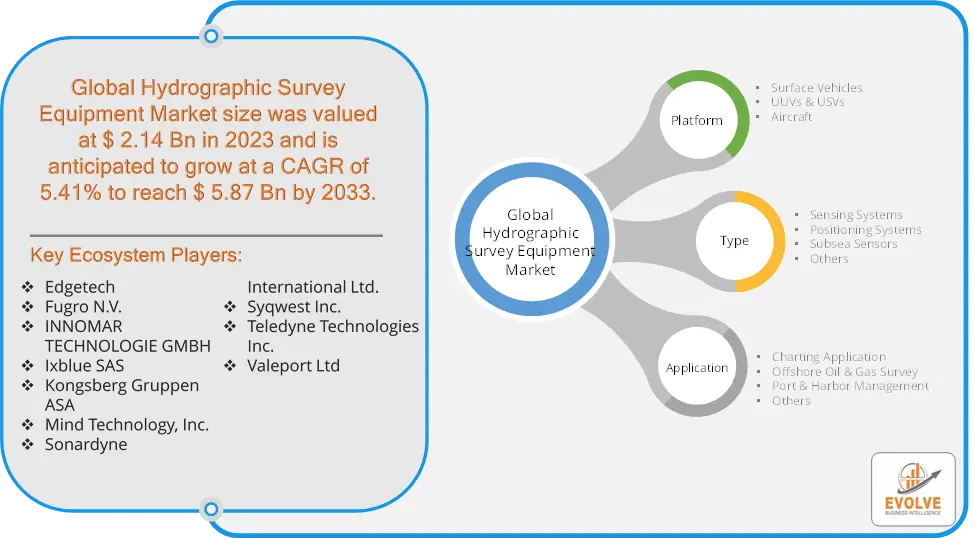
The Hydrographic Survey Equipment Market Size is expected to reach USD 5.87 Billion by 2033. The Hydrographic Survey Equipment industry size accounted for USD 2.14 Billion in 2023 and is expected to expand at a compound annual growth rate (CAGR) of 5.41% from 2023 to 2033. The Hydrographic Survey Equipment Market encompasses a range of tools and technologies used to measure and describe the physical features of oceans, seas, coastal areas, lakes, and rivers. This market includes products such as echo sounders, GNSS/GPS, multi-beam and single-beam sonars, LiDAR, and others that provide critical data for applications like navigation, dredging, offshore oil and gas exploration, and underwater construction. Advances in technology and increasing demand for accurate, real-time data are driving growth in this market.
Global Hydrographic Survey Equipment Market Synopsis
The COVID-19 pandemic has led to supply chain disruptions leading to supply shortages or lower demand in the Hydrographic Survey Equipment market. The travel restrictions and social-distancing measures have resulted in a sharp drop in consumer and business spending and this pattern is to continue for some time. The end-user trend and preferences have changed due to the pandemic and have resulted in manufacturers, developers, and service providers to adopt various strategies to stabilize the company
Global Hydrographic Survey Equipment Market Dynamics
The major factors that have impacted the growth of Hydrographic Survey Equipment are as follows:
Drivers:
⮚ Technological Advancements
Innovations in survey technologies, such as multi-beam and single-beam sonar, LiDAR, and autonomous survey vehicles, have significantly improved the accuracy, efficiency, and cost-effectiveness of hydrographic surveys. These advancements enable more comprehensive data collection and analysis, enhancing the overall value of hydrographic survey equipment.
Restraint:
- Data Privacy and Security Concerns
The collection and handling of hydrographic data raise issues related to data privacy and security. Sensitive data, particularly in defense and strategic sectors, require robust security measures to prevent unauthorized access and misuse. Ensuring data protection can add complexity and costs to survey operations.
Opportunity:
⮚ Rising Demand for Inland Waterway Surveys
The increasing utilization of inland waterways for transportation, tourism, and water resource management is creating opportunities for hydrographic surveys. Accurate mapping of rivers, lakes, and reservoirs is essential for safe navigation, flood management, and water quality monitoring, boosting demand for specialized survey equipment.
Hydrographic Survey Equipment Market Segment Overview
By Platform
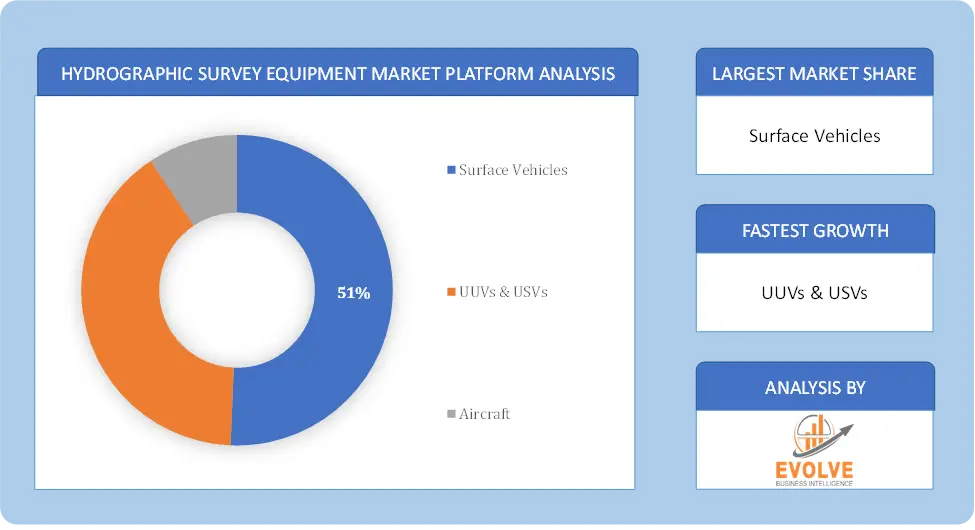
Based on the Platform, the market is segmented based on Surface Vehicles, UUVs & USVs, Aircraft. the Surface Vehicles segment typically dominates as they are widely used for a range of hydrographic survey operations, providing a stable platform for deploying various survey equipment.
By Type
Based on the Type, the market has been divided into Sensing Systems, Positioning Systems, Subsea Sensors, Others. the Sensing Systems segment generally dominates as these systems, including multi-beam and single-beam sonars, are essential for collecting detailed underwater data crucial for various applications.
By Application
Based on Application, the market has been divided into Charting Application, Offshore Oil & Gas Survey, Port & Harbor Management, Others. the Offshore Oil & Gas Survey segment typically dominates due to the critical need for accurate seabed mapping and underwater inspections to support exploration and extraction activities.
Global Hydrographic Survey Equipment Market Regional Analysis
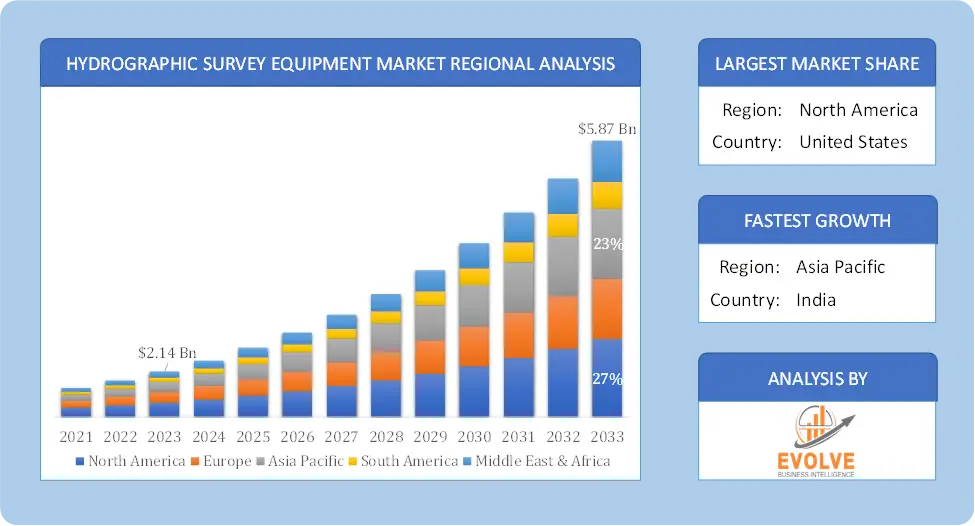
Based on region, the market has been divided into North America, Europe, Asia-Pacific, the Middle East & Africa, and Latin America. The area of North America is anticipated to dominate the market for the usage of Hydrographic Survey Equipment, followed by those in Asia-Pacific and Europe.
Hydrographic Survey Equipment North America Market
North America dominates the Hydrographic Survey Equipment market due to several factors. North America dominated the global hydrographic survey equipment market in 2019 due to the presence of prominent technology companies such as Teledyne Technologies Inc. and Mitcham Industries Inc.
Hydrographic Survey Equipment Asia Pacific Market
The Asia-Pacific region has been witnessing remarkable growth in recent years. The Hydrographic Survey Equipment Market in this region is projected to register the highest CAGR during the forecast period. The growing maritime trade among developing countries such as India and China is driving the market growth in the region. Increasing investments by prominent oil & gas companies in hydrographic survey equipment is expected to drive the market growth in the region.
Competitive Landscape
The competitive landscape includes key players (tier 1, tier 2, and local) having a presence across the globe. Companies such as Edgetech, Fugro N.V., INNOMAR TECHNOLOGIE GMBH, Ixblue SAS, and Kongsberg Gruppen ASA are some of the leading players in the global Hydrographic Survey Equipment Industry. These players have adopted partnership, acquisition, expansion, and new product development, among others as their key strategies.
Key Market Players:
- Edgetech
- Fugro N.V.
- INNOMAR TECHNOLOGIE GMBH
- Ixblue SAS
- Kongsberg Gruppen ASA
- Mind Technology, Inc.
- Sonardyne International Ltd.
- Syqwest Inc.
- Teledyne Technologies Inc.
- Valeport Ltd
Key development:
In September 2022, Kongsberg Gruppen ASA made significant advancements in the hydrographic survey equipment market. The company introduced enhanced versions of their existing hydrographic survey systems, focusing on improving data accuracy and operational efficiency. They also announced collaborations with various maritime organizations to develop integrated solutions for more comprehensive and efficient underwater mapping.
Scope of the Report
Global Hydrographic Survey Equipment Market, by Platform
- Surface Vehicles
- UUVs & USVs
- Aircraft
Global Hydrographic Survey Equipment Market, by Type
- Sensing Systems
- Positioning Systems
- Subsea Sensors
- Others
Global Hydrographic Survey Equipment Market, by Application
- Charting Application
- Offshore Oil & Gas Survey
- Port & Harbor Management
- Others
Global Hydrographic Survey Equipment Market, by Region
- North America
- US
- Canada
- Mexico
- Europe
- UK
- Germany
- France
- Italy
- Spain
- Benelux
- Nordic
- Rest of Europe
- Asia Pacific
- China
- Japan
- South Korea
- Indonesia
- Austalia
- Malaysia
- India
- Rest of Asia Pacific
- South America
- Brazil
- Argentina
- Rest of South America
- Middle East & Africa
- Saudi Arabia
- UAE
- Egypt
- South Africa
- Rest of Middle East & Africa
Parameters | Indicators |
---|---|
Market Size | 2033: $5.87 Billion |
CAGR | 5.41% CAGR (2023-2033) |
Base year | 2022 |
Forecast Period | 2023-2033 |
Historical Data | 2021 |
Report Coverage | Revenue Forecast, Competitive Landscape, Growth Factors, and Trends |
Key Segmentations | Platform, Type, Application |
Geographies Covered | North America, Europe, Asia-Pacific, Latin America, Middle East, Africa |
Key Vendors | Edgetech, Fugro N.V., INNOMAR TECHNOLOGIE GMBH, Ixblue SAS, Kongsberg Gruppen ASA, Mind Technology, Inc., Sonardyne International Ltd., Syqwest Inc., Teledyne Technologies Inc., Valeport Ltd |
Key Market Opportunities | • Increasing investments in autonomous vessels with advanced technologies |
Key Market Drivers | • Increasing Maritime Trade. • A Rise in the Demand for Accurate Nautical Charts • Increasing Use of UUVs and USVs |
REPORT CONTENT BRIEF:
- High-level analysis of the current and future Hydrographic Survey Equipment Industry trends and opportunities
- Detailed analysis of current market drivers, restraining factors, and opportunities analysis in the future
- Historical market size for the year 2021, and forecast from 2023 to 2033
- Hydrographic Survey Equipment market share analysis for each segment
- Competitor analysis with a comprehensive insight into its product segment, financial strength, and strategies adopted.
- Identifies key strategies adopted by the key players including new product development, mergers and acquisitions, joint ventures, collaborations, and partnerships.
- To identify and understand the various factors involved in the global Hydrographic Survey Equipment market affected by the pandemic
- To provide year-on-year growth from 2022 to 2033
- To provide short-term, long-term, and overall CAGR comparison from 2022 to 2033.
- Provide Total Addressable Market (TAM) for the Global Hydrographic Survey Equipment Market.
Press Release
Memory Chip Market Estimated to Grow at a CAGR of 10.53% During the Forecast Period
Green Ammonia Market Projected to Reach USD 146.45 Billion by 2034, Growing at a CAGR of 72.14%
AI Chipset Market to Reach $2393.2 Billion by 2033 | 7.82% CAGR
Travel Insurance Market Soars: 20.14% CAGR
Smart Oilfield Market: 5.14% CAGR Expected
Catalog Management Systems Market Grows: 9.47% CAGR
Secondary Ticket Market Grows: 9.68% CAGR
Private Health Insurance Market: 5.12% CAGR Expected
Digital Content Market Surges: 12.63% CAGR
Crunchy Chocolates Market: 5.10% CAGR Expected
Frequently Asked Questions (FAQ)
What is the study period of this market?
The study period of the global Hydrographic Survey Equipment market is 2022- 2033
What are the 10 Years CAGR (2023 to 2033) of the global Hydrographic Survey Equipment market?
The global Hydrographic Survey Equipment market is growing at a CAGR of ~5.41% over the next 10 years
Which region has the highest growth rate in the market of Hydrographic Survey Equipment?
Asia Pacific is expected to register the highest CAGR during 2023-2033
Which region accounted for the largest share of the market of Hydrographic Survey Equipment?
North America holds the largest share in 2022
Major Key Players in the Market of Stem Cell Manufacturers?
Edgetech, Fugro N.V., INNOMAR TECHNOLOGIE GMBH, Ixblue SAS, Kongsberg Gruppen ASA, Mind Technology, Inc., Sonardyne International Ltd., Syqwest Inc., Teledyne Technologies Inc., Valeport Ltd
Do you offer Post Sale Support?
Yes, we offer 16 hours of analyst support to solve the queries
Do you deliver sections of a report?
Yes, we do provide regional as well as country-level reports. Other than this we also provide a sectional report. Please get in contact with our sales representatives
Table of Content
Chapter 1. Executive Summary Chapter 2. Scope Of The Study 2.1. Market Definition 2.2. Scope Of The Study 2.2.1. Objectives of Report Chapter 3. Evolve BI Methodology Chapter 4. Market Insights and Trends 4.1. Supply/ Value Chain Analysis 4.2. Porter’s Five Forces Analysis 4.2.1. Threat Of New Entrants 4.2.2. Bargaining Power Of Buyers 4.2.3. Bargaining Power Of Suppliers 4.2.4. Threat Of Substitutes 4.2.5. Industry Rivalry 4.3. Impact of COVID-19 on Hydrographic Survey Equipment Market 4.3.1. Impact on Market Size 4.3.2. End User Trend, Preferences and Budget Impact 4.3.3. Regulatory Framework/Government Policies 4.3.4. Key Players Strategy to Tackle Negative Impact 4.3.5. Opportunity Window Chapter 5. Market Dynamics 5.1. Introduction 5.2. DRO Analysis 5.2.1. Drivers 5.2.2. Restraints 5.2.3. Opportunities Chapter 6. Global Hydrographic Survey Equipment Market, By Platform 6.1. Introduction 6.2. Surface Vehicles 6.3. UUVs & USVs 6.4. Aircraft Chapter 7. Global Hydrographic Survey Equipment Market, By Type 7.1. Introduction 7.2. Sensing Systems 7.3. Positioning Systems 7.4. Subsea Sensors 7.5. Others Chapter 8. Global Hydrographic Survey Equipment Market, By Application 8.1. Introduction 8.2. Charting Application 8.3. Offshore Oil & Gas Survey 8.4. Port & Harbor Management 8.5. Others Chapter 9. Global Hydrographic Survey Equipment Market, By Region 9.1. Introduction 9.2. North America 9.2.1. Introduction 9.2.2. Driving Factors, Opportunity Analyzed and Key Trends 9.2.3. Market Size and Forecast, By Country, 2020 - 2028 9.2.4. Market Size and Forecast, By Platform, 2020 - 2028 9.2.5. Market Size and Forecast, By Type, 2020 – 2028 9.2.6. Market Size and Forecast, By Application, 2020 – 2028 9.2.7. US 9.2.7.1. Introduction 9.2.7.2. Driving Factors, Opportunity Analyzed and Key Trends 9.2.7.3. Market Size and Forecast, By Platform, 2020 - 2028 9.2.7.4. Market Size and Forecast, By Type, 2020 – 2028 9.2.7.5. Market Size and Forecast, By Application, 2020 - 2028 9.2.8. Canada 9.2.8.1. Introduction 9.2.8.2. Driving Factors, Opportunity Analyzed and Key Trends 9.2.8.4. Market Size and Forecast, By Platform, 2020 - 2028 9.2.8.5. Market Size and Forecast, By Type, 2020 – 2028 9.2.8.6. Market Size and Forecast, By Application, 2020 - 2028 9.3. Europe 9.3.1. Introduction 9.3.2. Driving Factors, Opportunity Analyzed and Key Trends 9.3.3. Market Size and Forecast, By Country, 2020 - 2028 9.3.4. Market Size and Forecast, By Platform, 2020 - 2028 9.3.5. Market Size and Forecast, By Type, 2020 – 2028 9.3.6. Market Size and Forecast, By Application, 2020 – 2028 9.3.7. Germany 9.3.7.1. Introduction 9.3.7.2. Driving Factors, Opportunity Analyzed and Key Trends 9.3.7.3. Market Size and Forecast, By Platform, 2020 - 2028 9.3.7.4. Market Size and Forecast, By Type, 2020 – 2028 9.3.7.5. Market Size and Forecast, By Application, 2020 - 2028 9.3.8. France 9.3.8.1. Introduction 9.3.8.2. Driving Factors, Opportunity Analyzed and Key Trends 9.3.8.3. Market Size and Forecast, By Platform, 2020 - 2028 9.3.8.4. Market Size and Forecast, By Type, 2020 – 2028 9.3.8.5. Market Size and Forecast, By Application, 2020 - 2028 9.3.9. UK 9.3.9.1. Introduction 9.3.9.2. Driving Factors, Opportunity Analyzed and Key Trends 9.3.9.3. Market Size and Forecast, By Platform, 2020 - 2028 9.3.9.4. Market Size and Forecast, By Type, 2020 – 2028 9.3.9.5. Market Size and Forecast, By Application, 2020 - 2028 9.3.10. Italy 9.3.10.1. Introduction 9.3.10.2. Driving Factors, Opportunity Analyzed and Key Trends 9.3.10.3. Market Size and Forecast, By Platform, 2020 - 2028 9.3.10.4. Market Size and Forecast, By Type, 2020 – 2028 9.3.10.5. Market Size and Forecast, By Application, 2020 - 2028 9.3.11. Rest Of Europe 9.3.11.1. Introduction 9.3.11.2. Driving Factors, Opportunity Analyzed and Key Trends 9.3.11.3. Market Size and Forecast, By Platform, 2020 - 2028 9.3.11.4. Market Size and Forecast, By Type, 2020 – 2028 9.3.11.5. Market Size and Forecast, By Application, 2020 - 2028 9.4. Asia-Pacific 9.4.1. Introduction 9.4.2. Driving Factors, Opportunity Analyzed and Key Trends 9.4.3. Market Size and Forecast, By Country, 2020 - 2028 9.4.4. Market Size and Forecast, By Platform, 2020 - 2028 9.4.5. Market Size and Forecast, By Type, 2020 – 2028 9.4.7. Market Size and Forecast, By Application, 2020 - 2028 9.4.8. China 9.4.8.1. Introduction 9.4.8.2. Driving Factors, Opportunity Analyzed and Key Trends 9.4.8.3. Market Size and Forecast, By Platform, 2020 - 2028 9.4.8.4. Market Size and Forecast, By Type, 2020 – 2028 9.4.8.5. Market Size and Forecast, By Application, 2020 - 2028 9.4.9. India 9.4.9.1. Introduction 9.4.9.2. Driving Factors, Opportunity Analyzed and Key Trends 9.4.9.3. Market Size and Forecast, By Platform, 2020 - 2028 9.4.9.4. Market Size and Forecast, By Type, 2020 – 2028 9.4.9.5. Market Size and Forecast, By Application, 2020 - 2028 9.4.10. Japan 9.4.10.1. Introduction 9.4.10.2. Driving Factors, Opportunity Analyzed and Key Trends 9.4.10.3. Market Size and Forecast, By Platform, 2020 - 2028 9.4.10.4. Market Size and Forecast, By Type, 2020 – 2028 9.4.10.5. Market Size and Forecast, By Application, 2020 - 2028 9.4.11. South Korea 9.4.11.1. Introduction 9.4.11.2. Driving Factors, Opportunity Analyzed and Key Trends 9.4.11.3. Market Size and Forecast, By Platform, 2020 - 2028 9.4.11.4. Market Size and Forecast, By Type, 2020 – 2028 9.4.11.5. Market Size and Forecast, By Application, 2020 - 2028 9.4.12. Rest Of Asia-Pacific 9.4.11.1. Introduction 9.4.12.2. Driving Factors, Opportunity Analyzed and Key Trends 9.4.12.3. Market Size and Forecast, By Platform, 2020 - 2028 9.4.12.4. Market Size and Forecast, By Type, 2020 – 2028 9.4.12.5. Market Size and Forecast, By Application, 2020 - 2028 9.5. Rest Of The World (RoW) 9.5.1. Introduction 9.5.2. Driving Factors, Opportunity Analyzed and Key Trends 9.5.3. Market Size and Forecast, By Platform, 2020 - 2028 9.5.4. Market Size and Forecast, By Type, 2020 – 2028 9.5.5. Market Size and Forecast, By Application, 2020 - 2028 9.5.6. Market Size and Forecast, By Region, 2020 - 2028 9.5.7. South America 9.5.7.1. Introduction 9.5.7.2. Driving Factors, Opportunity Analyzed and Key Trends 9.5.7.3. Market Size and Forecast, By Platform, 2020 - 2028 9.5.7.4. Market Size and Forecast, By Type, 2020 – 2028 9.5.7.5. Market Size and Forecast, By Application, 2020 - 2028 9.5.8. Middle East & Africa 9.5.8.1. Introduction 9.5.8.2. Driving Factors, Opportunity Analyzed and Key Trends 9.5.8.3. Market Size and Forecast, By Platform, 2020 - 2028 9.5.8.4. Market Size and Forecast, By Type, 2020 – 2028 9.5.8.5. Market Size and Forecast, By Application, 2020 - 2028 Chapter 10. Competitive Landscape 10.1. Introduction 10.2. Vendor Share Analysis, 2020/Key Players Positioning 2020 Chapter 11. Company Profiles 11.1. Edgetech 11.1.1. Business Overview 11.1.2. Financial Analysis 11.1.3. Product Portfolio 11.1.4. Recent Development and Strategies Adopted 11.1.5. SWOT Analysis 11.2. Fugro N.V. 11.2.1. Business Overview 11.2.2. Financial Analysis 11.2.3. Product Portfolio 11.2.4. Recent Development and Strategies Adopted 11.2.5. SWOT Analysis 11.3. Innomar Technologie GmbH 11.3.1. Business Overview 11.3.2. Financial Analysis 11.3.3. Product Portfolio 11.3.4. Recent Development and Strategies Adopted 11.3.5. SWOT Analysis 11.4. Ixblue SAS 11.4.1. Business Overview 11.4.2. Financial Analysis 11.4.3. Product Portfolio 11.4.4. Recent Development and Strategies Adopted 11.4.5. SWOT Analysis 11.5. Kongsberg Gruppen ASA 11.5.1. Business Overview 11.5.2. Financial Analysis 11.5.3. Product Portfolio 11.5.4. Recent Development and Strategies Adopted 11.5.5. SWOT Analysis 11.6. Mind Technology, Inc. 11.6.1. Business Overview 11.6.2. Financial Analysis 11.6.3. Product Portfolio 11.6.4. Recent Development and Strategies Adopted 11.6.5. SWOT Analysis 11.7. Sonardyne International Ltd. 11.7.1. Business Overview 11.7.2. Financial Analysis 11.7.3. Product Portfolio 11.7.4. Recent Development and Strategies Adopted 11.7.5. SWOT Analysis 11.8. Syqwest Inc. 11.8.1. Business Overview 11.8.2. Financial Analysis 11.8.3. Product Portfolio 11.8.4. Recent Development and Strategies Adopted 11.8.5. SWOT Analysis 11.9. Teledyne Technologies Inc. 11.9.1. Business Overview 11.9.2. Financial Analysis 11.9.3. Product Portfolio 11.9.4. Recent Development and Strategies Adopted 11.9.5. SWOT Analysis 11.10. Valeport Ltd 11.10.1. Business Overview 11.10.2. Financial Analysis 11.10.3. Product Portfolio 11.9.4. Recent Development and Strategies Adopted 11.9.5. SWOT Analysis Chapter 12. Key Takeaways