Ferric Chloride Market Analysis and Global Forecast 2024-2034

$ 1,390.00$ 5,520.00(Approx. € 1,230.43 - € 4,886.30)

Ferric Chloride Market Research Report: Information By Grade (Anhydrous, Ferric Chloride Hexahydrate Lumps, and Ferric Chloride Liquid), By Application (Wastewater Treatment, Metal Surface Treatment, Potable Water Treatment, Electronic Etchants, Printed Circuit Boards, Pigment Manufacturing, Catalyst, Asphalt Blowing), By End-Use Industry (Pharmaceuticals, Chemicals, Electronics, Metals & Metallurgy, Municipal Wastewater Treatment, Municipal Potable Water Treatment), and by Region — Forecast till 2034

Page: 165

Report Published on: April 23, 2025
$ 3,470.00(Approx. € 3,071.64)
$ 5,520.00(Approx. € 4,886.30)
$ 1,390.00(Approx. € 1,230.43)
Report Code: EBI57878 Category:
Description

Ferric Chloride Market Overview

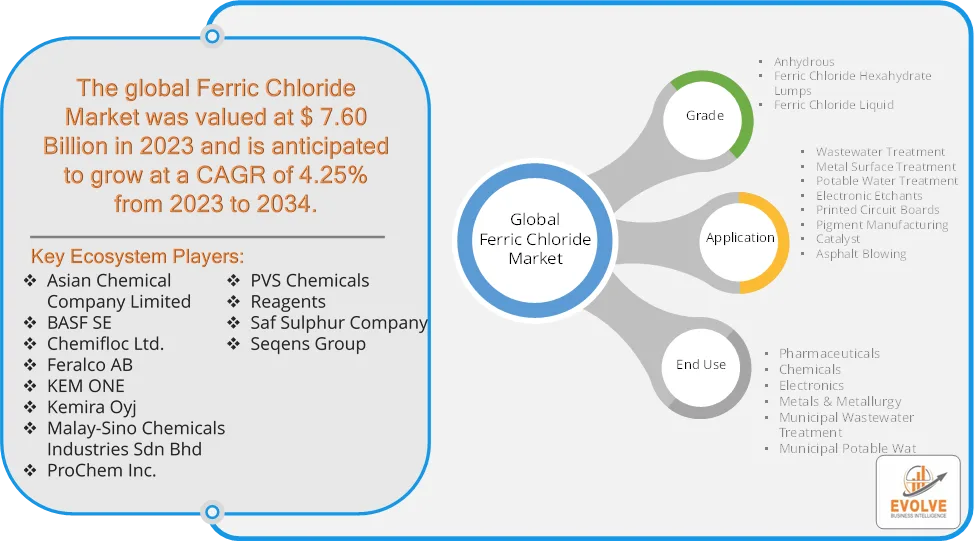
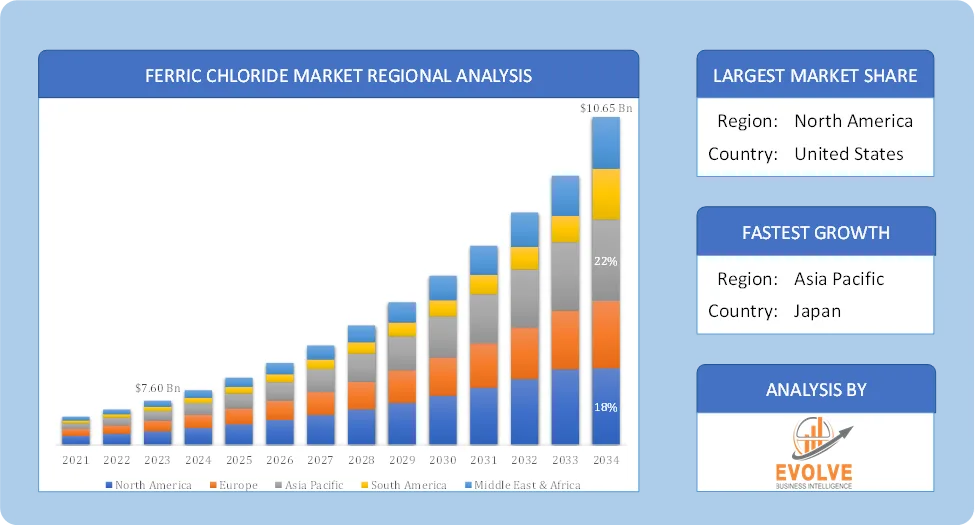
The Ferric Chloride Market size accounted for USD 7.60 Billion in 2023 and is estimated to account for 8.05 Billion in 2024. The Market is expected to reach USD 10.65 Billion by 2034 growing at a compound annual growth rate (CAGR) of 4.25% from 2024 to 2034. The ferric chloride market is a significant part of the global chemical industry, focusing on the production and application of ferric chloride (FeCl3), a versatile inorganic compound. It is available in anhydrous and hydrated forms (most commonly the hexahydrate), appearing as dark brown to black crystals or a brownish liquid when dissolved in water.

The ferric chloride market is poised for continued growth, driven by the fundamental needs for clean water and the expanding electronics industry. The increasing focus on sustainability and technological advancements will likely shape the future of the market.

Global Ferric Chloride Market Synopsis

Ferric Chloride Market AnalysisFerric Chloride Market Dynamics

The major factors that have impacted the growth of Ferric Chloride Market are as follows:

Drivers:

Ø  Growing Demand for Water and Wastewater Treatment

Ferric chloride is extensively used as a coagulant in municipal and industrial water treatment. Urbanization and industrial growth are increasing the volume of wastewater. Stricter environmental regulations are pushing industries and governments to invest in advanced treatment facilities. Widely used in etching copper during printed circuit board (PCB) manufacturing. Acts as a reagent in pharmaceutical synthesis and laboratory testing and as the healthcare and pharma sector grows, especially post-COVID, the demand for chemical reagents like ferric chloride is rising.

Restraint:

  • High Volatility in Raw Material Prices and Infrastructure Limitations in Developing Regions

Ferric chloride is typically produced using iron and chlorine—both of which are subject to price fluctuations. Changes in raw material availability or cost can affect profit margins and pricing stability for manufacturers. In some developing markets, lack of proper infrastructure for safe usage and storage limits the adoption of ferric chloride and especially true for smaller municipalities and industries with low safety budgets or awareness.

Opportunity:

⮚     Industrial Waste Treatment and Chemical Processing

Growing industrialization worldwide leads to a surge in demand for industrial effluent treatment, particularly in mining, textiles, petrochemicals, and metal processing. Ferric chloride’s role in removing sulfur compounds and hydrogen sulfide (H₂S) in gas streams presents opportunities in oil & gas and chemical industries. Opportunity exists for manufacturers to offer high-purity ferric chloride and customized formulations for niche applications like pharmaceuticals, biotech labs, and advanced electronics and green production technologies and circular economy models can enhance brand value and regulatory compliance.

Ferric Chloride Market Segment Overview

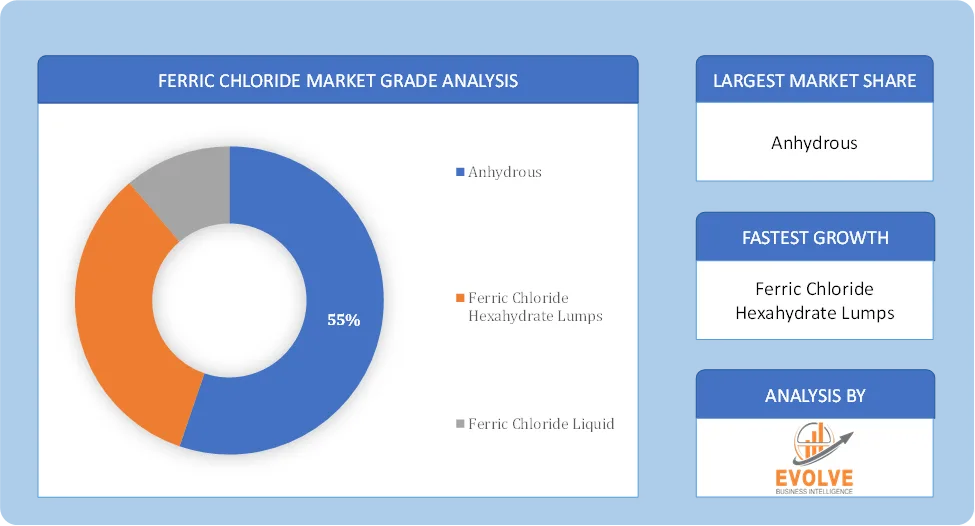
Ferric Chloride Market Grade AnalysisBy Grade

Based on Grade, the market is segmented based on Anhydrous, Ferric Chloride Hexahydrate Lumps, and Ferric Chloride Liquid. The anhydrous segment dominated the market. It is keenly used in the electronics industry for etching printed circuit boards (PCBs). The high purity of anhydrous ferric chloride ensures precise and controlled etching, leading to superior-quality PCBs. It is the purest form, with a minimum purity of 98%.

By Application

Based on Application, the market segment has been divided into Wastewater Treatment, Metal Surface Treatment, Potable Water Treatment, Electronic Etchants, Printed Circuit Boards, Pigment Manufacturing, Catalyst, Asphalt Blowing. The wastewater treatment segment dominant the market. It effectively removes impurities, suspended solids, and organic matter from the water, making it suitable for drinking or industrial use. The growing population and increasing focus on environmental sustainability drive the demand for ferric chloride in the water treatment sector.

By End Use

Based on Application, the market segment has been divided into Pharmaceuticals, Chemicals, Electronics, Metals & Metallurgy, Municipal Wastewater Treatment, Municipal Potable Water Treatment. The municipal wastewater treatment segment dominant the market. The rising need for clean and safe water, stringent environmental regulations, and increased infrastructure development drive the demand for ferric chloride in the water treatment sector.

Global Ferric Chloride Market Regional Analysis

Based on region, the global Ferric Chloride Market has been divided into North America, Europe, Asia-Pacific, the Middle East & Africa, and Latin America. North America is projected to dominate the use of the Ferric Chloride Market followed by the Asia-Pacific and Europe regions.

Global Ferric Chloride Market Regional AnalysisNorth America Ferric Chloride Market

North America holds a dominant position in the Ferric Chloride Market. he presence of a mature infrastructure for water and wastewater treatment drives consistent demand for ferric chloride. Strict regulations regarding water discharge and quality in countries like the United States and Canada necessitate the use of effective treatment chemicals and The presence of a strong electronics and chemical manufacturing base contributes to the demand for ferric chloride in etching and pigment production. Increasing replacement of aging infrastructure opens up new ferric chloride supply opportunities.

Asia-Pacific Ferric Chloride Market

The Asia-Pacific region has indeed emerged as the fastest-growing market for the Ferric Chloride Market industry. Growing industrial activities and increasing urban populations, particularly in China and India, lead to higher water consumption and wastewater generation, driving the demand for ferric chloride in water treatment.  China, South Korea, and other Southeast Asian countries are major hubs for electronics manufacturing, leading to significant demand for ferric chloride as an etchant in PCB production and also China alone accounts for a substantial number of PCB manufacturers globally.

Competitive Landscape

The global Ferric Chloride Market is highly competitive, with numerous players offering a wide range of software solutions. The competitive landscape is characterized by the presence of established companies, as well as emerging startups and niche players. To increase their market position and attract a wide consumer base, the businesses are employing various strategies, such as product launches, and strategic alliances.

Prominent Players:

  • Asian Chemical Company Limited
  • BASF SE
  • Chemifloc Ltd.
  • Feralco AB
  • KEM ONE
  • Kemira Oyj
  • Malay-Sino Chemicals Industries Sdn Bhd
  • ProChem Inc.
  • PVS Chemicals
  • Reagents
  • Saf Sulphur Company
  • Seqens Group.

Scope of the Report

Global Ferric Chloride Market, by Grade
  • Anhydrous
  • Ferric Chloride Hexahydrate Lumps
  • Ferric Chloride Liquid
Global Ferric Chloride Market, by Application
  • Wastewater Treatment
  • Metal Surface Treatment
  • Potable Water Treatment
  • Electronic Etchants
  • Printed Circuit Boards
  • Pigment Manufacturing
  • Catalyst
  • Asphalt Blowing
Global Ferric Chloride Market, by End Use
  • Pharmaceuticals
  • Chemicals
  • Electronics
  • Metals & Metallurgy
  • Municipal Wastewater Treatment
  • Municipal Potable Water Treatment
Global Ferric Chloride Market, by Region
  • North America
    • US
    • Canada
    • Mexico
  • Europe
    • UK
    • Germany
    • France
    • Italy
    • Spain
    • Benelux
    • Nordic
    • Rest of Europe
  • Asia Pacific
    • China
    • Japan
    • South Korea
    • Indonesia
    • Austalia
    • Malaysia
    • India
    • Rest of Asia Pacific
  • South America
    • Brazil
    • Argentina
    • Rest of South America
  • Middle East & Africa
    • Saudi Arabia
    • UAE
    • Egypt
    • South Africa
    • Rest of Middle East & Africa


Parameters Indicators
Market Size 2034: USD 10.65 Billion
CAGR (2024-2034) 4.25%
Base year 2022
Forecast Period 2024-2034
Historical Data 2021 (2017 to 2020 On Demand)
Report Coverage Revenue Forecast, Competitive Landscape, Growth Factors, and Trends
Key Segmentations Grade, Application, End Use
Geographies Covered North America, Europe, Asia-Pacific, South America, Middle East, Africa
Key Vendors Asian Chemical Company Limited, BASF SE, Chemifloc Ltd., Feralco AB, KEM ONE, Kemira Oyj, Malay-Sino Chemicals Industries Sdn Bhd, ProChem Inc., PVS Chemicals, Reagents, Saf Sulphur Company and Seqens Group.
Key Market Opportunities ·       Industrial Waste Treatment and Chemical Processing

·       Product Innovation and Purity Enhancement

Key Market Drivers ·       Growing Demand for Water and Wastewater Treatment

·       Use in Pharmaceuticals and Biomedical Applications


REPORT CONTENT BRIEF:

  • High-level analysis of the current and future Ferric Chloride Market trends and opportunities
  • Detailed analysis of current market drivers, restraining factors, and opportunities in the future
  • Ferric Chloride Market historical market size for the year 2021, and forecast from 2023 to 2033
  • Ferric Chloride Market share analysis at each product level
  • Competitor analysis with detailed insight into its product segment, Government & Defense strength, and strategies adopted.
  • Identifies key strategies adopted including product launches and developments, mergers and acquisitions, joint ventures, collaborations, and partnerships as well as funding taken and investment done, among others.
  • To identify and understand the various factors involved in the global Ferric Chloride Market affected by the pandemic
  • To provide a detailed insight into the major companies operating in the market. The profiling will include the Government & Defense health of the company’s past 2-3 years with segmental and regional revenue breakup, product offering, recent developments, SWOT analysis, and key strategies.

Frequently Asked Questions (FAQ)

The global Ferric Chloride Market is growing at a CAGR of 4.25% over the next 10 years

Asia Pacific is expected to register the highest CAGR during 2024-2034

Asian Chemical Company Limited, BASF SE, Chemifloc Ltd., Feralco AB, KEM ONE, Kemira Oyj, Malay-Sino Chemicals Industries Sdn Bhd, ProChem Inc., PVS Chemicals, Reagents, Saf Sulphur Company and Seqens Group. are the major companies operating in the market.

Yes, we offer 16 hours of analyst support to solve the queries

Yes, we provide regional as well as country-level reports. Other than this we also provide a sectional report. Please get in contact with our sales representatives.

For more details mail us at

Ask a question / additional requirement

Table of Content

Table of Content

CHAPTER 1.      Executive Summary

CHAPTER 2.      Scope of the Study

2.1.       Market Definition

2.2.       Market Scope & Segmentation

2.2.1.    Objective of Report

CHAPTER 3.         Evolve BI Methodology

3.1.       Data Collection & Validation Approach

3.2.       Market Size Estimation and Forecast

CHAPTER 4.         Exclusive Analysis

4.1.       Market Opportunity Score

4.1.1.    Grade Segement – Market Opportunity Score

4.1.2.    Application Segment – Market Opportunity Score

4.1.3.    End Use Segment – Market Opportunity Score

4.2.       Key Market Influencing Indicators

CHAPTER 5.         Market Insights and Trends

5.1.       Value Chain Analysis

5.1.1.    Raw Material

5.1.2.    Manufacturing Process

5.1.3.    Distribution Channel

5.1.4.    End User

5.2.       Porter’s Five Forces Analysis

5.2.1.    Bargaining Power of Buyers

5.2.2.    Bargaining Power of Suppliers

5.2.3.    Threat of New Entrant

5.2.4.    Threat of Substitute

5.2.5.    Industry Rivalry

5.3.       COVID-19 Impact and Post COVID Scenario on Ferric Chloride Market Market

5.3.1.    Impact of COVID-19

5.3.2.    Government Support and Industry Revival Policies

5.3.3.    Measures Taken by Companies to Mitigate Negative Impact

5.3.4.    Post COVID Trend

CHAPTER 6.             Market Dynamics

6.1.       Introduction

6.2.       Drivers

6.2.1.    Driver 1

6.2.2.    Driver 2

6.2.3.    Driver 3

6.3.       Restraints

6.3.1.    Restraint 1

6.3.2.    Restraint 2

6.4.       Opportunity

6.4.1.    Opportunity 1

CHAPTER 7.          Ferric Chloride Market Market, By Grade

7.1.       Introduction

7.1.1.    Anhydrous

7.1.2    Ferric Chloride Hexahydrate Lumps

7.1.3.  Ferric Chloride Liquid

CHAPTER 8             Ferric Chloride Market Market, By Application

8.1.       Introduction

8.1.1.    Wastewater Treatment

8.1.2.   Metal Surface Treatment

8.1.3.  Potable Water Treatment

8.1.4.  Electronic Etchants

8.1.5.  Printed Circuit Boards

8.1.6.  Pigment Manufacturing

8.1.7.  Catalyst

8.1.8.  Asphalt Blowing

CHAPTER 9.     Ferric Chloride Market Market, By End Use

9.1.       Introduction

9.1.1.    Pharmaceuticals

9.1.2.    Chemicals

9.1.3.  Electronics

9.1.4   Metals & Metallurgy

9.1.5   Municipal Wastewater Treatment

9.1.6   Municipal Potable Water Treatment

CHAPTER 10.     Ferric Chloride Market Market, By Region

10.1.     Introduction

10.2.     NORTH AMERICA

10.2.1. North America: Market Size and Forecast, By Country, 2024 – 2034($ Million)

10.2.2. North America: Market Size and Forecast, By Grade, 2024 – 2034($ Million)

10.2.3. North America: Market Size and Forecast, By Application, 2024 – 2034($ Million)

10.2.4. North America: Market Size and Forecast, By End Use, 2024 – 2034($ Million)

10.2.5. US

10.2.5.1. US: Market Size and Forecast, By Grade, 2024 – 2034($ Million)

10.2.5.2. US: Market Size and Forecast, By Application, 2024 – 2034($ Million)

10.2.5.3. US: Market Size and Forecast, By End Use, 2024 – 2034($ Million)

10.2.6. CANADA

10.2.6.1. Canada: Market Size and Forecast, By Grade, 2024 – 2034($ Million)

10.2.6.2. Canada: Market Size and Forecast, By Application, 2024 – 2034($ Million)

10.2.6.3. Canada: Market Size and Forecast, By End Use, 2024 – 2034($ Million)

10.2.7. MEXICO

10.2.7.1. Mexico: Market Size and Forecast, By Grade, 2024 – 2034($ Million)

10.2.7.2. Mexico: Market Size and Forecast, By Application, 2024 – 2034($ Million)

10.2.7.3. Mexico: Market Size and Forecast, By End Use, 2024 – 2034($ Million)

10.3.     Europe

10.3.1. Europe: Market Size and Forecast, By Country, 2024 – 2034($ Million)

10.3.2. Europe: Market Size and Forecast, By Grade, 2024 – 2034($ Million)

10.3.3. Europe: Market Size and Forecast, By Application, 2024 – 2034($ Million)

10.3.4. Europe: Market Size and Forecast, By End Use, 2024 – 2034($ Million)

10.3.5. U.K.

10.3.5.1. U.K.: Market Size and Forecast, By Grade, 2024 – 2034($ Million)

10.3.5.2. U.K.: Market Size and Forecast, By Application, 2024 – 2034($ Million)

10.3.5.3. U.K.: Market Size and Forecast, By End Use, 2024 – 2034($ Million)

10.3.6. GERMANY

10.3.6.1. Germany: Market Size and Forecast, By Grade, 2024 – 2034($ Million)

10.3.6.2. Germany: Market Size and Forecast, By Application, 2024 – 2034($ Million)

10.3.6.3. Germany: Market Size and Forecast, By End Use, 2024 – 2034($ Million)

10.3.7. FRANCE

10.3.7.1. France: Market Size and Forecast, By Grade, 2024 – 2034($ Million)

10.3.7.2. France: Market Size and Forecast, By Application, 2024 – 2034($ Million)

10.3.7.3. France: Market Size and Forecast, By End Use, 2024 – 2034($ Million)

10.3.8. ITALY

10.3.8.1. Italy: Market Size and Forecast, By Grade, 2024 – 2034($ Million)

10.3.8.2. Italy: Market Size and Forecast, By Application, 2024 – 2034($ Million)

10.3.8.3. Italy: Market Size and Forecast, By End Use, 2024 – 2034($ Million)

10.3.9. SPAIN

10.3.9.1. Spain: Market Size and Forecast, By Grade, 2024 – 2034($ Million)

10.3.9.2. Spain: Market Size and Forecast, By Application, 2024 – 2034($ Million)

10.3.9.3. Spain: Market Size and Forecast, By End Use, 2024 – 2034($ Million)

10.3.10. BENELUX

10.3.10.1. BeNeLux: Market Size and Forecast, By Grade, 2024 – 2034($ Million)

10.3.10.2. BeNeLux: Market Size and Forecast, By Application, 2024 – 2034($ Million)

10.3.10.3. BeNeLux: Market Size and Forecast, By End Use, 2024 – 2034($ Million)

10.3.11. RUSSIA

10.3.11.1. Russia: Market Size and Forecast, By Grade, 2024 – 2034($ Million)

10.3.11.2. Russia: Market Size and Forecast, By Application, 2024 – 2034($ Million)

10.3.11.3. Russia: Market Size and Forecast, By End Use, 2024 – 2034($ Million)

10.3.12. REST OF EUROPE

10.3.12.1. Rest of Europe: Market Size and Forecast, By Grade, 2024 – 2034($ Million)

10.3.12.2. Rest of Europe: Market Size and Forecast, By Application, 2024 – 2034($ Million)

10.3.12.3. Rest of Europe: Market Size and Forecast, By End Use, 2024 – 2034($ Million)

10.4.     Asia Pacific

10.4.1. Asia Pacific: Market Size and Forecast, By Country, 2024 – 2034($ Million)

10.4.2. Asia Pacific: Market Size and Forecast, By Grade, 2024 – 2034($ Million)

10.4.3. Asia Pacific: Market Size and Forecast, By Application, 2024 – 2034($ Million)

10.4.4. Asia Pacific: Market Size and Forecast, By End Use, 2024 – 2034($ Million)

10.4.5. CHINA

10.4.5.1. China: Market Size and Forecast, By Grade, 2024 – 2034($ Million)

10.4.5.2. China: Market Size and Forecast, By Application, 2024 – 2034($ Million)

10.4.5.3. China: Market Size and Forecast, By End Use, 2024 – 2034($ Million)

10.4.6. JAPAN

10.4.6.1. Japan: Market Size and Forecast, By Grade, 2024 – 2034($ Million)

10.4.6.2. Japan: Market Size and Forecast, By Application, 2024 – 2034($ Million)

10.4.6.3. Japan: Market Size and Forecast, By End Use, 2024 – 2034($ Million)

10.4.7. INDIA

10.4.7.1. India: Market Size and Forecast, By Grade, 2024 – 2034($ Million)

10.4.7.2. India: Market Size and Forecast, By Application, 2024 – 2034($ Million)

10.4.7.3. India: Market Size and Forecast, By End Use, 2024 – 2034($ Million)

10.4.8. SOUTH KOREA

10.4.8.1. South Korea: Market Size and Forecast, By Grade, 2024 – 2034($ Million)

10.4.8.2. South Korea: Market Size and Forecast, By Application, 2024 – 2034($ Million)

10.4.8.3. South Korea: Market Size and Forecast, By End Use, 2024 – 2034($ Million)

10.4.9. THAILAND

10.4.9.1. Thailand: Market Size and Forecast, By Grade, 2024 – 2034($ Million)

10.4.9.2. Thailand: Market Size and Forecast, By Application, 2024 – 2034($ Million)

10.4.9.3. Thailand: Market Size and Forecast, By End Use, 2024 – 2034($ Million)

10.4.10. INDONESIA

10.4.10.1. Indonesia: Market Size and Forecast, By Grade, 2024 – 2034($ Million)

10.4.10.2. Indonesia: Market Size and Forecast, By Application, 2024 – 2034($ Million)

10.4.10.3. Indonesia: Market Size and Forecast, By End Use, 2024 – 2034($ Million)

10.4.11. MALAYSIA

10.4.11.1. Malaysia: Market Size and Forecast, By Grade, 2024 – 2034($ Million)

10.4.11.2. Malaysia: Market Size and Forecast, By Application, 2024 – 2034($ Million)

10.4.11.3. Malaysia: Market Size and Forecast, By End Use, 2024 – 2034($ Million)

10.4.12. AUSTRALIA

10.4.12.1. Australia: Market Size and Forecast, By Grade, 2024 – 2034($ Million)

10.4.12.2. Australia: Market Size and Forecast, By Application, 2024 – 2034($ Million)

10.4.12.3. Australia: Market Size and Forecast, By End Use, 2024 – 2034($ Million)

10.4.13. REST FO ASIA PACIFIC

10.4.13.1. Rest fo Asia Pacific: Market Size and Forecast, By Grade, 2024 – 2034($ Million)

10.4.13.2. Rest fo Asia Pacific: Market Size and Forecast, By Application, 2024 – 2034($ Million)

10.4.13.3. Rest fo Asia Pacific: Market Size and Forecast, By End Use, 2024 – 2034($ Million)

10.5.     South America

10.5.1. South America: Market Size and Forecast, By Country, 2024 – 2034($ Million)

10.5.2. South America: Market Size and Forecast, By Grade, 2024 – 2034($ Million)

10.5.3. South America: Market Size and Forecast, By System, 2024 – 2034($ Million)

10.5.4. South America: Market Size and Forecast, By End Use, 2024 – 2034($ Million)

10.5.5. BRAZIL

10.5.5.1. Brazil: Market Size and Forecast, By Grade, 2024 – 2034($ Million)

10.5.5.2. Brazil: Market Size and Forecast, By Application, 2024 – 2034($ Million)

10.5.5.3. Brazil: Market Size and Forecast, By End Use, 2024 – 2034($ Million)

10.5.6. ARGENTINA

10.5.6.1. Argentina: Market Size and Forecast, By Grade, 2024 – 2034($ Million)

10.5.6.2. Argentina: Market Size and Forecast, By Application, 2024 – 2034($ Million)

10.5.6.3. Argentina: Market Size and Forecast, By End Use, 2024 – 2034($ Million)

10.5.7. REST OF SOUTH AMERICA

10.5.7.1. Rest of South America: Market Size and Forecast, By Grade, 2024 – 2034($ Million)

10.5.7.2. Rest of South America: Market Size and Forecast, By Application, 2024 – 2034($ Million)

10.5.7.3. Rest of South America: Market Size and Forecast, By End Use, 2024 – 2034($ Million)

10.6.     Middle East & Africa

10.6.1. Middle East & Africa: Market Size and Forecast, By Country, 2024 – 2034($ Million)

10.6.2. Middle East & Africa: Market Size and Forecast, By Grade, 2024 – 2034($ Million)

10.6.3. Middle East & Africa: Market Size and Forecast, By Application, 2024 – 2034($ Million)

10.6.4. Middle East & Africa: Market Size and Forecast, By End Use, 2024 – 2034($ Million)

10.6.5. SAUDI ARABIA

10.6.5.1. Saudi Arabia: Market Size and Forecast, By Grade, 2024 – 2034($ Million)

10.6.5.2. Saudi Arabia: Market Size and Forecast, By Application, 2024 – 2034($ Million)

10.6.5.3. Saudi Arabia: Market Size and Forecast, By End Use, 2024 – 2034($ Million)

10.6.6. UAE

10.6.6.1. UAE: Market Size and Forecast, By Grade, 2024 – 2034($ Million)

10.6.6.2. UAE: Market Size and Forecast, By Application, 2024 – 2034($ Million)

10.6.6.3. UAE: Market Size and Forecast, By End Use, 2024 – 2034($ Million)

10.6.7. EGYPT

10.6.7.1. Egypt: Market Size and Forecast, By Grade, 2024 – 2034($ Million)

10.6.7.2. Egypt: Market Size and Forecast, By Application, 2024 – 2034($ Million)

10.6.7.3. Egypt: Market Size and Forecast, By End Use, 2024 – 2034($ Million)

10.6.8. SOUTH AFRICA

10.6.8.1. South Africa: Market Size and Forecast, By Grade, 2024 – 2034($ Million)

10.6.8.2. South Africa: Market Size and Forecast, By Application, 2024 – 2034($ Million)

10.6.8.3. South Africa: Market Size and Forecast, By End Use, 2024 – 2034($ Million)

10.6.9. REST OF MIDDLE EAST & AFRICA

10.6.9.1. Rest of Middle East & Africa: Market Size and Forecast, By Grade, 2024 – 2034($ Million)

10.6.9.2. Rest of Middle East & Africa: Market Size and Forecast, By Application, 2024 – 2034($ Million)

10.6.9.3.Rest of Middle East & Africa: Market Size and Forecast, By End Use, 2024 – 2034($ Million)

CHAPTER 12. Competitive Landscape

12.1.     Competitior Benchmarking 2023-

12.2.     Market Share Analysis

12.3.     Key Developments Analysis By Top 5 Companies

12.4.     Market Share Acquisition Strategies: Analysis of Key Approaches Employed by Top Players

CHAPTER 13. Company Profiles

13.1.     Asian Chemical Company Limited

13.1.1. Hanon Systems

13.1.2. Financial Analysis

13.1.2.1. Business Segment Revenue, 2020, 2021, 2022, $ Million

13.1.2.2. Geographic Revenue Mix, 2022 (% Share)

13.1.3. Product Portfolio

13.1.4. Recent Development and Strategies Adopted

13.1.5. SWOT Analysis

13.2.     Chemifloc Ltd.

13.3.     Feralco AB

13.4.     KEM ONE

13.5.     Kemira Oyj

13.6.     Malay-Sino Chemicals Industries Sdn Bhd

13.7.     ProChem Inc.

13.8.    PVS Chemicals

13.9     Reagents

13.10   Saf Sulphur Company

Connect to Analyst

Connect to Analyst

Research Methodology

Research Methodology