Faucet Market Analysis and Global Forecast 2023-2033
$ 1,390.00 – $ 5,520.00
Faucet Market Research Report: Information By Material (Metal, Plastic), By Product Type (Electronic, Manual), By Application (Bathroom, Kitchen, Others), By End Use (Residential, Commercial), and by Region — Forecast till 2033
Page: 158
Faucet Market Overview
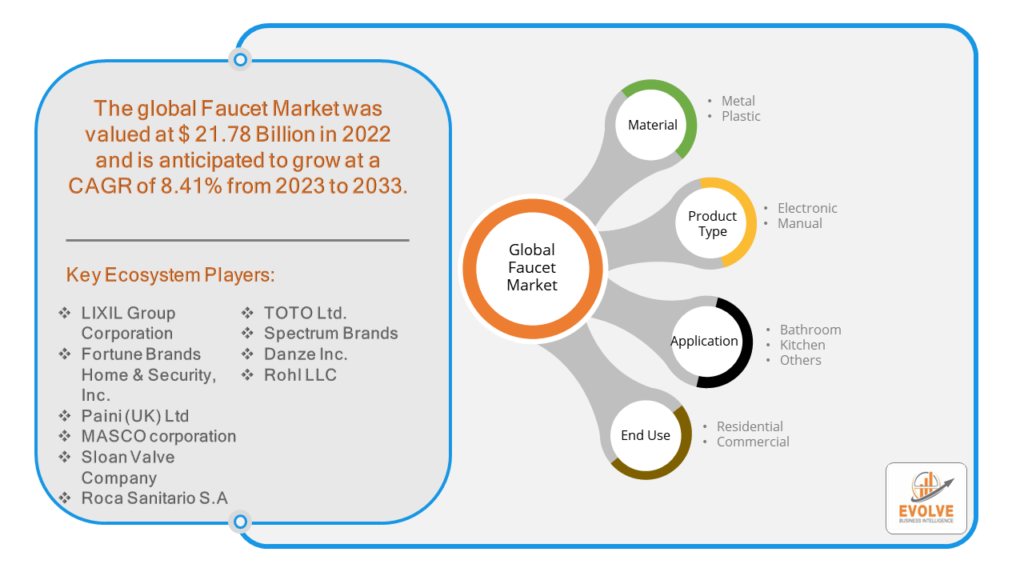
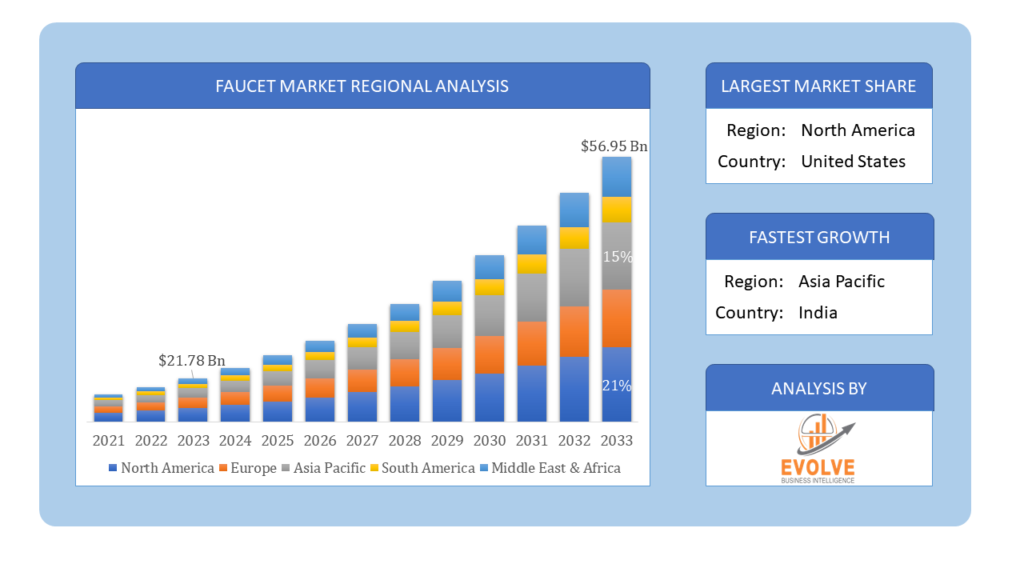
The Faucet Market Size is expected to reach USD 56.95 Billion by 2033. The Faucet Market industry size accounted for USD 21.78 Billion in 2023 and is expected to expand at a compound annual growth rate (CAGR) of 8.41% from 2023 to 2033. The faucet market is the industry that encompasses the manufacturing, distribution, and sale of faucets. Faucets are the devices attached to plumbing fixtures that control the flow of water. They are found in a variety of places, including kitchens, bathrooms, laundry rooms, and utility sinks.
The faucet market is a large and growing industry, driven by factor like increasing demand for new housing, which creates a need for new faucets and the growing popularity of home renovations, as people look to update their kitchens and bathrooms. The faucet market is expected to continue to grow in the coming years, driven by the factors mentioned above. In addition, the growing demand for water-efficient faucets is expected to be a major driver of growth in the market.
Global Faucet Market Synopsis
The COVID-19 pandemic had a significant impact on the Faucet Market. The pandemic caused disruptions in global supply chains, affecting the production and distribution of faucets. Lockdowns and restrictions led to delays in manufacturing and shipping, resulting in shortages and increased lead times. With people spending more time at home due to lockdowns and remote work, there was an increased focus on home improvement and renovations. This boosted demand for kitchen and bathroom fixtures, including faucets. However, economic uncertainties also led some consumers to delay non-essential purchases. The pandemic heightened awareness of hygiene and the need to minimize contact with surfaces. As a result, there was a surge in demand for touchless and sensor-activated faucets in both residential and commercial settings. The pandemic reinforced the importance of sustainable and eco-friendly products. Consumers became more conscious of water conservation, driving demand for water-efficient faucets.
Faucet Market Dynamics
The major factors that have impacted the growth of Faucet Market are as follows:
Drivers:
Ø Technological Advancements
Innovations in faucet technology, such as touchless or sensor-activated faucets, smart faucets with Internet of Things (IoT) integration, and water-saving technologies, are attracting consumers looking for convenience, efficiency, and advanced features. Heightened awareness of health and hygiene, especially in the wake of the COVID-19 pandemic, has led to a growing preference for touchless and hands-free faucets, which help minimize the spread of germs and bacteria. Economic growth, particularly in developing countries, has led to rising disposable incomes, allowing consumers to invest more in home improvement and high-quality fixtures. This economic improvement drives the overall demand for faucets. The expansion of the hospitality and tourism industry, including hotels, restaurants, and resorts, creates a significant demand for commercial-grade faucets. This sector prioritizes durable, aesthetically pleasing, and functional fixtures.
Restraint:
- Perception of High Costs of Advanced Faucets
Technologically advanced faucets, such as touchless and smart faucets, often come with higher price tags. The cost can be a barrier for many consumers, especially in price-sensitive markets, limiting the adoption of these innovative products.The cost of raw materials like brass, stainless steel, and other metals used in faucet manufacturing can be volatile. Price fluctuations can affect production costs, leading to higher prices for consumers or reduced profit margins for manufacturers. Global supply chain disruptions, caused by events like natural disasters, pandemics, or geopolitical tensions, can delay the production and delivery of faucets. Such disruptions can result in inventory shortages and impact market growth.
Opportunity:
⮚ Growing demand for Expansion in Emerging Markets
Rapid urbanization and economic growth in emerging markets, particularly in Asia-Pacific, Latin America, and Africa, create significant opportunities for faucet manufacturers. Increasing disposable incomes and urban development projects drive demand for modern plumbing fixtures. The rise of smart home technology offers substantial opportunities for developing and marketing smart faucets. These faucets can be integrated with home automation systems, offering features like voice control, programmable settings, and connectivity with other smart devices. Growing environmental awareness and the demand for sustainable products provide an opportunity for manufacturers to develop water-efficient and eco-friendly faucets. Innovations in materials and design can appeal to environmentally conscious consumers and comply with regulatory standards. There is a growing consumer preference for stylish and aesthetically pleasing faucets that complement modern interior designs. Manufacturers can capitalize on this trend by offering customizable options, unique finishes, and contemporary designs.
Faucet Market Segment Overview
By Material
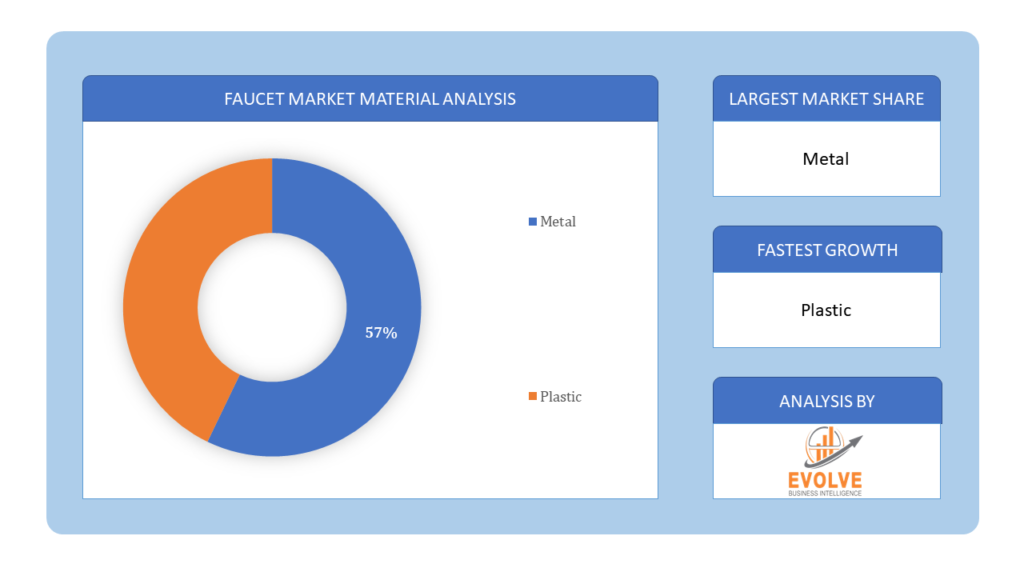
Based on Material, the market is segmented based on Metal and Plastic. Metals are known for their long-lasting properties, which aid in improving faucet’s service life and reducing maintenance costs. Besides this, metal faucets offer high tensile strength, making them resistant to wear and tear, thereby ensuring product longevity. Furthermore, they provide a timeless and sophisticated look, adding a touch of luxury to both kitchens and bathrooms.
By Product Type
Based on Product Type, the market segment has been divided into the Electronic and Manual. Manual Faucets account for the largest market. The manual growth of the faucets market is because more apartments and commercial spaces are being built, homes are being remodeled, and old faucets are being replaced. With the popularity of updated bathrooms and coordinated sanitary ware, fittings, and accessories on the rise, the key players on the market are offering a one-stop shop for all sanitary ware and fitting equipment.
By Application
Based on Application, the market segment has been divided into the Bathroom, Kitchen and Others. Bathrooms are frequently used spaces in both residential and commercial settings, which drives the faucet market demand. Furthermore, they require various types of faucets, such as sink faucets, shower faucets, and bathtub faucets, thus increasing the overall product demand. Additionally, the increasing number of home renovation and improvement projects, which often prioritize bathroom upgrades, including the installation of modern faucets, is supporting the market growth.
By End Use
Based on End Use, the market segment has been divided into the Residential and Commercial. Residential is dominating the market as they have multiple faucet requirements, including kitchens, bathrooms, and outdoor areas. Furthermore, homeowners often replace or upgrade faucets as part of home renovation projects, leading to a consistent demand in the residential sector. Besides this, the availability of a diverse range of design options, finishes, and features, which allows consumers to personalize their living spaces, is contributing to the market growth.
Global Faucet Market Regional Analysis
Based on region, the global Faucet Market has been divided into North America, Europe, Asia-Pacific, the Middle East & Africa, and Latin America. North America is projected to dominate the use of the Faucet Market followed by the Asia-Pacific and Europe regions.
Faucet North America Market
North America holds a dominant position in the Faucet Market. This is due to a number of factors, including the high disposable income of consumers in the region, the large and mature housing market, and the growing popularity of home renovations. Strong emphasis on home renovation and remodeling, growing awareness of water conservation, and increasing adoption of smart home technologies.
Faucet Asia-Pacific Market
The Asia-Pacific region has indeed emerged as the fastest-growing market for the Faucet Market industry. This is due to a number of factors, including the rapid economic growth in the region, the increasing urbanization, and the rising disposable income of consumers. High demand for affordable yet modern faucets, increasing penetration of touchless and sensor faucets, and growing e-commerce sales.
Competitive Landscape
The global Faucet Market is highly competitive, with numerous players offering a wide range of software solutions. The competitive landscape is characterized by the presence of established companies, as well as emerging startups and niche players. To increase their market position and attract a wide consumer base, the businesses are employing various strategies, such as product launches, and strategic alliances.
Prominent Players:
- LIXIL Group Corporation
- Fortune Brands Home & Security, Inc.
- Paini (UK) Ltd
- MASCO corporation
- Sloan Valve Company
- Roca Sanitario S.A
- TOTO Ltd.
- Spectrum Brands
- Danze Inc.
- Rohl LLC
Key Development
In July 2022, Colston Bath introduced a new faucet design to elevate the bathroom appearance into a place of art.
In January 2023, Delta Faucet Company (Masco Corporation) showcased it new digital and steam showers and pull down bath faucet innovations at the Kitchen and Bath Industry Show (KBIS) 2023. Scope of the Report
Global Faucet Market, by Material
- Metal
- Plastic
Global Faucet Market, by Product Type
- Electronic
- Manual
Global Faucet Market, by Application
- Bathroom
- Kitchen
- Others
Global Faucet Market, by End Use
- Residential
- Commercial
Global Faucet Market, by Region
- North America
- US
- Canada
- Mexico
- Europe
- UK
- Germany
- France
- Italy
- Spain
- Benelux
- Nordic
- Rest of Europe
- Asia Pacific
- China
- Japan
- South Korea
- Indonesia
- Austalia
- Malaysia
- India
- Rest of Asia Pacific
- South America
- Brazil
- Argentina
- Rest of South America
- Middle East & Africa
- Saudi Arabia
- UAE
- Egypt
- South Africa
- Rest of Middle East & Africa
Parameters | Indicators |
---|---|
Market Size | 2033: $56.95 Billion |
CAGR | 8.41% CAGR (2023-2033) |
Base year | 2022 |
Forecast Period | 2023-2033 |
Historical Data | 2021 |
Report Coverage | Revenue Forecast, Competitive Landscape, Growth Factors, and Trends |
Key Segmentations | Material, Product Type, Application, End Use |
Geographies Covered | North America, Europe, Asia-Pacific, Latin America, Middle East, Africa |
Key Vendors | LIXIL Group Corporation, Fortune Brands Home & Security Inc., Paini (UK) Ltd, MASCO corporation, Sloan Valve Company, Roca Sanitario S.A, TOTO Ltd., Spectrum Brands, Danze Inc. and Rohl LLC |
Key Market Opportunities | • Growing demand for Expansion in Emerging Markets |
Key Market Drivers | • Technological Advancements • Economic Growth and Rising Disposable Incomes |
REPORT CONTENT BRIEF:
- High-level analysis of the current and future Faucet Market trends and opportunities
- Detailed analysis of current market drivers, restraining factors, and opportunities in the future
- Faucet Market historical market size for the year 2021, and forecast from 2023 to 2033
- Faucet Market share analysis at each product level
- Competitor analysis with detailed insight into its product segment, Government & Defense strength, and strategies adopted.
- Identifies key strategies adopted including product launches and developments, mergers and acquisitions, joint ventures, collaborations, and partnerships as well as funding taken and investment done, among others.
- To identify and understand the various factors involved in the global Faucet Market affected by the pandemic
- To provide a detailed insight into the major companies operating in the market. The profiling will include the Government & Defense health of the company’s past 2-3 years with segmental and regional revenue breakup, product offering, recent developments, SWOT analysis, and key strategies.
Press Release
Global Managed Services Market Forecast to Reach USD 847.21 Billion by 2034, Growing at a 7.14% CAGR
The Cosmetic Laser Market Is Estimated To Record a CAGR of Around 14.01% During The Forecast Period
Global Chloroprene Rubber Market Forecast to Reach USD 10.52 Billion by 2033, Growing at a 6.25% CAGR
The Cell Separation Market Is Estimated To Record a CAGR of Around 9.98% During The Forecast Period
The Solar Energy Systems Market Is Estimated To Record a CAGR of Around 5.78% During The Forecast Period
The Automotive Radar Market Is Estimated To Record a CAGR of Around 31.75% During The Forecast Period
Global Atrial Fibrillation Drugs Market Forecast to Reach USD 21.36 Billion by 2034, Growing at a 10.25% CAGR
The Alopecia Treatment Market Is Estimated To Record a CAGR of Around 10.95% During The Forecast Period
Global Sleep Tech Market Forecast to Reach USD 28.11 Billion by 2034, Growing at an 18.32% CAGR
Global Prebiotic Ingredient Market Forecast to Reach USD 13.85 Billion by 2034, Growing at a 10.25% CAGR
Frequently Asked Questions (FAQ)
What is the study period of the Faucet Market?
The study period for the Faucet Market spans from 2023 to 2033.
What is the growth rate of the Faucet Market?
The Faucet Market is expected to grow at a CAGR of 8.41% from 2023 to 2033.
Which region has the highest growth rate in the Faucet Market?
The Asia-Pacific region has the highest growth rate in the Faucet Market.
Which region has the largest share of the Faucet Market?
North America holds the largest share of the Faucet Market.
Who are the key players in the Faucet Market?
Key players in the Faucet Market include LIXIL Group Corporation, Fortune Brands Home & Security Inc., MASCO Corporation, Sloan Valve Company, and TOTO Ltd.
Do you offer Post sales support?
Yes, we offer 16 hours of analyst support to solve the queries
Do you sell particular sections of a report?
Yes, we provide regional as well as country-level reports. Other than this we also provide a sectional report. Please get in contact with our sales representatives.
Table of Content
CHAPTER 1. Executive Summary CHAPTER 2. Scope of the Study 2.1. Market Definition 2.2. Market Scope & Segmentation 2.2.1. Objective of Report CHAPTER 3. Evolve BI Methodology 3.1. Data Collection & Validation Approach 3.2. Market Size Estimation and Forecast CHAPTER 4. Exclusive Analysis 4.1. Market Opportunity Score 4.1.1. Material Segement – Market Opportunity Score 4.1.2. Application Segment – Market Opportunity Score 4.1.3. End Use Segment – Market Opportunity Score 4.1.4. Product Type Segment – Market Opportunity Score 4.2. Key Market Influencing Indicators CHAPTER 5. Market Insights and Trends 5.1. Value Chain Analysis 5.1.1. Raw Material 5.1.2. Manufacturing Process 5.1.3. Distribution Channel 5.1.4. End User 5.2. Porter’s Five Forces Analysis 5.2.1. Bargaining Power of Buyers 5.2.2. Bargaining Power of Suppliers 5.2.3. Threat of New Entrant 5.2.4. Threat of Substitute 5.2.5. Industry Rivalry 5.3. COVID-19 Impact and Post COVID Scenario on Faucet Market 5.3.1. Impact of COVID-19 5.3.2. Government Support and Industry Revival Policies 5.3.3. Measures Taken by Companies to Mitigate Negative Impact 5.3.4. Post COVID Trend CHAPTER 6. MArket Dynamics 6.1. Introduction 6.2. Drivers 6.2.1. Driver 1 6.2.2. Driver 2 6.2.3. Driver 3 6.3. Restraints 6.3.1. Restraint 1 6.3.2. Restraint 2 6.4. Opportunity 6.4.1. Opportunity 1 CHAPTER 7. Faucet Market, By Material 7.1. Introduction 7.1.1. Metal 7.1.2 Plastic CHAPTER 8. Faucet Market, By Application 8.1. Introduction 8.1.1. Bathroom 8.1.2. Kitchen 8.1.3. Others CHAPTER 9. Faucet Market, By End Use 9.1. Introduction 9.1.1. Residential 9.1.2. Commercial CHAPTER 10. Faucet Market, By Product Type 10.1.Introduction 10.1.1. Electronic 10.1.2. Manual CHAPTER 11. Faucet Market, By Region 11.1. Introduction 11.2. NORTH AMERICA 11.2.1. North America: Market Size and Forecast, By Country, 2023 – 2033 ($ Million) 11.2.2. North America: Market Size and Forecast, By Material, 2023 – 2033 ($ Million) 11.2.3. North America: Market Size and Forecast, By Application, 2023 – 2033 ($ Million) 11.2.4. North America: Market Size and Forecast, By End Use, 2023 – 2033 ($ Million) 11.2.5. North America: Market Size and Forecast, By Product Type, 2023 – 2033 ($ Million) 11.2.6. US 11.2.6.1. US: Market Size and Forecast, By Material, 2023 – 2033 ($ Million) 11.2.6.2. US: Market Size and Forecast, By Application, 2023 – 2033 ($ Million) 11.2.6.3. US: Market Size and Forecast, By End Use, 2023 – 2033 ($ Million) 11.2.6.4. US: Market Size and Forecast, By Product Type, 2023 – 2033 ($ Million) 11.2.7. CANADA 11.2.7.1. Canada: Market Size and Forecast, By Material, 2023 – 2033 ($ Million) 11.2.7.2. Canada: Market Size and Forecast, By Application, 2023 – 2033 ($ Million) 11.2.7.3. Canada: Market Size and Forecast, By End Use, 2023 – 2033 ($ Million) 11.2.7.4. Canada: Market Size and Forecast, By Product Type, 2023 – 2033 ($ Million) 11.2.8. MEXICO 11.2.8.1. Mexico: Market Size and Forecast, By Material, 2023 – 2033 ($ Million) 11.2.8.2. Mexico: Market Size and Forecast, By Application, 2023 – 2033 ($ Million) 11.2.8.3. Mexico: Market Size and Forecast, By End Use, 2023 – 2033 ($ Million) 11.2.8.4. Mexico: Market Size and Forecast, By Product Type, 2023 – 2033 ($ Million) 11.3. Europe 11.3.1. Europe: Market Size and Forecast, By Country, 2023 – 2033 ($ Million) 11.3.2. Europe: Market Size and Forecast, By Material, 2023 – 2033 ($ Million) 11.3.3. Europe: Market Size and Forecast, By Application, 2023 – 2033 ($ Million) 11.3.4. Europe: Market Size and Forecast, By End Use, 2023 – 2033 ($ Million) 11.3.5. Europe: Market Size and Forecast, By Product Type, 2023 – 2033 ($ Million) 11.3.6. U.K. 11.3.6.1. U.K.: Market Size and Forecast, By Material, 2023 – 2033 ($ Million) 11.3.6.2. U.K.: Market Size and Forecast, By Application, 2023 – 2033 ($ Million) 11.3.6.3. U.K.: Market Size and Forecast, By End Use, 2023 – 2033 ($ Million) 11.3.6.4. U.K.: Market Size and Forecast, By Product Type, 2023 – 2033 ($ Million) 11.3.7. GERMANY 11.3.7.1. Germany: Market Size and Forecast, By Material, 2023 – 2033 ($ Million) 11.3.7.2. Germany: Market Size and Forecast, By Application, 2023 – 2033 ($ Million) 11.3.7.3. Germany: Market Size and Forecast, By End Use, 2023 – 2033 ($ Million) 11.3.7.4. Germany: Market Size and Forecast, By Product Type, 2023 – 2033 ($ Million) 11.3.8. FRANCE 11.3.8.1. France: Market Size and Forecast, By Material, 2023 – 2033 ($ Million) 11.3.8.2. France: Market Size and Forecast, By Application, 2023 – 2033 ($ Million) 11.3.8.3. France: Market Size and Forecast, By End Use, 2023 – 2033 ($ Million) 11.3.8.4. France: Market Size and Forecast, By Product Type, 2023 – 2033 ($ Million) 11.3.9. ITALY 11.3.9.1. Italy: Market Size and Forecast, By Material, 2023 – 2033 ($ Million) 11.3.9.2. Italy: Market Size and Forecast, By Application, 2023 – 2033 ($ Million) 11.3.9.3. Italy: Market Size and Forecast, By End Use, 2023 – 2033 ($ Million) 11.3.9.4. Italy: Market Size and Forecast, By Product Type, 2023 – 2033 ($ Million) 11.3.10. SPAIN 11.3.10.1. Spain: Market Size and Forecast, By Material, 2023 – 2033 ($ Million) 11.3.10.2. Spain: Market Size and Forecast, By Application, 2023 – 2033 ($ Million) 11.3.10.3. Spain: Market Size and Forecast, By End Use, 2023 – 2033 ($ Million) 11.3.10.4. Spain: Market Size and Forecast, By Product Type, 2023 – 2033 ($ Million) 11.3.11. BENELUX 11.3.11.1. BeNeLux: Market Size and Forecast, By Material, 2023 – 2033 ($ Million) 11.3.11.2. BeNeLux: Market Size and Forecast, By Application, 2023 – 2033 ($ Million) 11.3.11.3. BeNeLux: Market Size and Forecast, By End Use, 2023 – 2033 ($ Million) 11.3.11.4. BeNeLux: Market Size and Forecast, By Product Type, 2023 – 2033 ($ Million) 11.3.12. RUSSIA 11.3.12.1. Russia: Market Size and Forecast, By Material, 2023 – 2033 ($ Million) 11.3.12.2. Russia: Market Size and Forecast, By Application, 2023 – 2033 ($ Million) 11.3.12.3. Russia: Market Size and Forecast, By End Use, 2023 – 2033 ($ Million) 11.3.12.4. Russia: Market Size and Forecast, By Product Type, 2023 – 2033 ($ Million) 11.3.13. REST OF EUROPE 11.3.13.1. Rest of Europe: Market Size and Forecast, By Material, 2023 – 2033 ($ Million) 11.3.13.2. Rest of Europe: Market Size and Forecast, By Application, 2023 – 2033 ($ Million) 11.3.13.3. Rest of Europe: Market Size and Forecast, By End Use, 2023 – 2033 ($ Million) 11.3.13.4. Rest of Europe: Market Size and Forecast, By Product Type, 2023 – 2033 ($ Million) 11.4. Asia Pacific 11.4.1. Asia Pacific: Market Size and Forecast, By Country, 2023 – 2033 ($ Million) 11.4.2. Asia Pacific: Market Size and Forecast, By Material, 2023 – 2033 ($ Million) 11.4.3. Asia Pacific: Market Size and Forecast, By Application, 2023 – 2033 ($ Million) 11.4.4. Asia Pacific: Market Size and Forecast, By End Use, 2023 – 2033 ($ Million) 11.4.5. Asia Pacific: Market Size and Forecast, By Product Type, 2023 – 2033 ($ Million) 11.4.6. CHINA 11.4.6.1. China: Market Size and Forecast, By Material, 2023 – 2033 ($ Million) 11.4.6.2. China: Market Size and Forecast, By Application, 2023 – 2033 ($ Million) 11.4.6.3. China: Market Size and Forecast, By End Use, 2023 – 2033 ($ Million) 11.4.6.4. China: Market Size and Forecast, By Product Type, 2023 – 2033 ($ Million) 11.4.7. JAPAN 11.4.7.1. Japan: Market Size and Forecast, By Material, 2023 – 2033 ($ Million) 11.4.7.2. Japan: Market Size and Forecast, By Application, 2023 – 2033 ($ Million) 11.4.7.3. Japan: Market Size and Forecast, By End Use, 2023 – 2033 ($ Million) 11.4.7.4. Japan: Market Size and Forecast, By Product Type, 2023 – 2033 ($ Million) 11.4.8. INDIA 11.4.8.1. India: Market Size and Forecast, By Material, 2023 – 2033 ($ Million) 11.4.8.2. India: Market Size and Forecast, By Application, 2023 – 2033 ($ Million) 11.4.8.3. India: Market Size and Forecast, By End Use, 2023 – 2033 ($ Million) 11.4.8.4. India: Market Size and Forecast, By Product Type, 2023 – 2033 ($ Million) 11.4.9. SOUTH KOREA 11.4.9.1. South Korea: Market Size and Forecast, By Material, 2023 – 2033 ($ Million) 11.4.9.2. South Korea: Market Size and Forecast, By Application, 2023 – 2033 ($ Million) 11.4.9.3. South Korea: Market Size and Forecast, By End Use, 2023 – 2033 ($ Million) 11.4.9.4. South Korea: Market Size and Forecast, By Product Type, 2023 – 2033 ($ Million) 11.4.10. THAILAND 11.4.10.1. Thailand: Market Size and Forecast, By Material, 2023 – 2033 ($ Million) 11.4.10.2. Thailand: Market Size and Forecast, By Application, 2023 – 2033 ($ Million) 11.4.10.3. Thailand: Market Size and Forecast, By End Use, 2023 – 2033 ($ Million) 11.4.10.4. Thailand: Market Size and Forecast, By Product Type, 2023 – 2033 ($ Million) 11.4.11. INDONESIA 11.4.11.1. Indonesia: Market Size and Forecast, By Material, 2023 – 2033 ($ Million) 11.4.11.2. Indonesia: Market Size and Forecast, By Application, 2023 – 2033 ($ Million) 11.4.11.3. Indonesia: Market Size and Forecast, By End Use, 2023 – 2033 ($ Million) 11.4.11.4. Indonesia: Market Size and Forecast, By Product Type, 2023 – 2033 ($ Million) 11.4.12. MALAYSIA 11.4.12.1. Malaysia: Market Size and Forecast, By Material, 2023 – 2033 ($ Million) 11.4.12.2. Malaysia: Market Size and Forecast, By Application, 2023 – 2033 ($ Million) 11.4.12.3. Malaysia: Market Size and Forecast, By End Use, 2023 – 2033 ($ Million) 11.4.12.4. Malaysia: Market Size and Forecast, By Product Type, 2023 – 2033 ($ Million) 11.4.13. AUSTRALIA 11.4.13.1. Australia: Market Size and Forecast, By Material, 2023 – 2033 ($ Million) 11.4.13.2. Australia: Market Size and Forecast, By Application, 2023 – 2033 ($ Million) 11.4.13.3. Australia: Market Size and Forecast, By End Use, 2023 – 2033 ($ Million) 11.4.13.4. Australia: Market Size and Forecast, By Product Type, 2023 – 2033 ($ Million) 11.4.14. REST FO ASIA PACIFIC 11.4.14.1. Rest fo Asia Pacific: Market Size and Forecast, By Material, 2023 – 2033 ($ Million) 11.4.14.2. Rest fo Asia Pacific: Market Size and Forecast, By Application, 2023 – 2033 ($ Million) 11.4.14.3. Rest fo Asia Pacific: Market Size and Forecast, By End Use, 2023 – 2033 ($ Million) 11.4.14.4. Rest fo Asia Pacific: Market Size and Forecast, By Product Type, 2023 – 2033 ($ Million) 11.5. South America 11.5.1. South America: Market Size and Forecast, By Country, 2023 – 2033 ($ Million) 11.5.2. South America: Market Size and Forecast, By Material, 2023 – 2033 ($ Million) 11.5.3. South America: Market Size and Forecast, By Application, 2023 – 2033 ($ Million) 11.5.4. South America: Market Size and Forecast, By End Use, 2023 – 2033 ($ Million) 11.5.5. South America: Market Size and Forecast, By Product Type, 2023 – 2033 ($ Million) 11.5.6. BRAZIL 11.5.6.1. Brazil: Market Size and Forecast, By Material, 2023 – 2033 ($ Million) 11.5.6.2. Brazil: Market Size and Forecast, By Application, 2023 – 2033 ($ Million) 11.5.6.3. Brazil: Market Size and Forecast, By End Use, 2023 – 2033 ($ Million) 11.5.6.4. Brazil: Market Size and Forecast, By Product Type, 2023 – 2033 ($ Million) 11.5.7. ARGENTINA 11.5.7.1. Argentina: Market Size and Forecast, By Material, 2023 – 2033 ($ Million) 11.5.7.2. Argentina: Market Size and Forecast, By Application, 2023 – 2033 ($ Million) 11.5.7.3. Argentina: Market Size and Forecast, By End Use, 2023 – 2033 ($ Million) 11.5.7.4. Argentina: Market Size and Forecast, By Product Type, 2023 – 2033 ($ Million) 11.5.8. REST OF SOUTH AMERICA 11.5.8.1. Rest of South America: Market Size and Forecast, By Material, 2023 – 2033 ($ Million) 11.5.8.2. Rest of South America: Market Size and Forecast, By Application, 2023 – 2033 ($ Million) 11.5.8.3. Rest of South America: Market Size and Forecast, By End Use, 2023 – 2033 ($ Million) 11.5.8.4. Rest of South America: Market Size and Forecast, By Productb Type, 2023 – 2033 ($ Million) 11.6. Middle East & Africa 11.6.1. Middle East & Africa: Market Size and Forecast, By Country, 2023 – 2033 ($ Million) 11.6.2. Middle East & Africa: Market Size and Forecast, By Material, 2023 – 2033 ($ Million) 11.6.3. Middle East & Africa: Market Size and Forecast, By Application, 2023 – 2033 ($ Million) 11.6.4. Middle East & Africa: Market Size and Forecast, By End Use, 2023 – 2033 ($ Million) 11.6.5. Middle East & Africa: Market Size and Forecast, By Product Type, 2023 – 2033 ($ Million) 11.6.6. SAUDI ARABIA 11.6.6.1. Saudi Arabia: Market Size and Forecast, By Material, 2023 – 2033 ($ Million) 11.6.6.2. Saudi Arabia: Market Size and Forecast, By Application, 2023 – 2033 ($ Million) 11.6.6.3. Saudi Arabia: Market Size and Forecast, By End Use, 2023 – 2033 ($ Million) 11.6.6.4. Saudi Arabia: Market Size and Forecast, By Product Type, 2023 – 2033 ($ Million) 11.6.7. UAE 11.6.7.1. UAE: Market Size and Forecast, By Material, 2023 – 2033 ($ Million) 11.6.7.2. UAE: Market Size and Forecast, By Application, 2023 – 2033 ($ Million) 11.6.7.3. UAE: Market Size and Forecast, By End Use, 2023 – 2033 ($ Million) 11.6.7.4. UAE: Market Size and Forecast, By Product Type, 2023 – 2033 ($ Million) 11.6.8. EGYPT 11.6.8.1. Egypt: Market Size and Forecast, By Material, 2023 – 2033 ($ Million) 11.6.8.2. Egypt: Market Size and Forecast, By Application, 2023 – 2033 ($ Million) 11.6.8.3. Egypt: Market Size and Forecast, By End Use, 2023 – 2033 ($ Million) 11.6.8.4. Egypt: Market Size and Forecast, By Product Type, 2023 – 2033 ($ Million) 11.6.9. SOUTH AFRICA 11.6.9.1. South Africa: Market Size and Forecast, By Material, 2023 – 2033 ($ Million) 11.6.9.2. South Africa: Market Size and Forecast, By Application, 2023 – 2033 ($ Million) 11.6.9.3. South Africa: Market Size and Forecast, By End Use, 2023 – 2033 ($ Million) 11.6.9.4. South Africa: Market Size and Forecast, By Product Type, 2023 – 2033 ($ Million) 11.6.10. REST OF MIDDLE EAST & AFRICA 11.6.10.1. Rest of Middle East & Africa: Market Size and Forecast, By Material, 2023 – 2033 ($ Million) 11.6.10.2. Rest of Middle East & Africa: Market Size and Forecast, By Application, 2023 – 2033 ($ Million) 11.6.10.3. Rest of Middle East & Africa: Market Size and Forecast, By End Use, 2023 – 2033 ($ Million) 11.6.10.4. Rest of Middle East & Africa: Market Size and Forecast, By Product Type, 2023 – 2033 ($ Million) CHAPTER 12. Competitive Landscape 12.1. Competitior Benchmarking 2023 12.2. Market Share Analysis 12.3. Key Developments Analysis By Top 5 Companies 12.4. Market Share Acquisition Strategies: Analysis of Key Approaches Employed by Top Players CHAPTER 13. Company Profiles 13.1. LIXIL Group Corporation 13.1.1. Business Overview 13.1.2. Financial Analysis 13.1.2.1. Business Segment Revenue, 2018, 2019, 2020, $ Million 13.1.2.2. Geographic Revenue Mix, 2020 (% Share) 13.1.3. Product Portfolio 13.1.4. Recent Development and Strategies Adopted 13.1.5. SWOT Analysis 13.2. Fortune Brands Home & Security Inc. 13.3. Paini (UK) Ltd 13.4. MASCO corporation 13.5. Sloan Valve Company 13.6. Roca Sanitario S.A 13.7. TOTO Ltd. 13.8. Spectrum Brands 13.9. Danze Inc 13.10. Rohl LLC