Event Management Software Market Analysis and Global Forecast 2023-2033
$ 1,390.00 – $ 5,520.00
Event Management Software Market Research Report: By Component (Solution and Service), By Deployment Type (On Premises, Cloud), By Organization Size (Small and Medium-sized Enterprises (SMEs), Large Enterprises), By End User (Event Organizers and planners, Corporate, Government, Education, Others), and by Region — Forecast till 2033
Page: 171
Event Management Software Market Overview
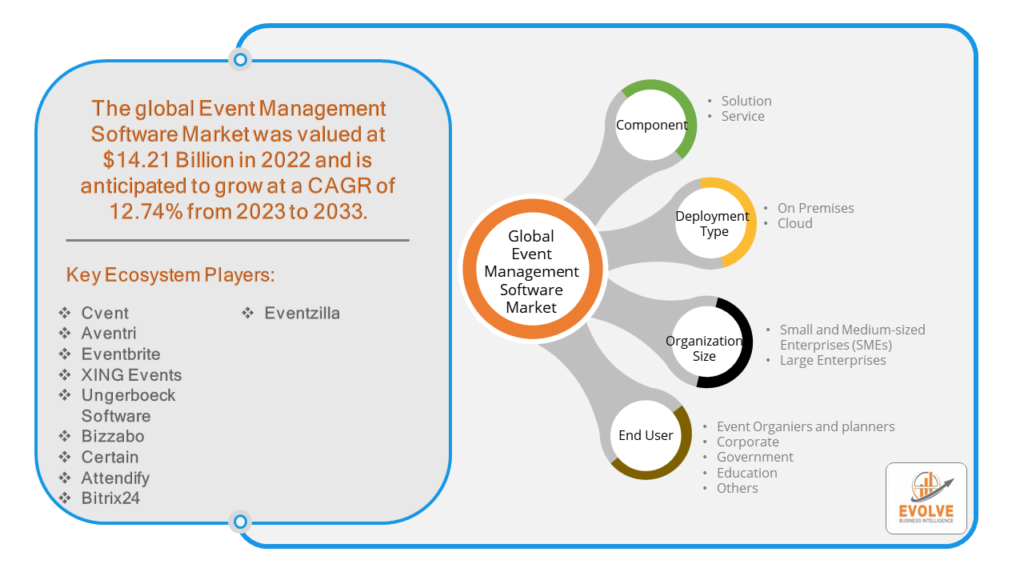
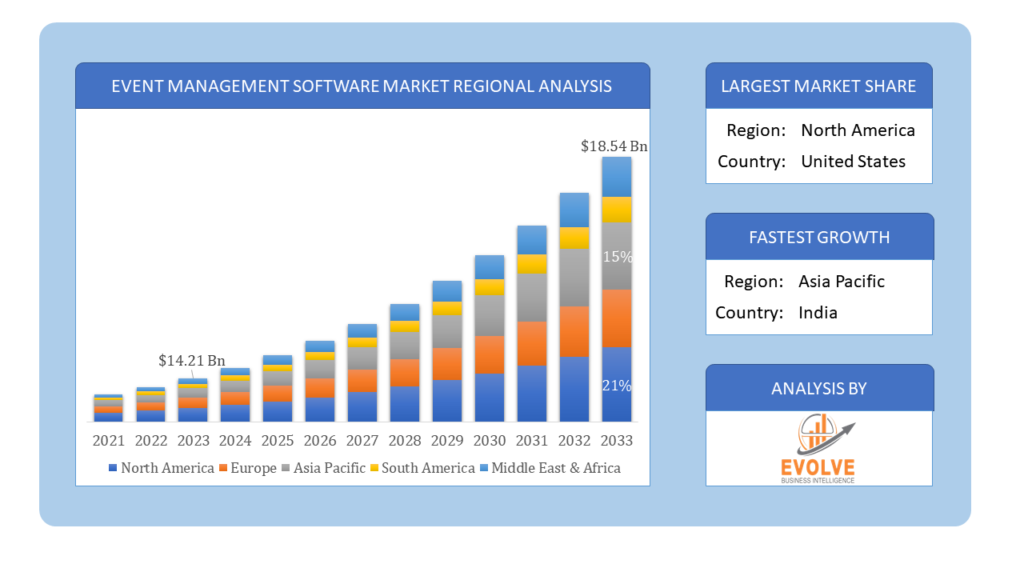
Event Management Software Market Size is expected to reach USD 18.54 Billion by 2033. The Event Management Software industry size accounted for USD 14.21 Billion in 2023 and is expected to expand at a compound annual growth rate (CAGR) of 12.74% from 2023 to 2033. The Event Management Software (EMS) market encompasses a range of digital solutions designed to streamline and automate the planning, organization, and execution of events. These platforms offer functionalities such as registration, ticketing, attendee engagement, analytics, and post-event feedback. The market is driven by the increasing demand for virtual and hybrid events, enhanced user experience, and the need for efficient data management. Key players provide tailored solutions catering to various event types, from corporate conferences to large-scale trade shows, contributing to the market’s robust growth.
Global Event Management Software Market Synopsis
The Event Management Software market experienced a detrimental effect due to the Covid-19 pandemic. The COVID-19 pandemic has led to supply chain disruptions leading to supply shortages or lower demand in the event management software market. The travel restrictions and social-distancing measures have resulted in a sharp drop in consumer and business spending and this pattern is to continue for some time. The end-user trend and preferences have changed due to the pandemic and have resulted in manufacturers, developers, and service providers to adopt various strategies to stabilize the company.
Global Event Management Software Market Dynamics
The major factors that have impacted the growth of Event Management Software are as follows:
Drivers:
⮚ Increasing Demand for Virtual and Hybrid Events
The shift towards virtual and hybrid event formats has been a significant driver in the EMS market, especially in the wake of the COVID-19 pandemic. Virtual events eliminate geographical barriers, allowing for greater participation and accessibility. Hybrid events, which combine in-person and virtual experiences, require sophisticated EMS platforms to manage both aspects seamlessly. This trend is expected to continue as organizations recognize the benefits of reaching a broader audience while reducing travel costs and logistical challenges.
Restraint:
- High Initial Costs
One of the most significant restraints in the EMS market is the high initial investment required for advanced software solutions. These costs can include licensing fees, setup charges, customization expenses, and training for staff. For smaller organizations or those with limited budgets, this financial barrier can deter adoption, pushing them to rely on less sophisticated or manual methods of event management.
Opportunity:
⮚ Advances in Artificial Intelligence and Machine Learning
The integration of artificial intelligence (AI) and machine learning (ML) into EMS platforms offers vast opportunities for innovation and differentiation. AI and ML can enhance various aspects of event management, from personalized attendee experiences and predictive analytics to automated customer support and intelligent matchmaking. By leveraging these technologies, EMS providers can offer more sophisticated and efficient solutions, helping event organizers improve engagement, optimize resource allocation, and gain deeper insights into attendee behavior.
Event Management Software Market Segment Overview
By Component
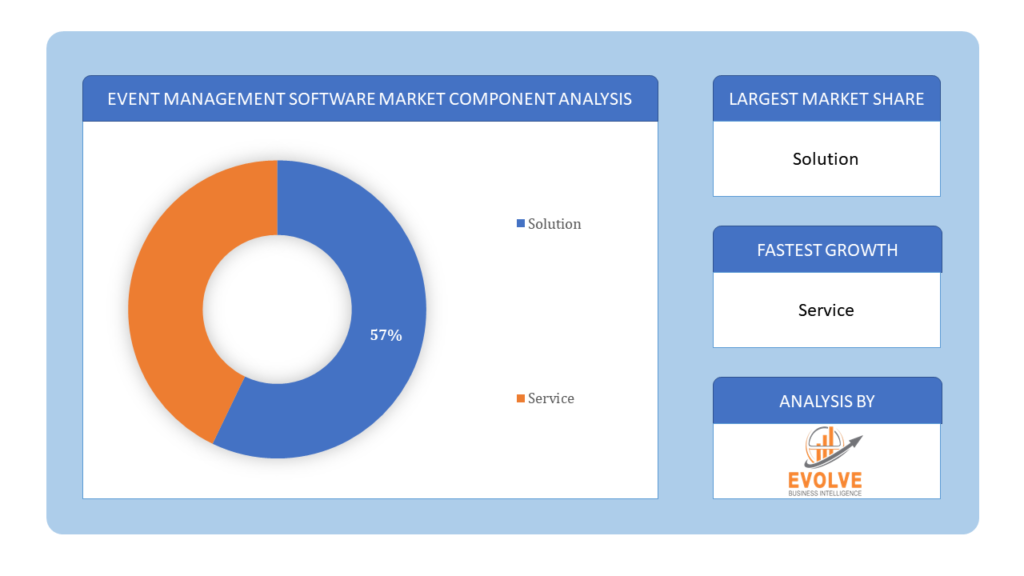
Based on the Component, the market is segmented based on Solution and Service. The Solution segment dominates as it encompasses comprehensive tools and platforms that offer end-to-end functionalities essential for effective event planning, management, and execution.
By Deployment Type
Based on Deployment Type , the market has been divided into On Premises, Cloud.. The Cloud segment dominates due to its scalability, cost-effectiveness, and the growing preference for remote access and flexibility in managing events from anywhere.
By Organization Size
Based on the Organization Size , the market has been divided into Small and Medium-sized Enterprises (SMEs), Large Enterprises . The Large Enterprises segment dominates due to their greater financial resources and more extensive event management needs, driving higher adoption of comprehensive EMS solutions.
By End User
Based on End User, the market has been divided into Event Organizers and planners, Corporate, Government, Education, Others. Among these, the Corporate segment dominates due to the high volume of business events and the need for streamlined event management solutions to enhance efficiency and engagement.
Global Event Management Software Market Regional Analysis
Based on region, the market has been divided into North America, Europe, Asia-Pacific, the Middle East & Africa, and Latin America. The area of North America is anticipated to dominate the market for the usage of Event Management Software , followed by those in Asia-Pacific and Europe.
Event Management Software North America Market
The North American region holds a dominant position in the Event Management Software market. With a market share of 35.7% in 2022, North America led the pack and is predicted to continue doing so for the duration of the prediction. Furthermore, wealthy countries in this area like the US and Canada are always receptive to new and developing technologies. These countries have also continuously made investments in state-of-the-art technology to get trustworthy and attractive products.
Event Management Software Asia Pacific Market
The Asia-Pacific region is witnessing rapid growth and emerging as a significant market for the Event Management Software industry. More opportunities would also arise for the Asia-Pacific area to flourish. The proliferation of smartphones and the continuous advancement of the cloud platform are the main causes of its rise. China and India will dominate the market, which will be primarily helped by the growing business community, the IT industry, and an unlimited supply of skilled labor. Due to the significant predominance of traditional event-organizing techniques, the region’s growth is quite slow.
Competitive Landscape
The competitive landscape includes key players (tier 1, tier 2, and local) having a presence across the globe. Companies such as Cvent, Aventri, Eventbrite, XING Events, and Ungerboeck Software are some of the leading players in the global Event Management Software Industry. These players have adopted partnership, acquisition, expansion, and new product development, among others as their key strategies.
Key Market Players:
- Cvent
- Aventri
- Eventbrite
- XING Events
- Ungerboeck Software
- Bizzabo
- Certain
- Attendify
- Bitrix24
- Eventzilla
Key Development:
February 2023:- The launch of Captello’s new GOALS solution, which was created to tie various event activations into a system of goals and objectives intended to reward audiences and participants who meet or exceed engagement milestones set by event organizers, is announced. Captello is the event industry’s most complete Event Software Platform.
Scope of the Report
Global Event Management Software Market, by Component
- Solution
- Service
Global Event Management Software Market, by Deployment Type
- On Premises
- Cloud
Global Event Management Software Market, by Organization Size
- Small and Medium-sized Enterprises (SMEs)
- Large Enterprises
Global Event Management Software Market, by End User
- Event Organiers and planners
- Corporate
- Government
- Education
- Others
Global Event Management Software Market, by Region
- North America
- US
- Canada
- Mexico
- Europe
- UK
- Germany
- France
- Italy
- Spain
- Benelux
- Nordic
- Rest of Europe
- Asia Pacific
- China
- Japan
- South Korea
- Indonesia
- Austalia
- Malaysia
- India
- Rest of Asia Pacific
- South America
- Brazil
- Argentina
- Rest of South America
- Middle East & Africa
- Saudi Arabia
- UAE
- Egypt
- South Africa
- Rest of Middle East & Africa
Parameters | Indicators |
---|---|
Market Size | 2033: $18.54 Billion |
CAGR | 12.74% CAGR (2023-2033) |
Base year | 2022 |
Forecast Period | 2023-2033 |
Historical Data | 2021 |
Report Coverage | Revenue Forecast, Competitive Landscape, Growth Factors, and Trends |
Key Segmentations | Component, Deployment Type , Organization Size , End User |
Geographies Covered | North America, Europe, Asia-Pacific, Latin America, Middle East, Africa |
Key Vendors | Cvent, Aventri, Eventbrite, XING Events, Ungerboeck Software, Bizzabo, Certain, Attendify, Bitrix24, Eventzilla |
Key Market Opportunities | Big Data promotes better product designs by utilizing technologies at lower costs and with less hardware |
Key Market Drivers | Increasing demand for software solutions for managing and tracking events Increased corporate promotional strategies. Increased local sports events management |
REPORT CONTENT BRIEF:
- High-level analysis of the current and future Event Management Software Industry trends and opportunities
- Detailed analysis of current market drivers, restraining factors, and opportunities analysis in the future
- Historical market size for the year 2021, and forecast from 2023 to 2033
- Event Management Software market share analysis for each segment
- Competitor analysis with a comprehensive insight into its product segment, financial strength, and strategies adopted.
- Identifies key strategies adopted by the key players including new product development, mergers and acquisitions, joint ventures, collaborations, and partnerships.
- To identify and understand the various factors involved in the global Event Management Software market affected by the pandemic
- To provide year-on-year growth from 2022 to 2033
- To provide short-term, long-term, and overall CAGR comparison from 2022 to 2033.
- Provide Total Addressable Market (TAM) for the Global Event Management Software Market.
Press Release
Glue Stick Market to Reach USD 2.35 Billion by 2034
Podiatry Service Market to Reach USD 11.88 Billion by 2034
Microfluidics Technology Market to Reach USD 32.58 Billion by 2034
Ferric Chloride Market to Reach USD 10.65 Billion by 2034
Family Practice EMR Software Market to Reach USD 21.52 Billion by 2034
Electric Hairbrush Market to Reach USD 15.95 Billion by 2034
Daily Bamboo Products Market to Reach USD 143.52 Billion by 2034
Cross-border E-commerce Logistics Market to Reach USD 112.65 Billion by 2034
Basic Silicone Market to Reach USD 28.74 Billion by 2034
Active Insulation Market to Reach USD 5.88 Billion by 2034
Frequently Asked Questions (FAQ)
What is the study period of the Event Management Software Market?
The study period for the Event Management Software Market is from 2023 to 2033.
What is the growth rate of the Event Management Software Market?
The Event Management Software Market is expected to grow at a CAGR of 12.74% from 2023 to 2033.
Which region has the highest growth rate in the Event Management Software Market?
The Asia-Pacific region has the highest growth rate in the Event Management Software Market.
Which region has the largest share of the Event Management Software Market?
North America holds the largest share of the Event Management Software Market.
Who are the key players in the Event Management Software Market?
Key players in the Event Management Software Market include Cvent, Aventri, Eventbrite, XING Events, and Ungerboeck Software.
Do you offer Post sales support?
Yes, we offer 16 hours of analyst support to solve the queries
Do you sell particular sections of a report?
Yes, we provide regional as well as country-level reports. Other than this we also provide a sectional report. Please get in contact with our sales representatives.
Table of Content
CHAPTER 1. Executive Summary CHAPTER 2. Scope of the Study 2.1. Market Definition 2.2. Market Scope & Segmentation 2.2.1. Objective of Report CHAPTER 3. Evolve BI Methodology 3.1. Data Collection & Validation Approach 3.2. Market Size Estimation and Forecast CHAPTER 4. Exclusive Analysis 4.1. Market Opportunity Score 4.1.1. Component Segement – Market Opportunity Score 4.1.2. Deployment Type Segment – Market Opportunity Score 4.1.3. Organization Size Segment – Market Opportunity Score 4.1.4. End User Segment – Market Opportunity Score 4.2. Key Market Influencing Indicators CHAPTER 5. Market Insights and Trends 5.1. Value Chain Analysis 5.1.1. Component 5.1.2. Manufacturing Process 5.1.3. Distribution Channel 5.1.4. End User 5.2. Porter’s Five Forces Analysis 5.2.1. Bargaining Power of Buyers 5.2.2. Bargaining Power of Suppliers 5.2.3. Threat of New Entrant 5.2.4. Threat of Substitute 5.2.5. Industry Rivalry 5.3. COVID-19 Impact and Post COVID Scenario on Event Management Software Market 5.3.1. Impact of COVID-19 5.3.2. Government Support and Industry Revival Policies 5.3.3. Measures Taken by Companies to Mitigate Negative Impact 5.3.4. Post COVID Trend CHAPTER 6. MArket Dynamics 6.1. Introduction 6.2. Drivers 6.2.1. Driver 1 6.2.2. Driver 2 6.2.3. Driver 3 6.3. Restraints 6.3.1. Restraint 1 6.3.2. Restraint 2 6.4. Opportunity 6.4.1. Opportunity 1 CHAPTER 7. Global Event Management Software Market, By Component 7.1. Introduction 7.1.1. Solution 7.1.2. Service CHAPTER 8. Global Event Management Software Market, By Deployment Type 8.1. Introduction 8.1.1. On Premises 8.1.2. Cloud CHAPTER 9. Global Event Management Software Market, By Organization Size 9.1. Introduction 9.1.1. Small and Medium-sized Enterprises (SMEs) 9.1.2. Large Enterprises CHAPTER 10. Global Event Management Software Market, By End User 10.1. Introduction 10.1.1. Event Organiers and planners 10.1.2. Corporate 10.1.3. Government 10.1.4. Education 10.1.5. Others CHAPTER 11. Global Event Management Software Market, By Region 11.1. Introduction 11.2. NORTH AMERICA 11.2.1. North America: Market Size and Forecast, By Country, 2023 – 2033 ($ Million) 11.2.2. North America: Market Size and Forecast, By Component, 2023 – 2033 ($ Million) 11.2.3. North America: Market Size and Forecast, By Deployment Type , 2023 – 2033 ($ Million) 11.2.4. North America: Market Size and Forecast, By Organization Size , 2023 – 2033 ($ Million) 11.2.5. North America: Market Size and Forecast, By End User,2023 – 2033 ($ Million) 11.2.6. US 11.2.6.1. US: Market Size and Forecast, By Component, 2023 – 2033 ($ Million) 11.2.6.2. US: Market Size and Forecast, By Deployment Type , 2023 – 2033 ($ Million) 11.2.6.3. US: Market Size and Forecast, By Organization Size , 2023 – 2033 ($ Million) 11.2.6.4. US: Market Size and Forecast, By End User,2023 – 2033 ($ Million) 11.2.7. CANADA 11.2.7.1. Canada: Market Size and Forecast, By Component, 2023 – 2033 ($ Million) 11.2.7.2. Canada: Market Size and Forecast, By Deployment Type , 2023 – 2033 ($ Million) 11.2.7.3. Canada: Market Size and Forecast, By Organization Size , 2023 – 2033 ($ Million) 11.2.7.4. Canada: Market Size and Forecast, By End User,2023 – 2033 ($ Million) 11.2.8. MEXICO 11.2.8.1. Mexico: Market Size and Forecast, By Component, 2023 – 2033 ($ Million) 11.2.8.2. Mexico: Market Size and Forecast, By Deployment Type , 2023 – 2033 ($ Million) 11.2.8.3. Mexico: Market Size and Forecast, By Organization Size , 2023 – 2033 ($ Million) 11.2.8.4. Mexico: Market Size and Forecast, By End User,2023 – 2033 ($ Million) 11.3. Europe 11.3.1. Europe: Market Size and Forecast, By Country, 2023 – 2033 ($ Million) 11.3.2. Europe: Market Size and Forecast, By Component, 2023 – 2033 ($ Million) 11.3.3. Europe: Market Size and Forecast, By Deployment Type , 2023 – 2033 ($ Million) 11.3.4. Europe: Market Size and Forecast, By Organization Size , 2023 – 2033 ($ Million) 11.3.5. Europe: Market Size and Forecast, By End User,2023 – 2033 ($ Million) 11.3.6. U.K. 11.3.6.1. U.K.: Market Size and Forecast, By Component, 2023 – 2033 ($ Million) 11.3.6.2. U.K.: Market Size and Forecast, By Deployment Type , 2023 – 2033 ($ Million) 11.3.6.3. U.K.: Market Size and Forecast, By Organization Size , 2023 – 2033 ($ Million) 11.3.6.4. U.K.: Market Size and Forecast, By End User,2023 – 2033 ($ Million) 11.3.7. GERMANY 11.3.7.1. Germany: Market Size and Forecast, By Component, 2023 – 2033 ($ Million) 11.3.7.2. Germany: Market Size and Forecast, By Deployment Type , 2023 – 2033 ($ Million) 11.3.7.3. Germany: Market Size and Forecast, By Organization Size , 2023 – 2033 ($ Million) 11.3.7.4. Germany: Market Size and Forecast, By End User,2023 – 2033 ($ Million) 11.3.8. FRANCE 11.3.8.1. France: Market Size and Forecast, By Component, 2023 – 2033 ($ Million) 11.3.8.2. France: Market Size and Forecast, By Deployment Type , 2023 – 2033 ($ Million) 11.3.8.3. France: Market Size and Forecast, By Organization Size , 2023 – 2033 ($ Million) 11.3.8.4. France: Market Size and Forecast, By End User,2023 – 2033 ($ Million) 11.3.9. ITALY 11.3.9.1. Italy: Market Size and Forecast, By Component, 2023 – 2033 ($ Million) 11.3.9.2. Italy: Market Size and Forecast, By Deployment Type , 2023 – 2033 ($ Million) 11.3.9.3. Italy: Market Size and Forecast, By Organization Size , 2023 – 2033 ($ Million) 11.3.9.4. Italy: Market Size and Forecast, By End User,2023 – 2033 ($ Million) 11.3.10. SPAIN 11.3.10.1. Spain: Market Size and Forecast, By Component, 2023 – 2033 ($ Million) 11.3.10.2. Spain: Market Size and Forecast, By Deployment Type , 2023 – 2033 ($ Million) 11.3.10.3. Spain: Market Size and Forecast, By Organization Size , 2023 – 2033 ($ Million) 11.3.10.4. Spain: Market Size and Forecast, By End User,2023 – 2033 ($ Million) 11.3.11. BENELUX 11.3.11.1. BeNeLux: Market Size and Forecast, By Component, 2023 – 2033 ($ Million) 11.3.11.2. BeNeLux: Market Size and Forecast, By Deployment Type , 2023 – 2033 ($ Million) 11.3.11.3. BeNeLux: Market Size and Forecast, By Organization Size , 2023 – 2033 ($ Million) 11.3.11.4. BeNeLux: Market Size and Forecast, By End User,2023 – 2033 ($ Million) 11.3.12. RUSSIA 11.3.12.1. Russia: Market Size and Forecast, By Component, 2023 – 2033 ($ Million) 11.3.12.2. Russia: Market Size and Forecast, By Deployment Type , 2023 – 2033 ($ Million) 11.3.12.3. Russia: Market Size and Forecast, By Organization Size , 2023 – 2033 ($ Million) 11.3.12.4. Russia: Market Size and Forecast, By End User,2023 – 2033 ($ Million) 11.3.13. REST OF EUROPE 11.3.13.1. Rest of Europe: Market Size and Forecast, By Component, 2023 – 2033 ($ Million) 11.3.13.2. Rest of Europe: Market Size and Forecast, By Deployment Type , 2023 – 2033 ($ Million) 11.3.13.3. Rest of Europe: Market Size and Forecast, By Organization Size , 2023 – 2033 ($ Million) 11.3.13.4. Rest of Europe: Market Size and Forecast, By End User,2023 – 2033 ($ Million) 11.4. Asia Pacific 11.4.1. Asia Pacific: Market Size and Forecast, By Country, 2023 – 2033 ($ Million) 11.4.2. Asia Pacific: Market Size and Forecast, By Component, 2023 – 2033 ($ Million) 11.4.3. Asia Pacific: Market Size and Forecast, By Deployment Type , 2023 – 2033 ($ Million) 11.4.4. Asia Pacific: Market Size and Forecast, By Organization Size , 2023 – 2033 ($ Million) 11.4.5. Asia Pacific: Market Size and Forecast, By End User,2023 – 2033 ($ Million) 11.4.6. CHINA 11.4.6.1. China: Market Size and Forecast, By Component, 2023 – 2033 ($ Million) 11.4.6.2. China: Market Size and Forecast, By Deployment Type , 2023 – 2033 ($ Million) 11.4.6.3. China: Market Size and Forecast, By Organization Size , 2023 – 2033 ($ Million) 11.4.6.4. China: Market Size and Forecast, By End User,2023 – 2033 ($ Million) 11.4.7. JAPAN 11.4.7.1. Japan: Market Size and Forecast, By Component, 2023 – 2033 ($ Million) 11.4.7.2. Japan: Market Size and Forecast, By Deployment Type , 2023 – 2033 ($ Million) 11.4.7.3. Japan: Market Size and Forecast, By Organization Size , 2023 – 2033 ($ Million) 11.4.7.4. Japan: Market Size and Forecast, By End User,2023 – 2033 ($ Million) 11.4.8. INDIA 11.4.8.1. India: Market Size and Forecast, By Component, 2023 – 2033 ($ Million) 11.4.8.2. India: Market Size and Forecast, By Deployment Type , 2023 – 2033 ($ Million) 11.4.8.3. India: Market Size and Forecast, By Organization Size , 2023 – 2033 ($ Million) 11.4.8.4. India: Market Size and Forecast, By End User,2023 – 2033 ($ Million) 11.4.9. SOUTH KOREA 11.4.9.1. South Korea: Market Size and Forecast, By Component, 2023 – 2033 ($ Million) 11.4.9.2. South Korea: Market Size and Forecast, By Deployment Type , 2023 – 2033 ($ Million) 11.4.9.3. South Korea: Market Size and Forecast, By Organization Size , 2023 – 2033 ($ Million) 11.4.9.4. South Korea: Market Size and Forecast, By End User,2023 – 2033 ($ Million) 11.4.10. THAILAND 11.4.10.1. Thailand: Market Size and Forecast, By Component, 2023 – 2033 ($ Million) 11.4.10.2. Thailand: Market Size and Forecast, By Deployment Type , 2023 – 2033 ($ Million) 11.4.10.3. Thailand: Market Size and Forecast, By Organization Size , 2023 – 2033 ($ Million) 11.4.10.4. Thailand: Market Size and Forecast, By End User,2023 – 2033 ($ Million) 11.4.11. INDONESIA 11.4.11.1. Indonesia: Market Size and Forecast, By Component, 2023 – 2033 ($ Million) 11.4.11.2. Indonesia: Market Size and Forecast, By Deployment Type , 2023 – 2033 ($ Million) 11.4.11.3. Indonesia: Market Size and Forecast, By Organization Size , 2023 – 2033 ($ Million) 11.4.11.4. Indonesia: Market Size and Forecast, By End User,2023 – 2033 ($ Million) 11.4.12. MALAYSIA 11.4.12.1. Malaysia: Market Size and Forecast, By Component, 2023 – 2033 ($ Million) 11.4.12.2. Malaysia: Market Size and Forecast, By Deployment Type , 2023 – 2033 ($ Million) 11.4.12.3. Malaysia: Market Size and Forecast, By Organization Size , 2023 – 2033 ($ Million) 11.4.12.4. Malaysia: Market Size and Forecast, By End User,2023 – 2033 ($ Million) 11.4.13. AUSTRALIA 11.4.13.1. Australia: Market Size and Forecast, By Component, 2023 – 2033 ($ Million) 11.4.13.2. Australia: Market Size and Forecast, By Deployment Type , 2023 – 2033 ($ Million) 11.4.13.3. Australia: Market Size and Forecast, By Organization Size , 2023 – 2033 ($ Million) 11.4.13.4. Australia: Market Size and Forecast, By End User,2023 – 2033 ($ Million) 11.4.14. REST FO ASIA PACIFIC 11.4.14.1. Rest fo Asia Pacific: Market Size and Forecast, By Component, 2023 – 2033 ($ Million) 11.4.14.2. Rest fo Asia Pacific: Market Size and Forecast, By Deployment Type , 2023 – 2033 ($ Million) 11.4.14.3. Rest fo Asia Pacific: Market Size and Forecast, By Organization Size , 2023 – 2033 ($ Million) 11.4.14.4. Rest fo Asia Pacific: Market Size and Forecast, By End User,2023 – 2033 ($ Million) 11.5. South America 11.5.1. South America: Market Size and Forecast, By Country, 2023 – 2033 ($ Million) 11.5.2. South America: Market Size and Forecast, By Component, 2023 – 2033 ($ Million) 11.5.3. South America: Market Size and Forecast, By Deployment Type , 2023 – 2033 ($ Million) 11.5.4. South America: Market Size and Forecast, By Organization Size , 2023 – 2033 ($ Million) 11.5.5. South America: Market Size and Forecast, By End User,2023 – 2033 ($ Million) 11.5.6. BRAZIL 11.5.6.1. Brazil: Market Size and Forecast, By Component, 2023 – 2033 ($ Million) 11.5.6.2. Brazil: Market Size and Forecast, By Deployment Type , 2023 – 2033 ($ Million) 11.5.6.3. Brazil: Market Size and Forecast, By Organization Size , 2023 – 2033 ($ Million) 11.5.6.4. Brazil: Market Size and Forecast, By End User,2023 – 2033 ($ Million) 11.5.7. ARGENTINA 11.5.7.1. Argentina: Market Size and Forecast, By Component, 2023 – 2033 ($ Million) 11.5.7.2. Argentina: Market Size and Forecast, By Deployment Type , 2023 – 2033 ($ Million) 11.5.7.3. Argentina: Market Size and Forecast, By Organization Size , 2023 – 2033 ($ Million) 11.5.7.4. Argentina: Market Size and Forecast, By End User,2023 – 2033 ($ Million) 11.5.8. REST OF SOUTH AMERICA 11.5.8.1. Rest of South America: Market Size and Forecast, By Component, 2023 – 2033 ($ Million) 11.5.8.2. Rest of South America: Market Size and Forecast, By Deployment Type , 2023 – 2033 ($ Million) 11.5.8.3. Rest of South America: Market Size and Forecast, By Organization Size , 2023 – 2033 ($ Million) 11.5.8.4. Rest of South America: Market Size and Forecast, By End User,2023 – 2033 ($ Million) 11.6. Middle East & Africa 11.6.1. Middle East & Africa: Market Size and Forecast, By Country, 2023 – 2033 ($ Million) 11.6.2. Middle East & Africa: Market Size and Forecast, By Component, 2023 – 2033 ($ Million) 11.6.3. Middle East & Africa: Market Size and Forecast, By Deployment Type , 2023 – 2033 ($ Million) 11.6.4. Middle East & Africa: Market Size and Forecast, By Organization Size , 2023 – 2033 ($ Million) 11.6.5. Middle East & Africa: Market Size and Forecast, By End User,2023 – 2033 ($ Million) 11.6.6. SAUDI ARABIA 11.6.6.1. Saudi Arabia: Market Size and Forecast, By Component, 2023 – 2033 ($ Million) 11.6.6.2. Saudi Arabia: Market Size and Forecast, By Deployment Type , 2023 – 2033 ($ Million) 11.6.6.3. Saudi Arabia: Market Size and Forecast, By Organization Size , 2023 – 2033 ($ Million) 11.6.6.4. Saudi Arabia: Market Size and Forecast, By End User,2023 – 2033 ($ Million) 11.6.7. UAE 11.6.7.1. UAE: Market Size and Forecast, By Component, 2023 – 2033 ($ Million) 11.6.7.2. UAE: Market Size and Forecast, By Deployment Type , 2023 – 2033 ($ Million) 11.6.7.3. UAE: Market Size and Forecast, By Organization Size , 2023 – 2033 ($ Million) 11.6.7.4. UAE: Market Size and Forecast, By End User,2023 – 2033 ($ Million) 11.6.8. EGYPT 11.6.8.1. Egypt: Market Size and Forecast, By Component, 2023 – 2033 ($ Million) 11.6.8.2. Egypt: Market Size and Forecast, By Deployment Type , 2023 – 2033 ($ Million) 11.6.8.3. Egypt: Market Size and Forecast, By Organization Size , 2023 – 2033 ($ Million) 11.6.8.4. Egypt: Market Size and Forecast, By End User,2023 – 2033 ($ Million) 11.6.9. SOUTH AFRICA 11.6.9.1. South Africa: Market Size and Forecast, By Component, 2023 – 2033 ($ Million) 11.6.9.2. South Africa: Market Size and Forecast, By Deployment Type , 2023 – 2033 ($ Million) 11.6.9.3. South Africa: Market Size and Forecast, By Organization Size , 2023 – 2033 ($ Million) 11.6.9.4. South Africa: Market Size and Forecast, By End User,2023 – 2033 ($ Million) 11.6.10. REST OF MIDDLE EAST & AFRICA 11.6.10.1. Rest of Middle East & Africa: Market Size and Forecast, By Component, 2023 – 2033 ($ Million) 11.6.10.2. Rest of Middle East & Africa: Market Size and Forecast, By Deployment Type , 2023 – 2033 ($ Million) 11.6.10.3. Rest of Middle East & Africa: Market Size and Forecast, By Organization Size , 2023 – 2033 ($ Million) 11.6.10.4. Rest of Middle East & Africa: Market Size and Forecast, By End User,2023 – 2033 ($ Million) CHAPTER 12. Competitive Landscape 12.1. Competitior Benchmarking 2023 12.2. Market Share Analysis 12.3. Key Developments Analysis By Top 5 Companies 12.4. Market Share Acquisition Strategies: Analysis of Key Approaches Employed by Top Players CHAPTER 13. Company Profiles 13.1. Cvent 13.1.1. Business Overview 13.1.2. Financial Analysis 13.1.2.1. Business Segment Revenue, 2018, 2019, 2020, $ Million 13.1.2.2. Geographic Revenue Mix, 2020 (% Share) 13.1.3. Product Portfolio 13.1.4. Recent Development and Strategies Adopted 13.1.5. SWOT Analysis 13.2. Aventri 13.3. Eventbrite 13.4. XING Events 13.5. Ungerboeck Software 13.6. Bizzabo 13.7. Certain 13.8. Attendify 13.9. Bitrix24 13.10. Eventzilla