Daptomycin Market Analysis and Global Forecast 2023-2033
$ 1,390.00 – $ 5,520.00
Daptomycin Market Research Report: Information By Strength (350 mg, 500 mg), By Age Group (Adult, Pediatric), By Indication (Complicated Skin Structure infections, Bacteremia, Others), and by Region — Forecast till 2033
Page: 108
Daptomycin Market Overview
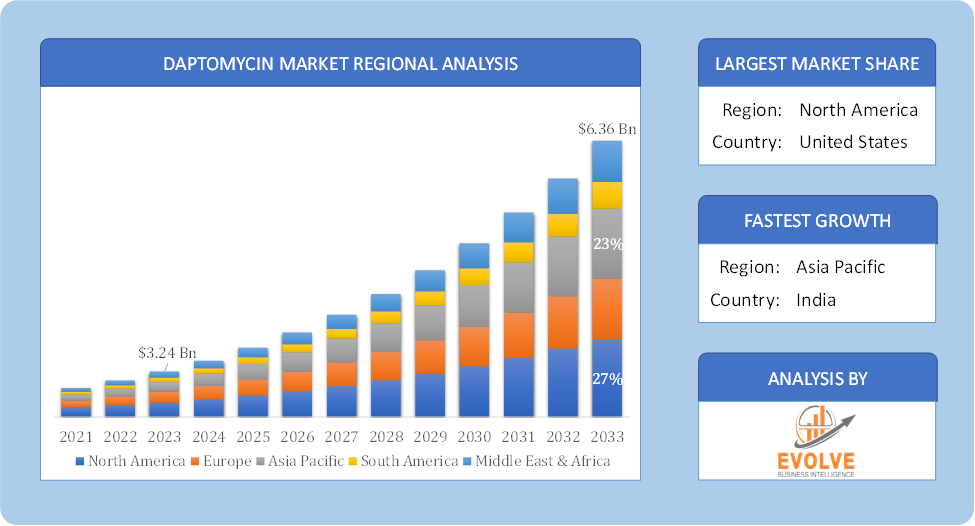
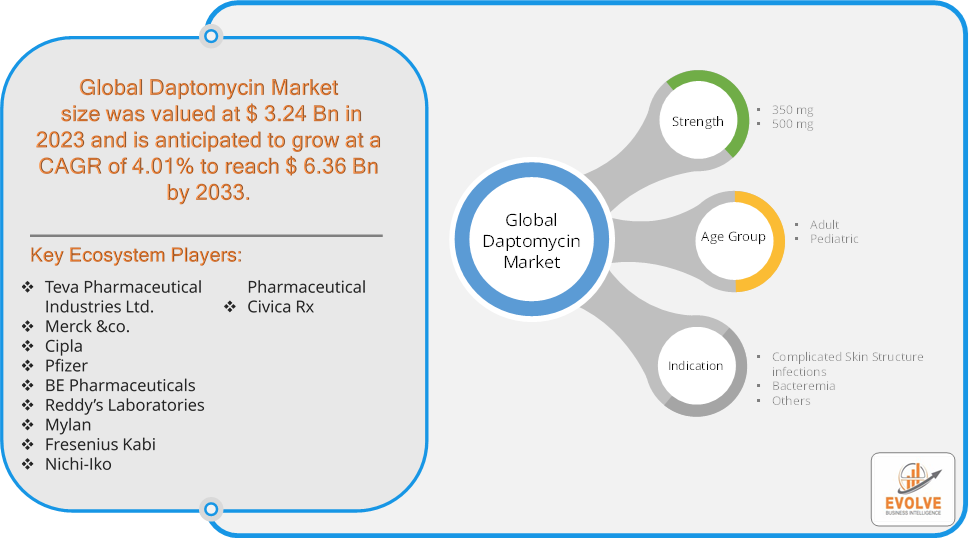
The Daptomycin Market Size is expected to reach USD 6.36 Billion by 2033. The Daptomycin Market industry size accounted for USD 3.24 Billion in 2023 and is expected to expand at a compound annual growth rate (CAGR) of 4.01% from 2023 to 2033. The Daptomycin Market refers to the global market for the antibiotic daptomycin, which is used primarily to treat complex skin infections and certain bloodstream infections caused by Gram-positive bacteria, including methicillin-resistant Staphylococcus aureus (MRSA). This market encompasses the production, distribution, and sales of daptomycin, as well as research and development activities related to its use and improvement.
The Daptomycin Market is driven by the need for effective treatments against resistant bacterial infections and is influenced by factors such as healthcare policies, research advancements, and market competition.
Global Daptomycin Market Synopsis
COVID-19 Impact Analysis
The COVID-19 pandemic had a significant impact on the Daptomycin Market. The global lockdowns and restrictions led to disruptions in manufacturing and supply chains, affecting the production and distribution of pharmaceuticals, including daptomycin. The pandemic caused shortages of raw materials and active pharmaceutical ingredients (APIs), impacting the availability of daptomycin. The pandemic led to a rise in hospital admissions, increasing the risk of hospital-acquired infections, which may have driven the demand for antibiotics like daptomycin. Heightened focus on infection control and prevention in healthcare settings may have increased awareness and usage of effective antibiotics. The pandemic highlighted the importance of effective infection control, possibly creating opportunities for new studies and trials involving daptomycin. Initial disruptions were followed by a stabilization in the demand for antibiotics as healthcare systems adapted to new pandemic-related challenges. The economic impact of the pandemic led to budget constraints in healthcare systems, potentially affecting spending on antibiotics. There may have been increased price sensitivity and a push towards more cost-effective treatments during the economic downturn caused by the pandemic.
Daptomycin Market Dynamics
The major factors that have impacted the growth of Daptomycin Market are as follows:
Drivers:
Ø Advancements in Diagnostic Techniques
Improved diagnostic technologies enable faster and more accurate detection of bacterial infections, leading to timely and appropriate use of antibiotics like daptomycin. Growing awareness about antibiotic resistance and infection control measures among healthcare professionals and the public supports the market for effective treatments like daptomycin. Initiatives and guidelines by governments and healthcare organizations to combat antibiotic resistance support the use of effective antibiotics. Rising healthcare spending in developing regions supports better access to advanced antibiotics, boosting the daptomycin market.
Restraint:
- Perception of Antibiotic Resistance and High Cost of Treatment
The potential for bacteria to develop resistance to daptomycin itself poses a significant challenge, as it can reduce the drug’s efficacy and limit its use over time. Daptomycin is primarily effective against Gram-positive bacteria, which may restrict its use in infections caused by Gram-negative bacteria. Daptomycin is often more expensive than some other antibiotics, which can be a barrier to its use, especially in low- and middle-income countries or cost-sensitive healthcare systems. Limited insurance coverage and reimbursement policies for expensive antibiotics can further restrict their use.
Opportunity:
⮚ Rising Prevalence of Resistant Infections
The growing incidence of antibiotic-resistant infections, such as MRSA, creates a significant demand for effective treatments like daptomycin. As resistance to other antibiotics increases, healthcare providers may turn to daptomycin as a reliable alternative for treating resistant bacterial infections. Growing awareness of the importance of infection control in healthcare settings can drive demand for effective antibiotics. Policies and initiatives aimed at reducing hospital-acquired infections (HAIs) may increase the use of antibiotics like daptomycin. Improvements in diagnostic technologies can lead to earlier and more accurate identification of infections, supporting the timely use of antibiotics like daptomycin.
Daptomycin Market Segment Overview
By Strength
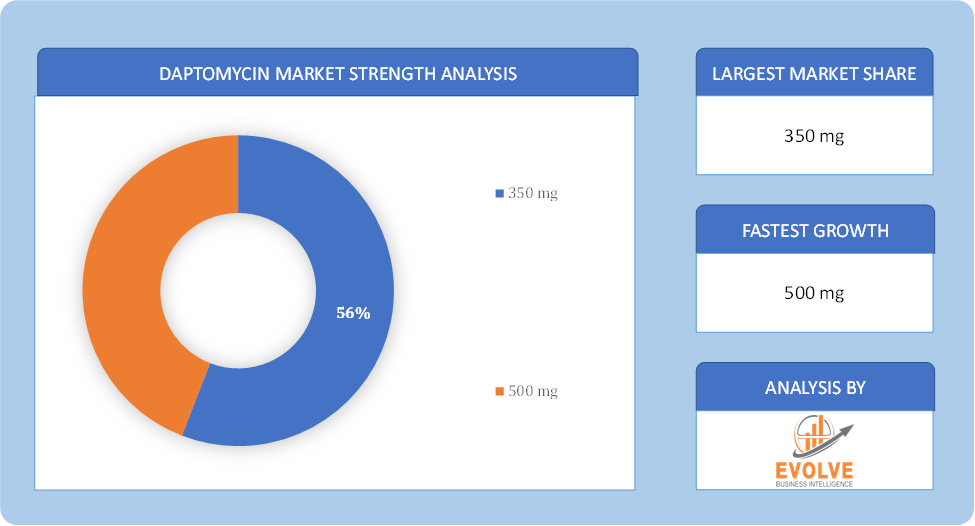
Based on Strength, the market is segmented based on 350 mg and 500 mg. The 500mg category generated the most income. 500mg is used to cure skin infections and bacterial meningitis. Daptomycin 500mg contains a semi-synthetic antibiotic related to the Polymyxins class by fermenting bacteria genetically modified to produce significant amounts of daptomycin, improving its efficacy and stability.
By Age Group
Based on Age Group, the market segment has been divided into Adult and Pediatric. The adult segment generated the maximum market revenue due to daptomycin used for treating adults suffering from bacteremia and right-sided infective endocarditis. In addition, increasing awareness regarding diseases such as periodontitis and ulcerative colitis among adults is expected to propel growth during the forecast period.
By Indication
Based on Indication, the market segment has been divided into Complicated Skin Structure infections, Bacteremia and Others. The complicated skin structure infections segment dominated the market. Increased R&D efforts by pharmaceutical and biopharmaceutical companies to develop new products and treatments and expand the prevalence and awareness of skin structure infections contribute to the segment’s growth.
Global Daptomycin Market Regional Analysis
Based on region, the global Daptomycin Market has been divided into North America, Europe, Asia-Pacific, the Middle East & Africa, and Latin America. North America is projected to dominate the use of the Daptomycin Market followed by the Asia-Pacific and Europe regions.
Daptomycin North America Market
North America holds a dominant position in the Daptomycin Market. North America is one of the largest markets for daptomycin, driven by a well-established healthcare system and high awareness of antibiotic resistance. The high prevalence of methicillin-resistant Staphylococcus aureus (MRSA) infections contributes to the demand for daptomycin. The presence of major pharmaceutical companies and a strong focus on research and development enhance market opportunities.
Daptomycin Asia-Pacific Market
The Asia-Pacific region has indeed emerged as the fastest-growing market for the Daptomycin Market industry. The Asia-Pacific region is experiencing rapid growth due to increasing healthcare expenditure and improving healthcare infrastructure. The growing prevalence of hospital-acquired infections and antibiotic resistance in countries like China and India boosts demand for daptomycin.
Competitive Landscape
The global Daptomycin Market is highly competitive, with numerous players offering a wide range of software solutions. The competitive landscape is characterized by the presence of established companies, as well as emerging startups and niche players. To increase their market position and attract a wide consumer base, the businesses are employing various strategies, such as product launches, and strategic alliances.
Prominent Players:
- Teva Pharmaceutical Industries Ltd.
- Merck &co.
- Cipla
- Pfizer
- BE Pharmaceuticals
- Reddy’s Laboratories
- Mylan
- Fresenius Kabi
- Nichi-Iko Pharmaceutical
- Civica Rx
Key Development
In September 2019, Cipla has introduced daptomycin for injection, a 500mg single dosage, AP-rated generic version of cubic in for an injection. In the US market, the injection treats complex skin conditions.
Scope of the Report
Global Daptomycin Market, by Strength
- 350 mg
- 500 mg
Global Daptomycin Market, by Age Group
- Adult
- Pediatric
Global Daptomycin Market, by Indication
- Complicated Skin Structure infections
- Bacteremia
- Others
Global Daptomycin Market, by Region
- North America
- US
- Canada
- Mexico
- Europe
- UK
- Germany
- France
- Italy
- Spain
- Benelux
- Nordic
- Rest of Europe
- Asia Pacific
- China
- Japan
- South Korea
- Indonesia
- Austalia
- Malaysia
- India
- Rest of Asia Pacific
- South America
- Brazil
- Argentina
- Rest of South America
- Middle East & Africa
- Saudi Arabia
- UAE
- Egypt
- South Africa
- Rest of Middle East & Africa
Parameters | Indicators |
---|---|
Market Size | 2033: USD 6.36 Billion |
CAGR (2023-2033) | 4.01% |
Base year | 2022 |
Forecast Period | 2023-2033 |
Historical Data | 2021 (2017 to 2020 On Demand) |
Report Coverage | Revenue Forecast, Competitive Landscape, Growth Factors, and Trends |
Key Segmentations | Strength, Age Group, Indication |
Geographies Covered | North America, Europe, Asia-Pacific, South America, Middle East, Africa |
Key Vendors | Teva Pharmaceutical Industries Ltd., Merck &co., Cipla, Pfizer, BE Pharmaceuticals, Reddy’s Laboratories, Mylan, Fresenius Kabi, Nichi-Iko Pharmaceutical and Civica Rx. |
Key Market Opportunities | · Rising Prevalence of Resistant Infections
· Increased Focus on Infection Control |
Key Market Drivers | · Advancements in Diagnostic Techniques
· Increased Focus on Infection Control |
REPORT CONTENT BRIEF:
- High-level analysis of the current and future Daptomycin Market trends and opportunities
- Detailed analysis of current market drivers, restraining factors, and opportunities in the future
- Daptomycin Market historical market size for the year 2021, and forecast from 2023 to 2033
- Daptomycin Market share analysis at each product level
- Competitor analysis with detailed insight into its product segment, Government & Defense strength, and strategies adopted.
- Identifies key strategies adopted including product launches and developments, mergers and acquisitions, joint ventures, collaborations, and partnerships as well as funding taken and investment done, among others.
- To identify and understand the various factors involved in the global Daptomycin Market affected by the pandemic
- To provide a detailed insight into the major companies operating in the market. The profiling will include the Government & Defense health of the company’s past 2-3 years with segmental and regional revenue breakup, product offering, recent developments, SWOT analysis, and key strategies.
Frequently Asked Questions (FAQ)
What is the study period of this market?
The study period of the global Daptomycin Market is 2021- 2033
What is the growth rate of the global Daptomycin Market?
The global Daptomycin Market is growing at a CAGR of 4.01% over the next 10 years
Which region has the highest growth rate in the market of Daptomycin Market?
Asia Pacific is expected to register the highest CAGR during 2023-2033
Which region has the largest share of the global Daptomycin Market?
North America holds the largest share in 2022
Who are the key players in the global Daptomycin Market?
Teva Pharmaceutical Industries Ltd., Merck &co., Cipla, Pfizer, BE Pharmaceuticals, Reddy’s Laboratories, Mylan, Fresenius Kabi, Nichi-Iko Pharmaceutical and Civica Rx are the major companies operating in the market.
Do you offer Post Sale Support?
Yes, we offer 16 hours of analyst support to solve the queries
Do you sell particular sections of a report?
Yes, we provide regional as well as country-level reports. Other than this we also provide a sectional report. Please get in contact with our sales representatives.
Press Release
Procurement Management Services Market to Reach USD 16.21 Billion by 2034
Antiseptic Soaps Market to Reach USD 5.87 Billion by 2034
Adventure Sports Travel Insurance Market to Reach USD 14.35 Billion by 2034
Pet Care Market to Reach USD 325.65 Billion by 2034
International Legal Services Market to Reach USD 4235.56 Billion by 2034
Global Business Process Automation Software Market Forecast to Reach USD 23.88 Billion by 2034, Growing at an 11.85% CAGR
Global Aviation Carbon Fiber Market Forecast to Reach USD 8.41 Billion by 2034, Growing at an 11.93% CAGR
Global Spandex Fiber Market Forecast to Reach USD 18.65 Billion by 2034, Growing at a 7.85% CAGR
Global Polymer Nanocomposites Market Forecast to Reach USD 25.65 Billion by 2034, Growing at a 5.85% CAGR
Global Vending Machine Market Forecast to Reach USD 33.98 Billion by 2034, Growing at a 17.21% CAGR
Table of Content
CHAPTER 1. Executive Summary CHAPTER 2. Scope of the Study 2.1. Market Definition 2.2. Market Scope & Segmentation 2.2.1. Objective of Report CHAPTER 3. Evolve BI Methodology 3.1. Data Collection & Validation Approach 3.2. Market Size Estimation and Forecast CHAPTER 4. Exclusive Analysis 4.1. Market Opportunity Score 4.1.1. Strength Segement – Market Opportunity Score 4.1.2. Age Group Segment – Market Opportunity Score 4.1.3. Indication Segment – Market Opportunity Score 4.2. Key Market Influencing Indicators CHAPTER 5. Market Insights and Trends 5.1. Value Chain Analysis 5.1.1. Raw Material 5.1.2. Manufacturing Process 5.1.3. Distribution Channel 5.1.4. End User 5.2. Porter’s Five Forces Analysis 5.2.1. Bargaining Power of Buyers 5.2.2. Bargaining Power of Suppliers 5.2.3. Threat of New Entrant 5.2.4. Threat of Substitute 5.2.5. Industry Rivalry 5.3. COVID-19 Impact and Post COVID Scenario on Daptomycin Market 5.3.1. Impact of COVID-19 5.3.2. Government Support and Industry Revival Policies 5.3.3. Measures Taken by Companies to Mitigate Negative Impact 5.3.4. Post COVID Trend CHAPTER 6. Market Dynamics 6.1. Introduction 6.2. Drivers 6.2.1. Driver 1 6.2.2. Driver 2 6.2.3. Driver 3 6.3. Restraints 6.3.1. Restraint 1 6.3.2. Restraint 2 6.4. Opportunity 6.4.1. Opportunity 1 CHAPTER 7. Daptomycin Market, By Strength 7.1. Introduction 7.1.1. 350 mg 7.1.2. 500 mg CHAPTER 8 Daptomycin Market, By Age Group 8.1. Introduction 8.1.1. Adult 8.1.2. Pediatric CHAPTER 9. Daptomycin Market, By Indication 9.1. Introduction 9.1.1. Complicated Skin Structure infections 9.1.2 Bacteremia 9.1.3 Others CHAPTER 10. Daptomycin Market, By Region 10.1. Introduction 10.2. NORTH AMERICA 10.2.1. North America: Market Size and Forecast, By Country, 2023 – 2033 ($ Million) 10.2.2. North America: Market Size and Forecast, By Strength, 2023 – 2033 ($ Million) 10.2.3. North America: Market Size and Forecast, By Age Group, 2023 – 2033 ($ Million) 10.2.4. North America: Market Size and Forecast, By Indication, 2023 – 2033 ($ Million) 10.2.5. US 10.2.5.1. US: Market Size and Forecast, By Strength, 2023 – 2033 ($ Million) 10.2.5.2. US: Market Size and Forecast, By Age Group, 2023 – 2033 ($ Million) 10.2.5.3. US: Market Size and Forecast, By Indication, 2023 – 2033 ($ Million) 10.2.6. CANADA 10.2.6.1. Canada: Market Size and Forecast, By Strength, 2023 – 2033 ($ Million) 10.2.6.2. Canada: Market Size and Forecast, By Age Group, 2023 – 2033 ($ Million) 10.2.6.3. Canada: Market Size and Forecast, By Indication, 2023 – 2033 ($ Million) 10.2.7. MEXICO 10.2.7.1. Mexico: Market Size and Forecast, By Strength, 2023 – 2033 ($ Million) 10.2.7.2. Mexico: Market Size and Forecast, By Age Group, 2023 – 2033 ($ Million) 10.2.7.3. Mexico: Market Size and Forecast, By Indication, 2023 – 2033 ($ Million) 10.3. Europe 10.3.1. Europe: Market Size and Forecast, By Country, 2023 – 2033 ($ Million) 10.3.2. Europe: Market Size and Forecast, By Strength, 2023 – 2033 ($ Million) 10.3.3. Europe: Market Size and Forecast, By Age Group, 2023 – 2033 ($ Million) 10.3.4. Europe: Market Size and Forecast, By Indication, 2023 – 2033 ($ Million) 10.3.5. U.K. 10.3.5.1. U.K.: Market Size and Forecast, By Strength, 2023 – 2033 ($ Million) 10.3.5.2. U.K.: Market Size and Forecast, By Age Group, 2023 – 2033 ($ Million) 10.3.5.3. U.K.: Market Size and Forecast, By Indication, 2023 – 2033 ($ Million) 10.3.6. GERMANY 10.3.6.1. Germany: Market Size and Forecast, By Strength, 2023 – 2033 ($ Million) 10.3.6.2. Germany: Market Size and Forecast, By Age Group, 2023 – 2033 ($ Million) 10.3.6.3. Germany: Market Size and Forecast, By Indication, 2023 – 2033 ($ Million) 10.3.7. FRANCE 10.3.7.1. France: Market Size and Forecast, By Strength, 2023 – 2033 ($ Million) 10.3.7.2. France: Market Size and Forecast, By Age Group, 2023 – 2033 ($ Million) 10.3.7.3. France: Market Size and Forecast, By Indication, 2023 – 2033 ($ Million) 10.3.8. ITALY 10.3.8.1. Italy: Market Size and Forecast, By Strength, 2023 – 2033 ($ Million) 10.3.8.2. Italy: Market Size and Forecast, By Age Group, 2023 – 2033 ($ Million) 10.3.8.3. Italy: Market Size and Forecast, By Indication, 2023 – 2033 ($ Million) 10.3.9. SPAIN 10.3.9.1. Spain: Market Size and Forecast, By Strength, 2023 – 2033 ($ Million) 10.3.9.2. Spain: Market Size and Forecast, By Age Group, 2023 – 2033 ($ Million) 10.3.9.3. Spain: Market Size and Forecast, By Indication, 2023 – 2033 ($ Million) 10.3.10. BENELUX 10.3.10.1. BeNeLux: Market Size and Forecast, By Strength, 2023 – 2033 ($ Million) 10.3.10.2. BeNeLux: Market Size and Forecast, By Age Group, 2023 – 2033 ($ Million) 10.3.10.3. BeNeLux: Market Size and Forecast, By Indication, 2023 – 2033 ($ Million) 10.3.11. RUSSIA 10.3.11.1. Russia: Market Size and Forecast, By Strength, 2023 – 2033 ($ Million) 10.3.11.2. Russia: Market Size and Forecast, By Age Group, 2023 – 2033 ($ Million) 10.3.11.3. Russia: Market Size and Forecast, By Indication, 2023 – 2033 ($ Million) 10.3.12. REST OF EUROPE 10.3.12.1. Rest of Europe: Market Size and Forecast, By Strength, 2023 – 2033 ($ Million) 10.3.12.2. Rest of Europe: Market Size and Forecast, By Age Group, 2023 – 2033 ($ Million) 10.3.12.3. Rest of Europe: Market Size and Forecast, By Indication, 2023 – 2033 ($ Million) 10.4. Asia Pacific 10.4.1. Asia Pacific: Market Size and Forecast, By Country, 2023 – 2033 ($ Million) 10.4.2. Asia Pacific: Market Size and Forecast, By Strength, 2023 – 2033 ($ Million) 10.4.3. Asia Pacific: Market Size and Forecast, By Age Group, 2023 – 2033 ($ Million) 10.4.4. Asia Pacific: Market Size and Forecast, By Indication, 2023 – 2033 ($ Million) 10.4.5. CHINA 10.4.5.1. China: Market Size and Forecast, By Strength, 2023 – 2033 ($ Million) 10.4.5.2. China: Market Size and Forecast, By Age Group, 2023 – 2033 ($ Million) 10.4.5.3. China: Market Size and Forecast, By Indication, 2023 – 2033 ($ Million) 10.4.6. JAPAN 10.4.6.1. Japan: Market Size and Forecast, By Strength, 2023 – 2033 ($ Million) 10.4.6.2. Japan: Market Size and Forecast, By Age Group, 2023 – 2033 ($ Million) 10.4.6.3. Japan: Market Size and Forecast, By Indication, 2023 – 2033 ($ Million) 10.4.7. INDIA 10.4.7.1. India: Market Size and Forecast, By Strength, 2023 – 2033 ($ Million) 10.4.7.2. India: Market Size and Forecast, By Age Group, 2023 – 2033 ($ Million) 10.4.7.3. India: Market Size and Forecast, By Indication, 2023 – 2033 ($ Million) 10.4.8. SOUTH KOREA 10.4.8.1. South Korea: Market Size and Forecast, By Strength, 2023 – 2033 ($ Million) 10.4.8.2. South Korea: Market Size and Forecast, By Age Group, 2023 – 2033 ($ Million) 10.4.8.3. South Korea: Market Size and Forecast, By Indication, 2023 – 2033 ($ Million) 10.4.9. THAILAND 10.4.9.1. Thailand: Market Size and Forecast, By Strength, 2023 – 2033 ($ Million) 10.4.9.2. Thailand: Market Size and Forecast, By Age Group, 2023 – 2033 ($ Million) 10.4.9.3. Thailand: Market Size and Forecast, By Indication, 2023 – 2033 ($ Million) 10.4.10. INDONESIA 10.4.10.1. Indonesia: Market Size and Forecast, By Strength, 2023 – 2033 ($ Million) 10.4.10.2. Indonesia: Market Size and Forecast, By Age Group, 2023 – 2033 ($ Million) 10.4.10.3. Indonesia: Market Size and Forecast, By Indication, 2023 – 2033 ($ Million) 10.4.11. MALAYSIA 10.4.11.1. Malaysia: Market Size and Forecast, By Strength, 2023 – 2033 ($ Million) 10.4.11.2. Malaysia: Market Size and Forecast, By Age Group, 2023 – 2033 ($ Million) 10.4.11.3. Malaysia: Market Size and Forecast, By Indication, 2023 – 2033 ($ Million) 10.4.12. AUSTRALIA 10.4.12.1. Australia: Market Size and Forecast, By Strength, 2023 – 2033 ($ Million) 10.4.12.2. Australia: Market Size and Forecast, By Age Group, 2023 – 2033 ($ Million) 10.4.12.3. Australia: Market Size and Forecast, By Indication, 2023 – 2033 ($ Million) 10.4.13. REST FO ASIA PACIFIC 10.4.13.1. Rest fo Asia Pacific: Market Size and Forecast, By Strength, 2023 – 2033 ($ Million) 10.4.13.2. Rest fo Asia Pacific: Market Size and Forecast, By Age Group, 2023 – 2033 ($ Million) 10.4.13.3. Rest fo Asia Pacific: Market Size and Forecast, By Indication, 2023 – 2033 ($ Million) 10.5. South America 10.5.1. South America: Market Size and Forecast, By Country, 2023 – 2033 ($ Million) 10.5.2. South America: Market Size and Forecast, By Strength, 2023 – 2033 ($ Million) 10.5.3. South America: Market Size and Forecast, By Age Group, 2023 – 2033 ($ Million) 10.5.4. South America: Market Size and Forecast, By Indication, 2023 – 2033 ($ Million) 10.5.5. BRAZIL 10.5.5.1. Brazil: Market Size and Forecast, By Strength, 2023 – 2033 ($ Million) 10.5.5.2. Brazil: Market Size and Forecast, By Age Group, 2023 – 2033 ($ Million) 10.5.5.3. Brazil: Market Size and Forecast, By Indication, 2023 – 2033 ($ Million) 10.5.6. ARGENTINA 10.5.6.1. Argentina: Market Size and Forecast, By Strength, 2023 – 2033 ($ Million) 10.5.6.2. Argentina: Market Size and Forecast, By Age Group, 2023 – 2033 ($ Million) 10.5.6.3. Argentina: Market Size and Forecast, By Indication, 2023 – 2033 ($ Million) 10.5.7. REST OF SOUTH AMERICA 10.5.7.1. Rest of South America: Market Size and Forecast, By Strength, 2023 – 2033 ($ Million) 10.5.7.2. Rest of South America: Market Size and Forecast, By Age Group, 2023 – 2033 ($ Million) 10.5.7.3. Rest of South America: Market Size and Forecast, By Indication, 2023 – 2033 ($ Million) 10.6. Middle East & Africa 10.6.1. Middle East & Africa: Market Size and Forecast, By Country, 2023 – 2033 ($ Million) 10.6.2. Middle East & Africa: Market Size and Forecast, By Strength, 2023 – 2033 ($ Million) 10.6.3. Middle East & Africa: Market Size and Forecast, By Age Group, 2023 – 2033 ($ Million) 10.6.4. Middle East & Africa: Market Size and Forecast, By Indication, 2023 – 2033 ($ Million) 10.6.5. SAUDI ARABIA 10.6.5.1. Saudi Arabia: Market Size and Forecast, By Strength, 2023 – 2033 ($ Million) 10.6.5.2. Saudi Arabia: Market Size and Forecast, By Age Group, 2023 – 2033 ($ Million) 10.6.5.3. Saudi Arabia: Market Size and Forecast, By Indication, 2023 – 2033 ($ Million) 10.6.6. UAE 10.6.6.1. UAE: Market Size and Forecast, By Strength, 2023 – 2033 ($ Million) 10.6.6.2. UAE: Market Size and Forecast, By Age Group, 2023 – 2033 ($ Million) 10.6.6.3. UAE: Market Size and Forecast, By Indication, 2023 – 2033 ($ Million) 10.6.7. EGYPT 10.6.7.1. Egypt: Market Size and Forecast, By Strength, 2023 – 2033 ($ Million) 10.6.7.2. Egypt: Market Size and Forecast, By Age Group, 2023 – 2033 ($ Million) 10.6.7.3. Egypt: Market Size and Forecast, By Indication, 2023 – 2033 ($ Million) 10.6.8. SOUTH AFRICA 10.6.8.1. South Africa: Market Size and Forecast, By Strength, 2023 – 2033 ($ Million) 10.6.8.2. South Africa: Market Size and Forecast, By Age Group, 2023 – 2033 ($ Million) 10.6.8.3. South Africa: Market Size and Forecast, By Indication, 2023 – 2033 ($ Million) 10.6.9. REST OF MIDDLE EAST & AFRICA 10.6.9.1. Rest of Middle East & Africa: Market Size and Forecast, By Strength, 2023 – 2033 ($ Million) 10.6.9.2. Rest of Middle East & Africa: Market Size and Forecast, By Age Group, 2023 – 2033 ($ Million) 10.6.9.3. Rest of Middle East & Africa: Market Size and Forecast, By Indication, 2023 – 2033 ($ Million) CHAPTER 12. Competitive Landscape 12.1. Competitior Benchmarking 2023 12.2. Market Share Analysis 12.3. Key Developments Analysis By Top 5 Companies 12.4. Market Share Acquisition Strategies: Analysis of Key Approaches Employed by Top Players CHAPTER 13. Company Profiles 13.1. Teva Pharmaceutical Industries Ltd. 13.1.1. Hanon Systems 13.1.2. Financial Analysis 13.1.2.1. Business Segment Revenue, 2020, 2021, 2022, $ Million 13.1.2.2. Geographic Revenue Mix, 2022 (% Share) 13.1.3. Product Portfolio 13.1.4. Recent Development and Strategies Adopted 13.1.5. SWOT Analysis 13.2. Merck &co. 13.3. Cipla 13.4. Pfizer 13.5. BE Pharmaceuticals 13.6. Reddy’s Laboratories 13.7. Mylan 13.8. Fresenius Kabi 13.9 Nichi-Iko Pharmaceutical 13.10 Civica Rx