Price range: € 1,230.43 through € 4,886.30
Continuous Delivery Market Research Report: By Organization Size (Large enterprises, Small and Medium-sized Enterprises (SMEs), By Deployment Mode (On-premises, Cloud), By Vertical (Telecommunications, BFSI, Media and entertainment, Retail and eCommerce, Healthcare, Others), and by Region — Forecast till 2033
Page: 115
Description
Continuous Delivery Market Overview
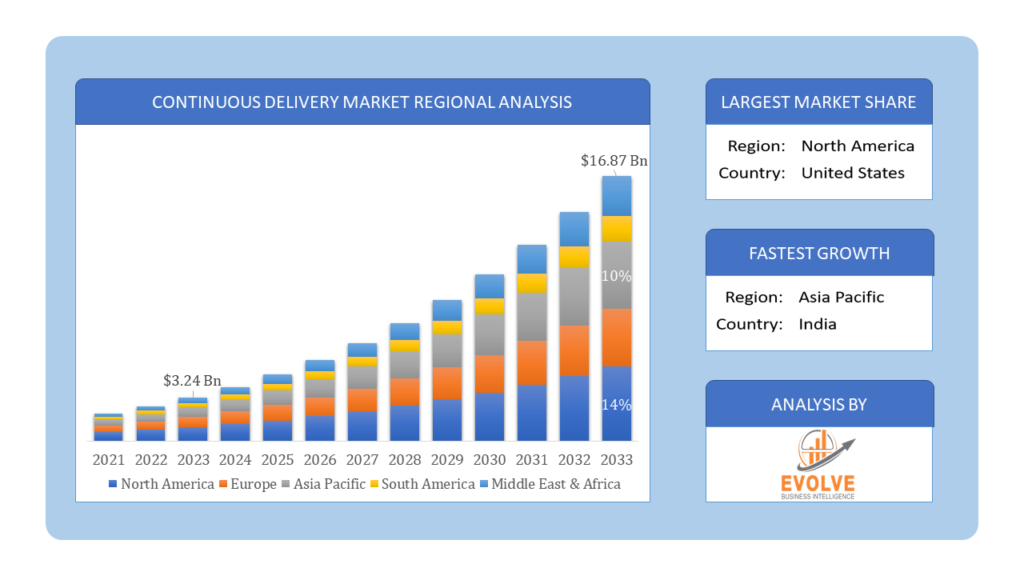
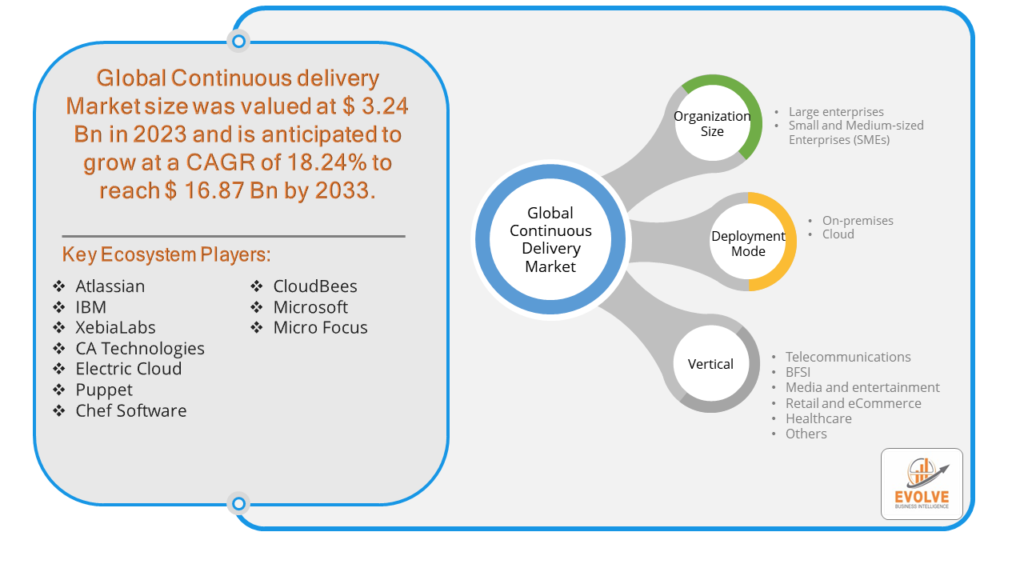
The Continuous Delivery Market Size is expected to reach USD 16.87 Billion by 2033. The Continuous Delivery industry size accounted for USD 3.24 Billion in 2023 and is expected to expand at a CAGR of 18.24% from 2023 to 2033. Continuous Delivery (CD) is a software engineering approach where code changes are automatically built, tested, and prepared for release to production in a streamlined and automated manner. It aims to enable frequent and reliable software releases by automating the software delivery process from code integration to deployment. Continuous Delivery emphasizes the use of automation, rigorous testing, and collaboration between development, testing, and operations teams to ensure that software changes can be deployed to production environments swiftly and with minimal manual intervention. This approach enables organizations to deliver new features, updates, and bug fixes to end-users efficiently and with high quality.
Global Continuous Delivery Market Synopsis
The Continuous Delivery market underwent a moderate impact amid the COVID-19 pandemic as organizations adapted to remote work arrangements and sought to maintain software development productivity and efficiency. While the transition to remote work initially posed challenges in terms of collaboration and communication, it also underscored the importance of automation and DevOps practices, driving increased adoption of Continuous Delivery solutions. The pandemic prompted a renewed focus on digital transformation initiatives, accelerating the adoption of agile development methodologies and cloud-based Continuous Delivery tools. However, supply chain disruptions and economic uncertainties led to cautious spending on IT investments, particularly among smaller organizations, which somewhat tempered market growth. Overall, the resilience of the software industry and the imperative for businesses to maintain operational continuity fueled continued demand for Continuous Delivery solutions amidst the pandemic’s evolving landscape.
Global Continuous Delivery Market Dynamics
The major factors that have impacted the growth of Continuous Delivery are as follows:
Drivers:
⮚ Increased demand for faster software delivery
The need for organizations to release software updates and features more rapidly to stay competitive in the market is a significant driver for Continuous Delivery adoption. This demand is fueled by customer expectations for frequent updates and improvements, as well as the need to respond quickly to market changes and emerging trends.
Restraint:
- Organizational resistance to change
Resistance to change within organizations can pose a significant restraint to the adoption of Continuous Delivery practices. Cultural barriers, fear of job loss, and reluctance to embrace new technologies and methodologies can hinder the implementation of Continuous Delivery pipelines. Overcoming these barriers requires strong leadership support, effective communication, and a gradual approach to change management.
Opportunity:
⮚ Increasing focus on DevOps and automation
The growing emphasis on DevOps practices and automation presents a significant opportunity for the Continuous Delivery market. Organizations are increasingly recognizing the benefits of integrating development and operations teams, as well as automating manual processes throughout the software delivery pipeline. This trend creates opportunities for Continuous Delivery vendors to provide tools and solutions that streamline and optimize software development and delivery processes.
Continuous Delivery Market Segment Overview
By Organization Size
 Based on the Organization Size, the market is segmented based on Large enterprises, Small and Medium-sized Enterprises (SMEs). The Large enterprises segment was anticipated to lead the Continuous Delivery market due to its substantial resources, advanced technological capabilities, and greater propensity for implementing comprehensive Continuous Delivery pipelines. These enterprises prioritize efficiency, agility, and innovation, driving the adoption of Continuous Delivery practices to accelerate software delivery cycles and maintain a competitive edge in rapidly evolving markets.
By Deployment Mode
Based on the Deployment Mode, the market has been divided into On-premises and Cloud. The On-premises segment is expected to dominate the Continuous Delivery market, primarily driven by the stringent data security and compliance requirements of enterprises, particularly in regulated industries such as finance and healthcare. Additionally, some organizations opt for on-premise solutions to retain greater control over their infrastructure and sensitive data, leveraging Continuous Delivery tools to enhance software delivery efficiency while maintaining data sovereignty and privacy.
By Vertical
Based on Vertical, the market has been divided into Telecommunications, BFSI, Media and Entertainment, Retail and eCommerce, Healthcare, and Others. The Telecommunications segment is positioned to capture the largest market share in the Continuous Delivery market due to its increasing reliance on software-driven infrastructure and services, necessitating rapid and continuous software updates to maintain network performance and meet evolving customer demands. Additionally, Continuous Delivery enables telecommunications companies to streamline deployment processes, enhance agility, and accelerate time-to-market for new products and services, driving its adoption as a strategic imperative within the industry.
Global Continuous Delivery Market Regional Analysis
Based on region, the market has been divided into North America, Europe, Asia-Pacific, the Middle East & Africa, and Latin America. The area of North America is anticipated to dominate the market for the usage of Continuous Delivery, followed by those in Asia-Pacific and Europe.
 Continuous Delivery North America Market
North America asserts dominance in the Continuous Delivery market due to its advanced technological infrastructure, strong adoption of DevOps practices, and a mature software development ecosystem. The region is home to numerous tech giants and innovative startups driving Continuous Delivery advancements, while also benefiting from a supportive regulatory environment and significant investment in research and development. Additionally, a robust network of enterprises across various industries underscores North America’s leadership in shaping the evolution of Continuous Delivery methodologies and solutions.
Continuous Delivery Asia Pacific Market
The Asia-Pacific region has witnessed remarkable growth in the Continuous Delivery market, fueled by increasing digital transformation initiatives, rapid technological advancements, and a burgeoning startup ecosystem. Organizations in the region are embracing Continuous Delivery practices to accelerate software delivery, enhance agility, and stay competitive in the global market landscape. Additionally, the growing adoption of cloud computing and DevOps methodologies further propels the expansion of Continuous Delivery solutions across diverse industries in the Asia-Pacific region.
Competitive Landscape
The competitive landscape includes key players (tier 1, tier 2, and local) having a presence across the globe. Companies such as Atlassian, IBM, XebiaLabs, CA Technologies, Electric Cloud are some of the leading players in the global Continuous Delivery Industry. These players have adopted partnership, acquisition, expansion, and new product development, among others as their key strategies.
Key Market Players:
- Atlassian
- IBM
- XebiaLabs
- CA Technologies
- Electric Cloud
- Puppet
- Chef Software
- CloudBees
- Microsoft
- Micro Focus
Key Development:
In October 2022, Intel Corp. and Alphabet Inc.’s Google Cloud introduced a jointly developed chip aimed at enhancing security and efficiency in data centers. Google maintains its trajectory of crafting tailored chips for optimizing data center functionalities. Analysts observe that this trend toward customized chip design is fostering the accelerated adoption of bare-metal computing.
Scope of the Report
Global Continuous Delivery Market, by Organization Size
- Large enterprises
- Small and Medium-sized Enterprises (SMEs)
Global Continuous Delivery Market, by Deployment Mode
- On-premises
- Cloud
Global Continuous Delivery Market, by Vertical
- Telecommunications
- BFSI
- Media and entertainment
- Retail and eCommerce
- Healthcare
- Others
Global Continuous Delivery Market, by Region
- North America
- US
- Canada
- Mexico
- Europe
- UK
- Germany
- France
- Italy
- Spain
- Benelux
- Nordic
- Rest of Europe
- Asia Pacific
- China
- Japan
- South Korea
- Indonesia
- Austalia
- Malaysia
- India
- Rest of Asia Pacific
- South America
- Brazil
- Argentina
- Rest of South America
- Middle East & Africa
- Saudi Arabia
- UAE
- Egypt
- South Africa
- Rest of Middle East & Africa
| Parameters | Indicators |
|---|---|
| Market Size | 2033: $16.87 Billion |
| CAGR | 18.24% CAGR (2023-2033) |
| Base year | 2022 |
| Forecast Period | 2023-2033 |
| Historical Data | 2021 |
| Report Coverage | Revenue Forecast, Competitive Landscape, Growth Factors, and Trends |
| Key Segmentations | Organization Size, Deployment Mode, Vertical |
| Geographies Covered | North America, Europe, Asia-Pacific, Latin America, Middle East, Africa |
| Key Vendors | Atlassian, IBM, XebiaLabs, CA Technologies, Electric Cloud, Puppet, Chef Software, CloudBees, Microsoft, Micro Focus |
| Key Market Opportunities | • Growing demand for cloud-based Continuous Delivery tools and solutions • Emphasis on automation and efficiency in software development processes |
| Key Market Drivers | • Accelerated digital transformation initiatives due to the COVID-19 pandemic • Increased adoption of agile development methodologies and DevOps practices |
REPORT CONTENT BRIEF:
- High-level analysis of the current and future Continuous Delivery Industry trends and opportunities
- Detailed analysis of current market drivers, restraining factors, and opportunities analysis in the future
- Historical market size for the year 2021, and forecast from 2023 to 2033
- Continuous Delivery market share analysis for each segment
- Competitor analysis with a comprehensive insight into its product segment, financial strength, and strategies adopted.
- Identifies key strategies adopted by the key players including new product development, mergers and acquisitions, joint ventures, collaborations, and partnerships.
- To identify and understand the various factors involved in the global Continuous Delivery market affected by the pandemic
- To provide year-on-year growth from 2022 to 2033
- To provide short-term, long-term, and overall CAGR comparison from 2022 to 2033.
- Provide Total Addressable Market (TAM) for the Global Continuous Delivery Market.
Frequently Asked Questions (FAQ)
What is the growth rate of the Continuous Delivery market?
The Continuous Delivery market is anticipated to expand at a robust compound annual growth rate (CAGR) of 18.24% from 2023 to 2033.
Which region has the highest growth rate in the Continuous Delivery market?
The Asia-Pacific region is poised to experience the highest growth rate in the Continuous Delivery market, driven by increasing digital transformation initiatives and rapid technological advancements.
Which region has the largest share of the Continuous Delivery market?
North America currently holds the largest share of the Continuous Delivery market, attributed to its advanced technological infrastructure and strong adoption of DevOps practices.
Who are the key players in the Continuous Delivery market?
Key players in the Continuous Delivery market include Atlassian, IBM, XebiaLabs, CA Technologies, Electric Cloud, Puppet, Chef Software, CloudBees, Microsoft, and Micro Focus, among others.
Do you offer Post Sale Support?
Yes, we offer 16 hours of analyst support to solve the queries
Do you sell particular sections of a report?
Yes, we provide regional as well as country-level reports. Other than this we also provide a sectional report. Please get in contact with our sales representatives.
Additional information
| Packages | Single User License, Enterprise License, Data Pack Excel |
|---|
Table of Content
[html_block id="7710"]


