Busbar Market Analysis and Global Forecast 2024-2034
$ 1,390.00 – $ 5,520.00Price range: $ 1,390.00 through $ 5,520.00
Busbar Market Research Report: Information By Material Type (Aluminium, Copper, and Brass), By Application (Industrial, Commercial, Residential, and Others), and by Region — Forecast till 2034
Page: 149
Busbar Market Overview
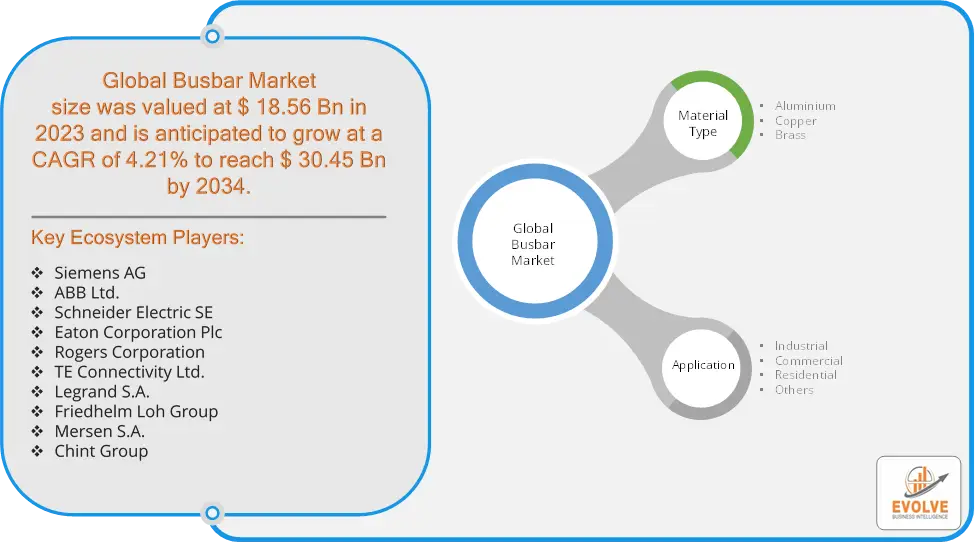
The Busbar Market size accounted for USD 18.56 Billion in 2023 and is estimated to account for 20.33 Billion in 2024. The Market is expected to reach USD 30.45 Billion by 2034 growing at a compound annual growth rate (CAGR) of 4.21% from 2024 to 2034. The Busbar Market refers to the industry involved in the production, distribution, and application of busbars, which are metallic strips or bars used for conducting electricity within electrical distribution systems. Busbars are critical components in power generation, transmission, and distribution networks, as well as in industrial and commercial electrical setups. They provide a flexible and efficient way to distribute electrical power across multiple circuits while reducing the amount of wiring needed.
The busbar market is expected to grow steadily due to increasing urbanization, industrialization, and the growing demand for renewable energy. Busbars are essential components in electrical systems, as they provide the foundation for efficient power distribution.
Global Busbar Market Synopsis
 Busbar Market Dynamics
The major factors that have impacted the growth of Busbar Market are as follows:
Drivers:
Ø Increasing Adoption of Electric Vehicles (EVs)
The growing electric vehicle market demands advanced electrical distribution systems in both manufacturing facilities and EV charging infrastructure, pushing the demand for busbars. The shift towards smart grids for better energy management, automation, and monitoring is driving the need for robust, flexible, and efficient busbar systems that can integrate seamlessly with new grid technologies. The trend towards automation and Industry 4.0 is boosting the need for reliable and high-capacity power distribution in industrial settings, contributing to the growth of the busbar market.
Restraint:
- Perception of High Initial Costs and Fluctuating Raw Material Prices
The upfront costs of installing busbar systems can be higher compared to traditional cabling, particularly for large-scale installations, which may deter smaller businesses or projects with limited budgets. The busbar market heavily depends on metals like copper and aluminum, which are subject to price volatility due to market fluctuations. This can increase manufacturing costs and create uncertainty for both producers and consumers.
Opportunity:
⮚ Growing Data Center Market
The rapid expansion of data centers globally, driven by increased cloud computing and digital services, creates a growing demand for busbars. These facilities require reliable, high-capacity power distribution systems to support their operations, positioning busbars as an ideal solution. The advancement of Industry 4.0 and industrial automation offers significant opportunities for busbar adoption. Automated manufacturing facilities require efficient power distribution, and busbars provide a flexible and reliable solution to meet the growing power demands in these settings.
Busbar Market Segment Overview
By Material Type
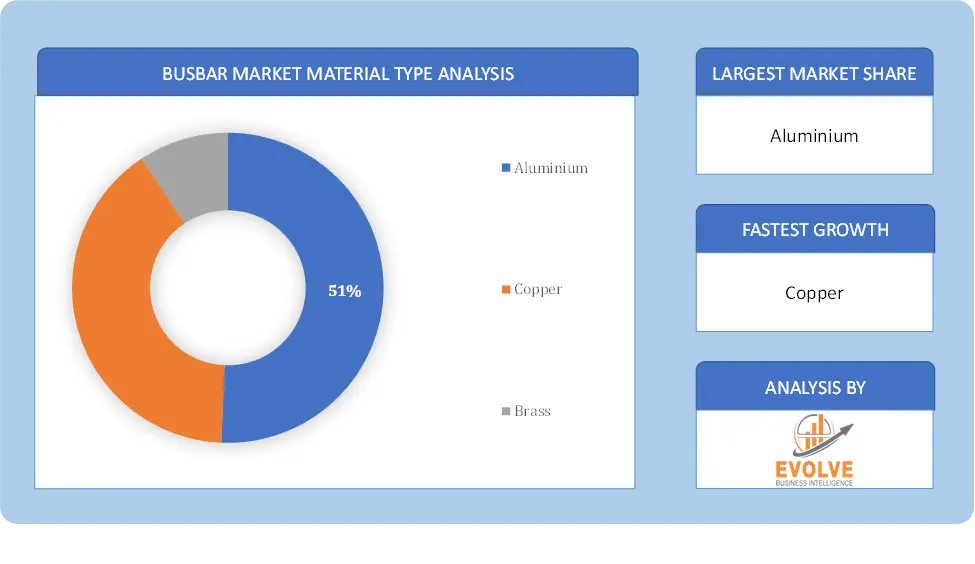
 Based on Material Type, the market is segmented based on Aluminium, Copper, and Brass. The Copper dominant the busbar system market. Both low-current and high-current applications can use copper busbars. Copper is a durable material that can withstand high temperatures, making it suitable for use in high-temperature applications such as transformers and switchgear. Copper is cheaper than other materials with similar electrical conductivity, making it a cost-effective solution for electrical applications.
By Application
Based on Application, the market segment has been divided into Industrial, Commercial, Residential and Others. The commercial segment dominant the market. The commercial sectors are implementing busbars, including buildings, corporate offices, department stores, retail malls, offices, and banking. The increasing demand for electrical energy in commercial buildings, such as office buildings, shopping centers, and hotels, drives the market for busbars and essential electrical system components. The growing construction industry, particularly in the commercial sector, is driving the demand for busbars, an essential part of electrical systems in commercial buildings.
Global Busbar Market Regional Analysis
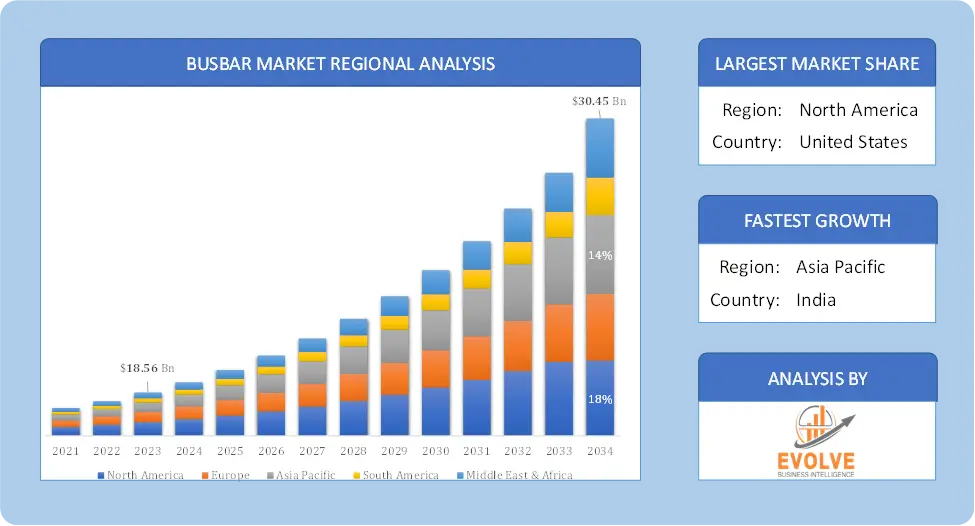
Based on region, the global Busbar Market has been divided into North America, Europe, Asia-Pacific, the Middle East & Africa, and Latin America. North America is projected to dominate the use of the Busbar Market followed by the Asia-Pacific and Europe regions.
 Busbar North America Market
North America holds a dominant position in the Busbar Market. The North American market is relatively mature, with steady growth driven by replacement demand and upgrades in existing electrical systems and there is a growing focus on energy-efficient busbar solutions, especially in the context of smart grid initiatives. High investment in infrastructure development, growth of renewable energy projects, and increasing adoption of electric vehicles and expansion of smart grid technologies and energy management systems. The presence of established manufacturing industries also creates demand for efficient power distribution systems.
Busbar Asia-Pacific Market
The Asia-Pacific region has indeed emerged as the fastest-growing market for the Busbar Market industry. This region is the largest consumer of busbars, driven by rapid industrialization and urbanization in countries like China, India, and Japan and the market is expected to continue growing at a significant pace due to increased infrastructure development and the growing demand for renewable energy and limited skilled workforce for installation and maintenance, and regional economic fluctuations affecting investment.
Competitive Landscape
The global Busbar Market is highly competitive, with numerous players offering a wide range of software solutions. The competitive landscape is characterized by the presence of established companies, as well as emerging startups and niche players. To increase their market position and attract a wide consumer base, the businesses are employing various strategies, such as product launches, and strategic alliances.
Prominent Players:
- Siemens AG
- ABB Ltd.
- Schneider Electric SE
- Eaton Corporation Plc
- Rogers Corporation
- TE Connectivity Ltd.
- Legrand S.A.
- Friedhelm Loh Group
- Mersen S.A.
- Chint Group
Key Development
In January 2023, Eaton, a leader in intelligent power management, announced a partnership with Rewiring America, the top U.S. organization in the field of electrification, to increase electrification knowledge, awareness, and action.
In November 2022, Siemens Limited established cutting-edge manufacturing in Aurangabad to meet the rising demand in India and worldwide. To fulfill an export order, the manufacturer will send over 200 bogies. Bogies are built using the tried-and-true “SF30 Combino Plus” global design concept from Siemens.
Scope of the Report
Global Busbar Market, by Material Type
- Aluminium
- Copper
- Brass
Global Busbar Market, by Application
- Industrial
- Commercial
- Residential
- Others
Global Busbar Market, by Region
- North America
- US
- Canada
- Mexico
- Europe
- UK
- Germany
- France
- Italy
- Spain
- Benelux
- Nordic
- Rest of Europe
- Asia Pacific
- China
- Japan
- South Korea
- Indonesia
- Austalia
- Malaysia
- India
- Rest of Asia Pacific
- South America
- Brazil
- Argentina
- Rest of South America
- Middle East & Africa
- Saudi Arabia
- UAE
- Egypt
- South Africa
- Rest of Middle East & Africa
| Parameters | Indicators |
|---|---|
| Market Size | 2033: $30.45 Billion |
| CAGR | 4.21% CAGR (2023-2033) |
| Base year | 2022 |
| Forecast Period | 2023-2033 |
| Historical Data | 2021 |
| Report Coverage | Revenue Forecast, Competitive Landscape, Growth Factors, and Trends |
| Key Segmentations | Material Type, Application |
| Geographies Covered | North America, Europe, Asia-Pacific, Latin America, Middle East, Africa |
| Key Vendors | Siemens AG, ABB Ltd., Schneider Electric SE, Eaton Corporation Plc, Rogers Corporation, TE Connectivity Ltd., Legrand S.A., Friedhelm Loh Group, Mersen S.A. and Chint Group. |
| Key Market Opportunities | • Growing Data Center Market • Increased Focus on Industrial Automation |
| Key Market Drivers | • Increasing Adoption of Electric Vehicles (EVs) • Growth of Smart Grid Technologies |
REPORT CONTENT BRIEF:
- High-level analysis of the current and future Busbar Market trends and opportunities
- Detailed analysis of current market drivers, restraining factors, and opportunities in the future
- Busbar Market historical market size for the year 2021, and forecast from 2023 to 2033
- Busbar Market share analysis at each product level
- Competitor analysis with detailed insight into its product segment, Government & Defense strength, and strategies adopted.
- Identifies key strategies adopted including product launches and developments, mergers and acquisitions, joint ventures, collaborations, and partnerships as well as funding taken and investment done, among others.
- To identify and understand the various factors involved in the global Busbar Market affected by the pandemic
- To provide a detailed insight into the major companies operating in the market. The profiling will include the Government & Defense health of the company’s past 2-3 years with segmental and regional revenue breakup, product offering, recent developments, SWOT analysis, and key strategies.
Press Release

Global Pharmaceutical Manufacturing Market to Reach $1.38 Trillion by 2035 with 7.35% CAGR, New Research Shows

The Global Mammography Market Is Estimated To Record a CAGR of Around 10.29% During The Forecast Period

Glue Stick Market to Reach USD 2.35 Billion by 2034

Podiatry Service Market to Reach USD 11.88 Billion by 2034

Microfluidics Technology Market to Reach USD 32.58 Billion by 2034

Ferric Chloride Market to Reach USD 10.65 Billion by 2034

Family Practice EMR Software Market to Reach USD 21.52 Billion by 2034

Electric Hairbrush Market to Reach USD 15.95 Billion by 2034

Daily Bamboo Products Market to Reach USD 143.52 Billion by 2034

Cross-border E-commerce Logistics Market to Reach USD 112.65 Billion by 2034
Frequently Asked Questions (FAQ)
What is the study period of this market?
The study period of the global Busbar Market is 2021- 2033
What is the growth rate of the global Busbar Market?
The global Busbar Market is growing at a CAGR of 4.21% over the next 10 years
Which region has the highest growth rate in the market of Busbar Market?
Asia Pacific is expected to register the highest CAGR during 2024-2034
Which region has the largest share of the global Busbar Market?
North America holds the largest share in 2022
Who are the key players in the global Busbar Market?
Siemens AG, ABB Ltd., Schneider Electric SE, Eaton Corporation Plc, Rogers Corporation, TE Connectivity Ltd., Legrand S.A., Friedhelm Loh Group, Mersen S.A. and Chint Group are the major companies operating in the market.
Do you offer Post Sale Support?
Yes, we offer 16 hours of analyst support to solve the queries
Do you sell particular sections of a report?
Yes, we provide regional as well as country-level reports. Other than this we also provide a sectional report. Please get in contact with our sales representatives
Table of Content
Chapter 1. Executive Summary Chapter 2. Scope of The Study 2.1. Market Definition 2.2. Scope of The Study 2.2.1. Objectives of Report Chapter 3. Evolve BI Methodology Chapter 4. Market Insights and Trends 4.1. Supply/ Value Chain Analysis 4.2. Porter’s Five Forces Analysis 4.2.1. Threat of New Entrants 4.2.2. Bargaining Power of Buyers 4.2.3. Bargaining Power of Suppliers 4.2.4. Threat of Substitutes 4.2.5. Industry Rivalry 4.3. Impact of COVID-19 on Busbar Market 4.3.1. Impact on Market Size 4.3.2. End User Trend, Preferences and Budget Impact 4.3.3. Regulatory Framework/Government Policies 4.3.4. Key Players Strategy to Tackle Negative Impact 4.3.5. Opportunity Window Chapter 5. Market Dynamics 5.1. Introduction 5.2. DRO Analysis 5.2.1. Drivers 5.2.2. Restraints 5.2.3. Opportunities Chapter 6. Global Busbar Market, By Material Type 6.1. Introduction 6.2. Aluminum 6.3. Copper 6.4. Brass Chapter 7. Global Busbar Market, By Application 7.1. Introduction 7.2. Industrial 7.3. Commercial 7.4. Residential 7.5. Others Chapter 8. Global Busbar Market, By Region 8.1. Introduction 8.2. North America 8.2.1. Introduction 8.2.2. Driving Factors, Opportunity Analyzed and Key Trends 8.2.3. Market Size and Forecast, By Country, 2020 - 2028 8.2.4. Market Size and Forecast, By Material Type, 2020 - 2028 8.2.5. Market Size and Forecast, By Application, 2020 – 2026 8.2.6. US 8.2.6.1. Introduction 8.2.6.2. Driving Factors, Opportunity Analyzed and Key Trends 8.2.6.3. Market Size and Forecast, By Material Type, 2020 - 2028 8.2.6.4. Market Size and Forecast, By Application, 2020 - 2028 8.2.7. Canada 8.2.7.1. Introduction 8.2.7.2. Driving Factors, Opportunity Analyzed and Key Trends 8.2.7.3. Market Size and Forecast, By Material Type, 2020 - 2028 8.2.7.4. Market Size and Forecast, By Application, 2020 - 2028 8.3. Europe 8.3.1. Introduction 8.3.2. Driving Factors, Opportunity Analyzed and Key Trends 8.3.3. Market Size and Forecast, By Country, 2020 - 2028 8.3.4. Market Size and Forecast, By Material Type, 2020 - 2028 8.3.5. Market Size and Forecast, By Application, 2020 – 2026 8.3.6. Germany 8.3.6.1. Introduction 8.3.6.2. Driving Factors, Opportunity Analyzed and Key Trends 8.3.6.3. Market Size and Forecast, By Material Type, 2020 - 2028 8.3.6.4. Market Size and Forecast, By Application, 2020 - 2028 8.3.7. France 8.3.7.1. Introduction 8.3.7.2. Driving Factors, Opportunity Analyzed and Key Trends 8.3.7.3. Market Size and Forecast, By Material Type, 2020 - 2028 8.3.7.4. Market Size and Forecast, By Application, 2020 - 2028 8.3.8. UK 8.3.8.1. Introduction 8.3.8.2. Driving Factors, Opportunity Analyzed and Key Trends 8.3.8.3. Market Size and Forecast, By Material Type, 2020 - 2028 8.3.8.4. Market Size and Forecast, By Application, 2020 - 2028 8.3.9. Italy 8.3.9.1. Introduction 8.3.9.2. Driving Factors, Opportunity Analyzed and Key Trends 8.3.9.3. Market Size and Forecast, By Material Type, 2020 - 2028 8.3.9.4. Market Size and Forecast, By Application, 2020 - 2028 8.3.10. Rest of Europe 8.3.10.1. Introduction 8.3.10.2. Driving Factors, Opportunity Analyzed and Key Trends 8.3.10.3. Market Size and Forecast, By Material Type, 2020 - 2028 8.3.10.4. Market Size and Forecast, By Application, 2020 - 2028 8.4. Asia-Pacific 8.4.1. Introduction 8.4.2. Driving Factors, Opportunity Analyzed and Key Trends 8.4.3. Market Size and Forecast, By Country, 2020 - 2028 8.4.4. Market Size and Forecast, By Material Type, 2020 - 2028 8.4.5. Market Size and Forecast, By Application, 2020 - 2028 8.4.6. China 8.4.6.1. Introduction 8.4.6.2. Driving Factors, Opportunity Analyzed and Key Trends 8.4.6.3. Market Size and Forecast, By Material Type, 2020 - 2028 8.4.6.4. Market Size and Forecast, By Application, 2020 - 2028 8.4.7. India 8.4.7.1. Introduction 8.4.7.2. Driving Factors, Opportunity Analyzed and Key Trends 8.4.7.3. Market Size and Forecast, By Material Type, 2020 - 2028 8.4.7.4. Market Size and Forecast, By Application, 2020 - 2028 8.4.8. Japan 8.4.8.1. Introduction 8.4.8.2. Driving Factors, Opportunity Analyzed and Key Trends 8.4.8.3. Market Size and Forecast, By Material Type, 2020 - 2028 8.4.8.4. Market Size and Forecast, By Application, 2020 - 2028 8.4.9. South Korea 8.4.9.1. Introduction 8.4.9.2. Driving Factors, Opportunity Analyzed and Key Trends 8.4.9.3. Market Size and Forecast, By Material Type, 2020 - 2028 8.4.9.4. Market Size and Forecast, By Application, 2020 - 2028 8.4.10. Rest of Asia-Pacific 8.4.10.1. Introduction 8.4.10.2. Driving Factors, Opportunity Analyzed and Key Trends 8.4.10.3. Market Size and Forecast, By Material Type, 2020 - 2028 8.4.10.4. Market Size and Forecast, By Application, 2020 - 2028 8.5. Rest of The World (RoW) 8.5.1. Introduction 8.5.2. Driving Factors, Opportunity Analyzed and Key Trends 8.5.3. Market Size and Forecast, By Material Type, 2020 - 2028 8.5.4. Market Size and Forecast, By Application, 2020 - 2028 8.5.5. Market Size and Forecast, By Region, 2020 - 2028 8.5.6. South America 8.5.6.1. Introduction 8.5.6.2. Driving Factors, Opportunity Analyzed and Key Trends 8.5.6.3. Market Size and Forecast, By Material Type, 2020 - 2028 8.5.6.4. Market Size and Forecast, By Application, 2020 - 2028 8.5.7. Middle East and Africa 8.5.7.1. Introduction 8.5.7.2. Driving Factors, Opportunity Analyzed and Key Trends 8.5.7.3. Market Size and Forecast, By Material Type, 2020 - 2028 8.5.7.4. Market Size and Forecast, By Application, 2020 - 2028 Chapter 9. Competitive Landscape 9.1. Introduction 9.2. Vendor Share Analysis, 2020/Key Players Positioning, 2020 Chapter 10. Company Profiles 10.1. Siemens AG 10.1.1. Business Overview 10.1.2. Financial Analysis 10.1.3. Material Type Portfolio 10.1.4. Recent Development and Strategies Adopted 10.1.5. SWOT Analysis 10.2. ABB Ltd. 10.2.1. Business Overview 10.2.2. Financial Analysis 10.2.3. Material Type Portfolio 10.2.4. Recent Development and Strategies Adopted 10.2.5. SWOT Analysis 10.3. Schneider Electric SE 10.3.1. Business Overview 10.3.2. Financial Analysis 10.3.3. Material Type Portfolio 10.3.4. Recent Development and Strategies Adopted 10.3.5. SWOT Analysis 10.4. Eaton Corporation Plc 10.4.1. Business Overview 10.4.2. Financial Analysis 10.4.3. Material Type Portfolio 10.4.4. Recent Development and Strategies Adopted 10.4.5. SWOT Analysis 10.5. Rogers Corporation 10.5.1. Business Overview 10.5.2. Financial Analysis 10.5.3. Material Type Portfolio 10.5.4. Recent Development and Strategies Adopted 10.5.5. SWOT Analysis 10.6. TE Connectivity Ltd. 10.6.1. Business Overview 10.6.2. Financial Analysis 10.6.3. Material Type Portfolio 10.6.4. Recent Development and Strategies Adopted 10.6.5. SWOT Analysis 10.7. Legrand S.A. 10.7.1. Business Overview 10.7.2. Financial Analysis 10.7.3. Material Type Portfolio 10.7.4. Recent Development and Strategies Adopted 10.7.5. SWOT Analysis 10.8. Friedhelm Loh Group 10.8.1. Business Overview 10.8.2. Financial Analysis 10.8.3. Material Type Portfolio 10.8.4. Recent Development and Strategies Adopted 10.8.5. SWOT Analysis 10.9. Mersen S.A. 10.9.1. Business Overview 10.9.2. Financial Analysis 10.9.3. Material Type Portfolio 10.9.4. Recent Development and Strategies Adopted 10.9.5. SWOT Analysis 10.10. Chint Group 10.10.1. Business Overview 10.10.2. Financial Analysis 10.10.3. Material Type Portfolio 10.10.4. Recent Development and Strategies Adopted 10.10.5. SWOT Analysis Chapter 11. Key Takeaways
Connect to Analyst
Research Methodology


