Autonomous Last Mile Delivery Market Analysis and Global Forecast 2023-2033

$ 1,390.00$ 5,520.00

Autonomous Last Mile Delivery Market Research Report: Information By Platform (Aerial Delivery Drones, Ground Delivery Vehicles), By solution (Hardware, Infrastructure, Software), By Application (Logistics & Transportation, Healthcare & Pharmacy, Retail & Food Delivery) By End Use (Fixed-wing, Rotary-wing, Hybrid), and by Region — Forecast till 2033

Page: 142

Report Published on: October 24, 2024
$ 3,470.00
$ 5,520.00
$ 1,390.00
Report Code: EBI55543 Categories: ,
Description

Autonomous Last Mile Delivery Market Overview

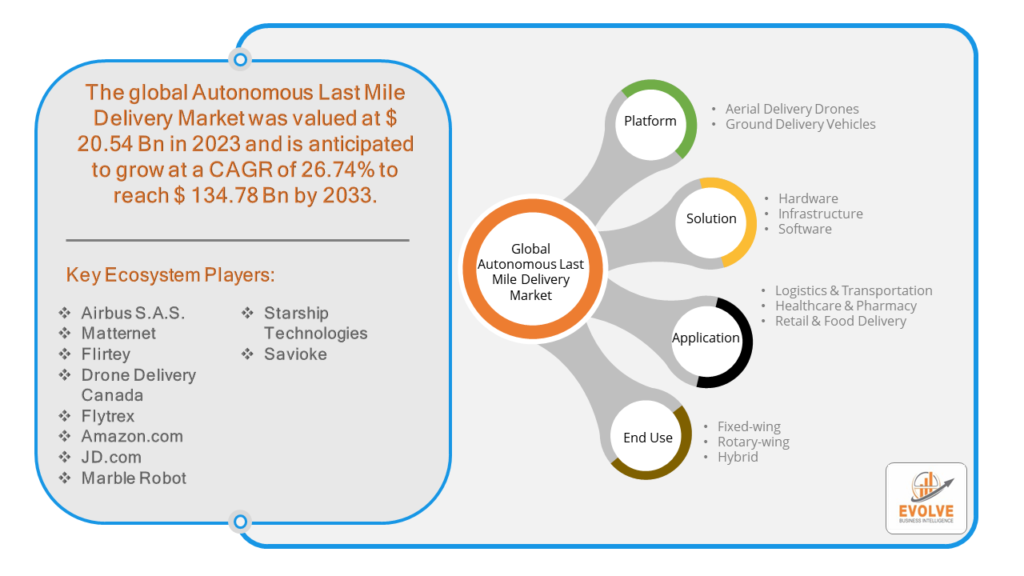
The Autonomous Last Mile Delivery Market Size is expected to reach USD 134.78 Billion by 2033. The Autonomous Last Mile Delivery Market industry size accounted for USD 20.54 Billion in 2023 and is expected to expand at a compound annual growth rate (CAGR) of 26.74% from 2023 to 2033. The Autonomous Last Mile Delivery Market refers to the industry focused on the development and deployment of autonomous vehicles and drones to deliver goods from a transportation hub (like a warehouse or distribution center) to the final delivery destination (such as a customer’s home or business). This market encompasses various technologies, services, and solutions aimed at automating the final segment of the delivery process, known as the “last mile.”

The autonomous last mile delivery market refers to the use of self-driving vehicles, like drones and ground robots, to deliver packages to customers without human intervention. This specifically focuses on the final leg of the delivery process, where goods are brought directly to a customer’s doorstep.

Global Autonomous Last Mile Delivery Market Synopsis

Autonomous Last Mile Delivery MarketCOVID-19 Impact Analysis

The COVID-19 pandemic had a significant impact on the Autonomous Last Mile Delivery Market. The need for social distancing and minimizing human contact has driven demand for autonomous delivery solutions. Consumers and businesses have shown a preference for contactless delivery to reduce the risk of virus transmission. The pandemic led to a surge in online shopping as people avoided physical stores. This increase in e-commerce activity has put pressure on delivery services to become more efficient, fueling interest and investment in autonomous last-mile delivery technologies. The pandemic spurred innovation in autonomous delivery technologies, with companies accelerating research and development efforts to bring solutions to market more quickly. Many companies fast-tracked pilot programs and initial deployments of autonomous delivery vehicles and drones during the pandemic. These real-world applications provided valuable data and experience, further advancing the technology. The economic impact of the pandemic created financial challenges for some companies, potentially slowing down investment and development in autonomous delivery technologies.

Autonomous Last Mile Delivery Market Dynamics

The major factors that have impacted the growth of Autonomous Last Mile Delivery Market are as follows:

Drivers:

Ø  Technological Advancements

Advances in AI and machine learning are enhancing the capabilities of autonomous delivery systems, enabling better navigation, obstacle avoidance, and decision-making processes. Improvements in LIDAR, cameras, and other sensor technologies have made autonomous vehicles more reliable and safer to operate in various environments. As urban areas become more densely populated, traditional delivery methods face challenges such as traffic congestion and limited parking. Autonomous delivery systems, especially drones and small delivery robots, can navigate these environments more efficiently. Autonomous delivery solutions can contribute to more sustainable urban mobility by reducing the number of delivery vehicles on the road, leading to lower emissions and less traffic congestion.

Restraint:

  • Perception of High Initial Investment and Operational Costs

Developing, testing, and deploying autonomous delivery systems require substantial investment in technology, infrastructure, and personnel. Ensuring the operational efficiency and safety of autonomous delivery vehicles entails ongoing maintenance, software updates, and repairs, which can be costly. Autonomous delivery systems must navigate complex urban environments, avoid obstacles, and interact safely with pedestrians and other vehicles. Current technology may not yet be fully reliable in all conditions. Limited battery life and range of electric-powered autonomous vehicles and drones can restrict their operational capacity and efficiency, especially in large or remote areas.

Opportunity:

⮚      Growing demand for Sustainability and Environmental Benefits

Autonomous delivery vehicles, especially electric ones, can help reduce greenhouse gas emissions and promote sustainable delivery practices. This aligns with global efforts to combat climate change and can be a key selling point for environmentally conscious consumers. Autonomous systems can optimize delivery routes to reduce fuel consumption and increase efficiency, contributing to lower environmental impact and cost savings. Integrating autonomous delivery with automated warehouse systems can streamline the entire supply chain, from inventory management to last-mile delivery, reducing delays and improving efficiency. Autonomous systems can operate continuously, reducing delivery times and enhancing overall supply chain responsiveness.

Autonomous Last Mile Delivery Market Segment Overview

By Platform
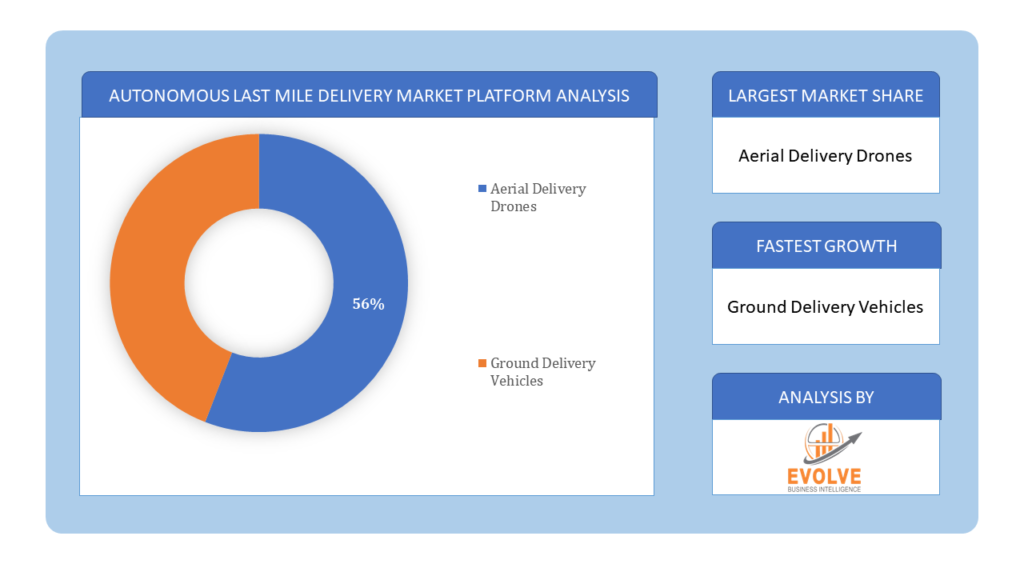
Autonomous Last Mile Delivery Market Platform analysisBased on Platform, the market is segmented based on Aerial Delivery Drones and Ground Delivery Vehicles. The Ground Delivery Vehicles segment dominant the market. Ground delivery bots, also known as sidewalk robots or ground drones, are compact and autonomous vehicles specifically designed to navigate sidewalks and pedestrian-friendly areas. These innovative machines directly transport goods to customers’ doorsteps. Increasingly popular in both urban and suburban environments, these delivery bots offer a solution for efficient and sustainable last mile deliveries.

By Solution

Based on Solution, the market segment has been divided into the Hardware, Infrastructure and Software. The Hardware segment dominant the market. A wide range of physical components and devices constitute the realm of autonomous systems. Key hardware components encompass LiDAR sensors, cameras, GPS modules, processors, batteries, and specialized delivery containers. Continuous advancements in hardware technology drive innovation in the market as companies invest heavily in developing lighter, energy-efficient, and durable solutions.

By Application

Based on Application, the market segment has been divided into the Logistics & Transportation, Healthcare & Pharmacy and Retail & Food Delivery. The Retail segment dominant the market. Retailers are increasingly using autonomous technologies to optimize their delivery operations. Self-driving vehicles, drones, and robots are among the innovative technologies that offer numerous advantages. These advancements bring faster and more reliable delivery times, cost reduction, and improved customer satisfaction.

By End Use

Based on End Use, the market segment has been divided into the Fixed-wing, Rotary-wing and Hybrid. The Hybrid segment dominant the market. The Hybrid segment in the Autonomous Last Mile Delivery Market is an emerging and innovative area, combining both autonomous and human-operated elements to optimize delivery efficiency and reliability. This segment leverages hybrid delivery vehicles and systems to improve the final leg of the delivery process, ensuring packages reach their destination efficiently and accurately.

Global Autonomous Last Mile Delivery Market Regional Analysis

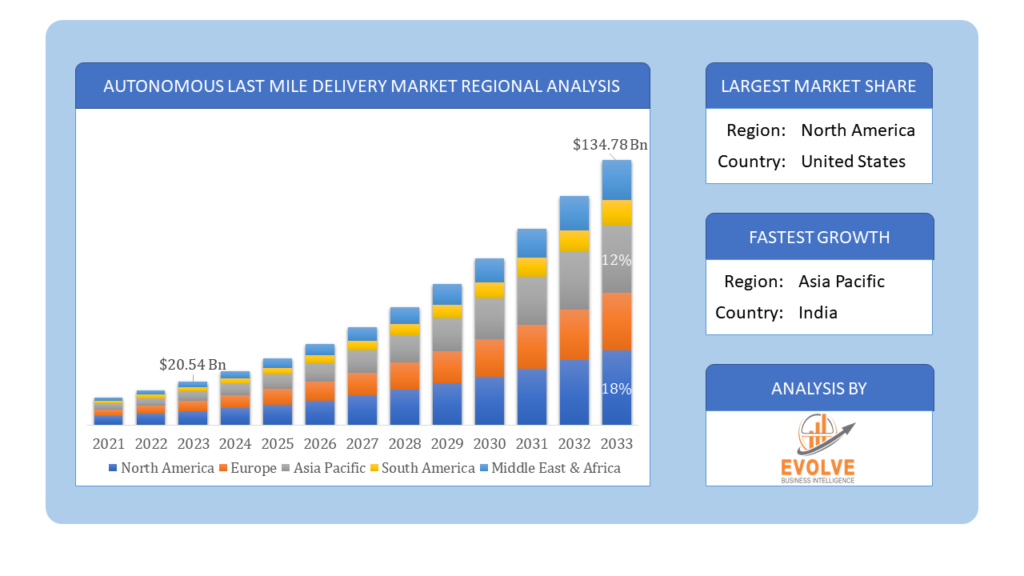
Based on region, the global Autonomous Last Mile Delivery Market has been divided into North America, Europe, Asia-Pacific, the Middle East & Africa, and Latin America. North America is projected to dominate the use of the Autonomous Last Mile Delivery Market followed by the Asia-Pacific and Europe regions.

Global Autonomous Last Mile Delivery Market Regional AnalysisAutonomous Last Mile Delivery North America Market

North America holds a dominant position in the Autonomous Last Mile Delivery Market. The U.S. is a leader in technological innovation, with significant advancements in autonomous delivery systems driven by major companies and startups. Progressive regulations and pilot programs in states like California, Arizona, and Texas support the testing and deployment of autonomous delivery vehicles. High e-commerce penetration and consumer demand for fast delivery drive the adoption of autonomous last-mile delivery solutions.

Autonomous Last Mile Delivery Asia-Pacific Market

The Asia-Pacific region has indeed emerged as the fastest-growing market for the Autonomous Last Mile Delivery Market industry. This region is experiencing significant growth due to a booming e-commerce sector and government initiatives to promote technological innovation. China is a leader in the adoption of autonomous delivery, driven by high e-commerce growth and significant investment in technology. The Chinese government supports autonomous delivery through favorable policies and infrastructure development.

Competitive Landscape

The global Autonomous Last Mile Delivery Market is highly competitive, with numerous players Offering a wide range of software solutions. The competitive landscape is characterized by the presence of established companies, as well as emerging startups and niche players. To increase their market position and attract a wide consumer base, the businesses are employing various strategies, such as product launches, and strategic alliances.

Prominent Players:

  • Airbus S.A.S.
  • Matternet
  • Flirtey
  • Drone Delivery Canada
  • Flytrex
  • Amazon.com
  • JD.com
  • Marble Robot
  • Starship Technologies
  • Savioke

Scope of the Report

Global Autonomous Last Mile Delivery Market, by Platform
  • Aerial Delivery Drones
  • Ground Delivery Vehicles
Global Autonomous Last Mile Delivery Market, by Solution
  • Hardware
  • Infrastructure
  • Software
Global Autonomous Last Mile Delivery Market, by Application
  • Logistics & Transportation
  • Healthcare & Pharmacy
  • Retail & Food Delivery
Global Autonomous Last Mile Delivery Market, by End Use
  • Fixed-wing
  • Rotary-wing
  • Hybrid
Global Autonomous Last Mile Delivery Market, by Region
  • North America
    • US
    • Canada
    • Mexico
  • Europe
    • UK
    • Germany
    • France
    • Italy
    • Spain
    • Benelux
    • Nordic
    • Rest of Europe
  • Asia Pacific
    • China
    • Japan
    • South Korea
    • Indonesia
    • Austalia
    • Malaysia
    • India
    • Rest of Asia Pacific
  • South America
    • Brazil
    • Argentina
    • Rest of South America
  • Middle East & Africa
    • Saudi Arabia
    • UAE
    • Egypt
    • South Africa
    • Rest of Middle East & Africa


Parameters Indicators
Market Size 2033: $134.78 Billion
CAGR 26.74% CAGR (2023-2033)
Base year 2022
Forecast Period 2023-2033
Historical Data 2021
Report Coverage Revenue Forecast, Competitive Landscape, Growth Factors, and Trends
Key Segmentations Platform, Solution, Application, End Use
Geographies Covered North America, Europe, Asia-Pacific, Latin America, Middle East, Africa
Key Vendors Airbus S.A.S., Matternet, Flirtey, Drone Delivery Canada, Flytrex, Amazon.com, JD.com, Marble Robot, Starship Technologies and Savioke.
Key Market Opportunities • The growing demand for Sustainability and Environmental Benefits
• Improved Supply Chain Efficiency
Key Market Drivers • Technological Advancements
• Urbanization and Traffic Congestion

REPORT CONTENT BRIEF:

  • High-level analysis of the current and future Autonomous Last Mile Delivery Market trends and opportunities
  • Detailed analysis of current market drivers, restraining factors, and opportunities in the future
  • Autonomous Last Mile Delivery Market historical market size for the year 2021, and forecast from 2023 to 2033
  • Autonomous Last Mile Delivery Market share analysis at each product level
  • Competitor analysis with detailed insight into its product segment, Government & Defense strength, and strategies adopted.
  • Identifies key strategies adopted including product launches and developments, mergers and acquisitions, joint ventures, collaborations, and partnerships as well as funding taken and investment done, among others.
  • To identify and understand the various factors involved in the global Autonomous Last Mile Delivery Market affected by the pandemic
  • To provide a detailed insight into the major companies operating in the market. The profiling will include the Government & Defense health of the company’s past 2-3 years with segmental and regional revenue breakup, product offering, recent developments, SWOT analysis, and key strategies.


For more details mail us at

Ask a question / additional requirement

Frequently Asked Questions (FAQ)

The Autonomous Last Mile Delivery Market is expected to expand at a compound annual growth rate (CAGR) of 26.74% from 2023 to 2033.

The Asia-Pacific region has emerged as the fastest-growing market for the Autonomous Last Mile Delivery industry.

North America holds a dominant position in the global Autonomous Last Mile Delivery Market.

Key players in the Autonomous Last Mile Delivery Market include Airbus S.A.S., Matternet, Flirtey, Drone Delivery Canada, Flytrex, Amazon.com, JD.com, Marble Robot, Starship Technologies, and Savioke.

Yes, we offer 16 hours of analyst support to solve the queries

Yes, we provide regional as well as country-level reports. Other than this we also provide a sectional report. Please get in contact with our sales representatives.

Table of Content

Table of Content

CHAPTER 1.           Executive Summary

CHAPTER 2.           Scope of the Study

2.1.        Market Definition

2.2.        Market Scope & Segmentation

2.2.1.         Objective of Report

CHAPTER 3.           Evolve BI Methodology

3.1.        Data Collection & Validation Approach

3.2.        Market Size Estimation and Forecast

CHAPTER 4.           Exclusive Analysis

4.1.        Market Opportunity Score

4.1.1.         Platform Segement – Market Opportunity Score

4.1.2.         Solution Segment – Market Opportunity Score

4.1.3.         Application Segment – Market Opportunity Score

4.1.4.         End Use  Segment – Market Opportunity Score

4.2.        Key Market Influencing Indicators

CHAPTER 5.           Market Insights and Trends

5.1.        Value Chain Analysis

5.1.1.         Raw Material

5.1.2.         Manufacturing Process

5.1.3.         Distribution Channel

5.1.4.         End Users

5.2.        Porter’s Five Forces Analysis

5.2.1.         Bargaining Power of Buyers

5.2.2.         Bargaining Power of Suppliers

5.2.3.         Threat of New Entrant

5.2.4.         Threat of Substitute

5.2.5.         Industry Rivalry

5.3.        COVID-19 Impact and Post COVID Scenario on Autonomous Last Mile Delivery Market

5.3.1.         Impact of COVID-19

5.3.2.         Government Support and Industry Revival Policies

5.3.3.         Measures Taken by Companies to Mitigate Negative Impact

5.3.4.         Post COVID Trend

CHAPTER 6.           MArket Dynamics

6.1.        Introduction

6.2.        Drivers

6.2.1.         Driver 1

6.2.2.         Driver 2

6.2.3.         Driver 3

6.3.        Restraints

6.3.1.         Restraint 1

6.3.2.         Restraint 2

6.4.        Opportunity

6.4.1.         Opportunity 1

CHAPTER 7.           Autonomous Last Mile Delivery Market, By Platform

7.1.        Introduction

7.1.1.   Hardware

7.1.2.   Software

CHAPTER 8.           Autonomous Last Mile Delivery Market, By Solution

8.1.                           Introduction

8.1.1. Hardware

8.1.2. Infrastructure

8.1.3.  Software

CHAPTER 9.           Autonomous Last Mile Delivery Market, By Application

9.1.        Introduction

9.1.1. Logistics & Transportation

9.1.2. Healthcare & Pharmacy

9.1.3  Retail & Food Delivery

CHAPTER 10.        Autonomous Last Mile Delivery Market By End Use

10.1.Introduction

10.1.1. Fixed-wing

10.1.2. Rotary-wing

10.1.3.  Hybrid

sCHAPTER 11.      Autonomous Last Mile Delivery Market, By Region

11.1.     Introduction

11.2.     NORTH AMERICA

11.2.1.      North America: Market Size and Forecast, By Country, 2023 – 2033 ($ Million)

11.2.2.      North America: Market Size and Forecast, By Platform, 2023 – 2033 ($ Million)

11.2.3.      North America: Market Size and Forecast, By Solution, 2023 – 2033 ($ Million)

11.2.4.      North America: Market Size and Forecast, By Application, 2023 – 2033 ($ Million)

11.2.5.      North America: Market Size and Forecast, By End Use, 2023 – 2033 ($ Million)

11.2.6.      US

11.2.6.1.       US: Market Size and Forecast, By Platform, 2023 – 2033 ($ Million)

11.2.6.2.       US: Market Size and Forecast, By Solution, 2023 – 2033 ($ Million)

11.2.6.3.       US: Market Size and Forecast, By Application, 2023 – 2033 ($ Million)

11.2.6.4.       US: Market Size and Forecast, By End Use, 2023 – 2033 ($ Million)

11.2.7.      CANADA

11.2.7.1.       Canada: Market Size and Forecast, By Platform, 2023 – 2033 ($ Million)

11.2.7.2.       Canada: Market Size and Forecast, By Solution, 2023 – 2033 ($ Million)

11.2.7.3.       Canada: Market Size and Forecast, By Application, 2023 – 2033 ($ Million)

11.2.7.4.       Canada: Market Size and Forecast, By End Use, 2023 – 2033 ($ Million)

11.2.8.      MEXICO

11.2.8.1.       Mexico: Market Size and Forecast, By Platform, 2023 – 2033 ($ Million)

11.2.8.2.       Mexico: Market Size and Forecast, By Solution, 2023 – 2033 ($ Million)

11.2.8.3.       Mexico: Market Size and Forecast, By Application, 2023 – 2033 ($ Million)

11.2.8.4.       Mexico: Market Size and Forecast, By End Use, 2023 – 2033 ($ Million)

11.3.     Europe

11.3.1.      Europe: Market Size and Forecast, By Country, 2023 – 2033 ($ Million)

11.3.2.      Europe: Market Size and Forecast, By Platform, 2023 – 2033 ($ Million)

11.3.3.      Europe: Market Size and Forecast, By Solution, 2023 – 2033 ($ Million)

11.3.4.      Europe: Market Size and Forecast, By Application, 2023 – 2033 ($ Million)

11.3.5.      Europe: Market Size and Forecast, By End Use, 2023 – 2033 ($ Million)

11.3.6.      U.K.

11.3.6.1.       U.K.: Market Size and Forecast, By Platform, 2023 – 2033 ($ Million)

11.3.6.2.       U.K.: Market Size and Forecast, By Solution, 2023 – 2033 ($ Million)

11.3.6.3.       U.K.: Market Size and Forecast, By Application, 2023 – 2033 ($ Million)

11.3.6.4.       U.K.: Market Size and Forecast, By End Use, 2023 – 2033 ($ Million)

11.3.7.      GERMANY

11.3.7.1.       Germany: Market Size and Forecast, By Platform, 2023 – 2033 ($ Million)

11.3.7.2.       Germany: Market Size and Forecast, By Solution, 2023 – 2033 ($ Million)

11.3.7.3.       Germany: Market Size and Forecast, By Application, 2023 – 2033 ($ Million)

11.3.7.4.       Germany: Market Size and Forecast, By End Use, 2023 – 2033 ($ Million)

11.3.8.      FRANCE

11.3.8.1.       France: Market Size and Forecast, By Platform, 2023 – 2033 ($ Million)

11.3.8.2.       France: Market Size and Forecast, By Solution, 2023 – 2033 ($ Million)

11.3.8.3.       France: Market Size and Forecast, By Application, 2023 – 2033 ($ Million)

11.3.8.4.       France: Market Size and Forecast, By End Use, 2023 – 2033 ($ Million)

11.3.9.      ITALY

11.3.9.1.       Italy: Market Size and Forecast, By Platform, 2023 – 2033 ($ Million)

11.3.9.2.       Italy: Market Size and Forecast, By Solution, 2023 – 2033 ($ Million)

11.3.9.3.       Italy: Market Size and Forecast, By Application, 2023 – 2033 ($ Million)

11.3.9.4.       Italy: Market Size and Forecast, By End Use, 2023 – 2033 ($ Million)

11.3.10.         SPAIN

11.3.10.1.     Spain: Market Size and Forecast, By Platform, 2023 – 2033 ($ Million)

11.3.10.2.     Spain: Market Size and Forecast, By Solution, 2023 – 2033 ($ Million)

11.3.10.3.     Spain: Market Size and Forecast, By Application, 2023 – 2033 ($ Million)

11.3.10.4.     Spain: Market Size and Forecast, By End Use, 2023 – 2033 ($ Million)

11.3.11.         BENELUX

11.3.11.1.     BeNeLux: Market Size and Forecast, By Platform, 2023 – 2033 ($ Million)

11.3.11.2.     BeNeLux: Market Size and Forecast, By Solution, 2023 – 2033 ($ Million)

11.3.11.3.     BeNeLux: Market Size and Forecast, By Application, 2023 – 2033 ($ Million)

11.3.11.4.     BeNeLux: Market Size and Forecast, By End Use, 2023 – 2033 ($ Million)

11.3.12.         RUSSIA

11.3.12.1.     Russia: Market Size and Forecast, By Platform, 2023 – 2033 ($ Million)

11.3.12.2.     Russia: Market Size and Forecast, By Solution, 2023 – 2033 ($ Million)

11.3.12.3.     Russia: Market Size and Forecast, By Application, 2023 – 2033 ($ Million)

11.3.12.4.     Russia: Market Size and Forecast, By End Use, 2023 – 2033 ($ Million)

11.3.13.         REST OF EUROPE

11.3.13.1.     Rest of Europe: Market Size and Forecast, By Platform, 2023 – 2033 ($ Million)

11.3.13.2.     Rest of Europe: Market Size and Forecast, By Solution, 2023 – 2033 ($ Million)

11.3.13.3.     Rest of Europe: Market Size and Forecast, By Application, 2023 – 2033 ($ Million)

11.3.13.4.     Rest of Europe: Market Size and Forecast, By End Use, 2023 – 2033 ($ Million)

11.4.     Asia Pacific

11.4.1.      Asia Pacific: Market Size and Forecast, By Country, 2023 – 2033 ($ Million)

11.4.2.      Asia Pacific: Market Size and Forecast, By Platform, 2023 – 2033 ($ Million)

11.4.3.      Asia Pacific: Market Size and Forecast, By Solution, 2023 – 2033 ($ Million)

11.4.4.      Asia Pacific: Market Size and Forecast, By Application, 2023 – 2033 ($ Million)

11.4.5.      Asia Pacific: Market Size and Forecast, By End Use, 2023 – 2033 ($ Million)

11.4.6.      CHINA

11.4.6.1.       China: Market Size and Forecast, By Platform, 2023 – 2033 ($ Million)

11.4.6.2.       China: Market Size and Forecast, By Solution, 2023 – 2033 ($ Million)

11.4.6.3.       China: Market Size and Forecast, By Application, 2023 – 2033 ($ Million)

11.4.6.4.       China: Market Size and Forecast, By End Use, 2023 – 2033 ($ Million)

11.4.7.      JAPAN

11.4.7.1.       Japan: Market Size and Forecast, By Platform, 2023 – 2033 ($ Million)

11.4.7.2.       Japan: Market Size and Forecast, By Solution, 2023 – 2033 ($ Million)

11.4.7.3.       Japan: Market Size and Forecast, By Application, 2023 – 2033 ($ Million)

11.4.7.4.       Japan: Market Size and Forecast, By End Use, 2023 – 2033 ($ Million)

11.4.8.      INDIA

11.4.8.1.       India: Market Size and Forecast, By Platform, 2023 – 2033 ($ Million)

11.4.8.2.       India: Market Size and Forecast, By Solution, 2023 – 2033 ($ Million)

11.4.8.3.       India: Market Size and Forecast, By Application, 2023 – 2033 ($ Million)

11.4.8.4.       India: Market Size and Forecast, By End Use, 2023 – 2033 ($ Million)

11.4.9.      SOUTH KOREA

11.4.9.1.       South Korea: Market Size and Forecast, By Platform, 2023 – 2033 ($ Million)

11.4.9.2.       South Korea: Market Size and Forecast, By Solution, 2023 – 2033 ($ Million)

11.4.9.3.       South Korea: Market Size and Forecast, By Application, 2023 – 2033 ($ Million)

11.4.9.4.       South Korea: Market Size and Forecast, By End Use, 2023 – 2033 ($ Million)

11.4.10.         THAILAND

11.4.10.1.     Thailand: Market Size and Forecast, By Platform, 2023 – 2033 ($ Million)

11.4.10.2.     Thailand: Market Size and Forecast, By Solution, 2023 – 2033 ($ Million)

11.4.10.3.     Thailand: Market Size and Forecast, By Application, 2023 – 2033 ($ Million)

11.4.10.4.     Thailand: Market Size and Forecast, By End Use, 2023 – 2033 ($ Million)

11.4.11.         INDONESIA

11.4.11.1.     Indonesia: Market Size and Forecast, By Platform, 2023 – 2033 ($ Million)

11.4.11.2.     Indonesia: Market Size and Forecast, By Solution, 2023 – 2033 ($ Million)

11.4.11.3.     Indonesia: Market Size and Forecast, By Application, 2023 – 2033 ($ Million)

11.4.11.4.     Indonesia: Market Size and Forecast, By End Use, 2023 – 2033 ($ Million)

11.4.12.         MALAYSIA

11.4.12.1.     Malaysia: Market Size and Forecast, By Platform, 2023 – 2033 ($ Million)

11.4.12.2.     Malaysia: Market Size and Forecast, By Solution, 2023 – 2033 ($ Million)

11.4.12.3.     Malaysia: Market Size and Forecast, By Application, 2023 – 2033 ($ Million)

11.4.12.4.     Malaysia: Market Size and Forecast, By End Use, 2023 – 2033 ($ Million)

11.4.13.         AUSTRALIA

11.4.13.1.     Australia: Market Size and Forecast, By Platform, 2023 – 2033 ($ Million)

11.4.13.2.     Australia: Market Size and Forecast, By Solution, 2023 – 2033 ($ Million)

11.4.13.3.     Australia: Market Size and Forecast, By Application, 2023 – 2033 ($ Million)

11.4.13.4.     Australia: Market Size and Forecast, By End Use, 2023 – 2033 ($ Million)

11.4.14.         REST FO ASIA PACIFIC

11.4.14.1.     Rest fo Asia Pacific: Market Size and Forecast, By Platform, 2023 – 2033 ($ Million)

11.4.14.2.     Rest fo Asia Pacific: Market Size and Forecast, By Solution, 2023 – 2033 ($ Million)

11.4.14.3.     Rest fo Asia Pacific: Market Size and Forecast, By Application, 2023 – 2033 ($ Million)

11.4.14.4.     Rest fo Asia Pacific: Market Size and Forecast, By End Use, 2023 – 2033 ($ Million)

11.5.     South America

11.5.1.      South America: Market Size and Forecast, By Country, 2023 – 2033 ($ Million)

11.5.2.      South America: Market Size and Forecast, By Platform, 2023 – 2033 ($ Million)

11.5.3.      South America: Market Size and Forecast, By Solution, 2023 – 2033 ($ Million)

11.5.4.      South America: Market Size and Forecast, By Application, 2023 – 2033 ($ Million)

11.5.5.      South America: Market Size and Forecast, By End Use, 2023 – 2033 ($ Million)

11.5.6.      BRAZIL

11.5.6.1.       Brazil: Market Size and Forecast, By Platform, 2023 – 2033 ($ Million)

11.5.6.2.       Brazil: Market Size and Forecast, By Solution, 2023 – 2033 ($ Million)

11.5.6.3.       Brazil: Market Size and Forecast, By Application, 2023 – 2033 ($ Million)

11.5.6.4.       Brazil: Market Size and Forecast, By End Use, 2023 – 2033 ($ Million)

11.5.7.      ARGENTINA

11.5.7.1.       Argentina: Market Size and Forecast, By Platform, 2023 – 2033 ($ Million)

11.5.7.2.       Argentina: Market Size and Forecast, By Solution, 2023 – 2033 ($ Million)

11.5.7.3.       Argentina: Market Size and Forecast, By Application, 2023 – 2033 ($ Million)

11.5.7.4.       Argentina: Market Size and Forecast, By End Use, 2023 – 2033 ($ Million)

11.5.8.      REST OF SOUTH AMERICA

11.5.8.1.       Rest of South America: Market Size and Forecast, By Platform, 2023 – 2033 ($ Million)

11.5.8.2.       Rest of South America: Market Size and Forecast, By Solution, 2023 – 2033 ($ Million)

11.5.8.3.       Rest of South America: Market Size and Forecast, By Application, 2023 – 2033 ($ Million)

11.5.8.4.       Rest of South America: Market Size and Forecast, By End Use, 2023 – 2033 ($ Million)

11.6.     Middle East & Africa

11.6.1.      Middle East & Africa: Market Size and Forecast, By Country, 2023 – 2033 ($ Million)

11.6.2.      Middle East & Africa: Market Size and Forecast, By Platform, 2023 – 2033 ($ Million)

11.6.3.      Middle East & Africa: Market Size and Forecast, By Solution, 2023 – 2033 ($ Million)

11.6.4.      Middle East & Africa: Market Size and Forecast, By Application, 2023 – 2033 ($ Million)

11.6.5.      Middle East & Africa: Market Size and Forecast, By End Use, 2023 – 2033 ($ Million)

11.6.6.      SAUDI ARABIA

11.6.6.1.       Saudi Arabia: Market Size and Forecast, By Platform, 2023 – 2033 ($ Million)

11.6.6.2.       Saudi Arabia: Market Size and Forecast, By Solution, 2023 – 2033 ($ Million)

11.6.6.3.       Saudi Arabia: Market Size and Forecast, By Application, 2023 – 2033 ($ Million)

11.6.6.4.       Saudi Arabia: Market Size and Forecast, By End Use, 2023 – 2033 ($ Million)

11.6.7.      UAE

11.6.7.1.       UAE: Market Size and Forecast, By Platform, 2023 – 2033 ($ Million)

11.6.7.2.       UAE: Market Size and Forecast, By Solution, 2023 – 2033 ($ Million)

11.6.7.3.       UAE: Market Size and Forecast, By Application, 2023 – 2033 ($ Million)

11.6.7.4.       UAE: Market Size and Forecast, By End Use, 2023 – 2033 ($ Million)

11.6.8.      EGYPT

11.6.8.1.       Egypt: Market Size and Forecast, By Platform, 2023 – 2033 ($ Million)

11.6.8.2.       Egypt: Market Size and Forecast, By Solution, 2023 – 2033 ($ Million)

11.6.8.3.       Egypt: Market Size and Forecast, By Application, 2023 – 2033 ($ Million)

11.6.8.4.       Egypt: Market Size and Forecast, By End Use, 2023 – 2033 ($ Million)

11.6.9.      SOUTH AFRICA

11.6.9.1.       South Africa: Market Size and Forecast, By Platform, 2023 – 2033 ($ Million)

11.6.9.2.       South Africa: Market Size and Forecast, By Solution, 2023 – 2033 ($ Million)

11.6.9.3.       South Africa: Market Size and Forecast, By Application, 2023 – 2033 ($ Million)

11.6.9.4.       South Africa: Market Size and Forecast, By End Use, 2023 – 2033 ($ Million)

11.6.10.         REST OF MIDDLE EAST & AFRICA

11.6.10.1.     Rest of Middle East & Africa: Market Size and Forecast, By Platform, 2023 – 2033 ($ Million)

11.6.10.2.     Rest of Middle East & Africa: Market Size and Forecast, By Solution, 2023 – 2033 ($ Million)

11.6.10.3.     Rest of Middle East & Africa: Market Size and Forecast, By Application, 2023 – 2033 ($ Million)

11.6.10.4.     Rest of Middle East & Africa: Market Size and Forecast, By End Use, 2023 – 2033 ($ Million)

CHAPTER 12.        Competitive Landscape

12.1.     Competitior Benchmarking 2023

12.2.     Market Share Analysis

12.3.     Key Developments Analysis By Top 5 Companies

12.4.     Market Share Acquisition Strategies: Analysis of Key Approaches Employed by Top Players

CHAPTER 13.        Company Profiles

13.1.     Airbus S.A.S.

13.1.1.  Business Overview

13.1.2.      Financial Analysis

13.1.2.1.       Business Segment Revenue, 2018, 2019, 2020, $ Million

13.1.2.2.       Geographic Revenue Mix, 2020 (% Share)

13.1.3.      Product Portfolio

13.1.4.      Recent Development and Strategies Adopted

13.1.5.      SWOT Analysis

13.2.     Matternet

13.3.     Flirtey

13.4.     Drone Delivery Canada

13.5.     Flytrex

13.6.     Amazon.com

13.7.     JD.com

13.8.     Marble Robot

13.9.     Starship Technologies

13.10.  Savioke


Connect to Analyst

Connect to Analyst

Research Methodology

Research Methodology