Automotive Suspension Market Analysis and Global Forecast 2023-2033
$ 1,390.00 – $ 5,520.00
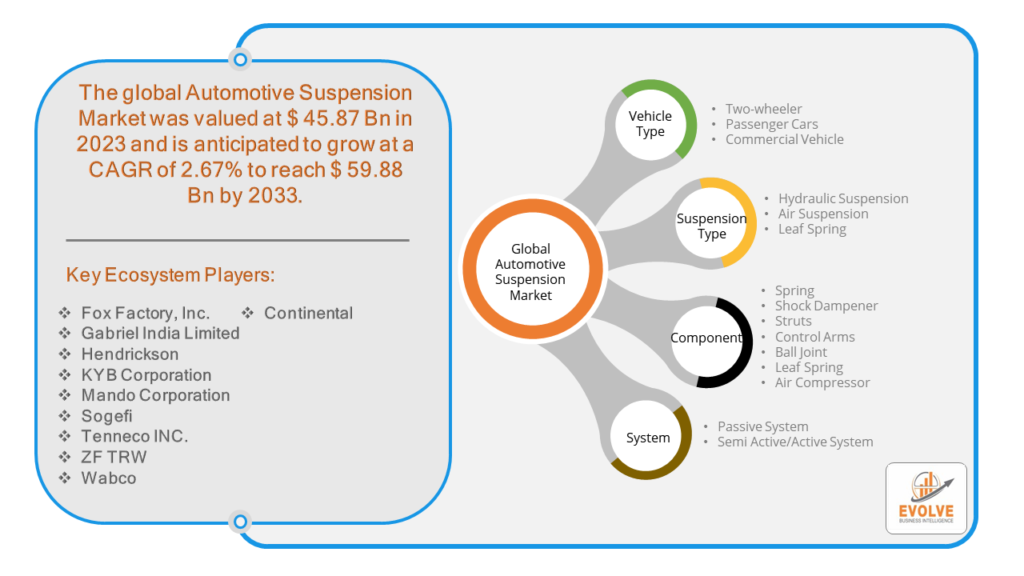
Automotive Suspension Market Research Report: By Vehicle Type (Two-wheeler, Passenger Cars, Commercial Vehicle), By Suspension Type (Hydraulic Suspension, Air Suspension, Leaf Spring), By Component (Spring, Shock Dampener, Struts, Control Arms, Ball Joint, Leaf Spring, Air Compressor, Component 8), By System (Passive System, Semi Active/Active System), and by Region — Forecast till 2033
Page: 171
Automotive Suspension Market Overview
Automotive Suspension Market Size is expected to reach USD 59.88 Billion by 2033. The Automotive Suspension industry size accounted for USD 45.87 Billion in 2023 and is expected to expand at a compound annual growth rate (CAGR) of 2.67% from 2023 to 2033. The automotive suspension market encompasses the industry segment dedicated to the design, manufacture, and sale of systems that support vehicle dynamics by absorbing shocks and ensuring stability. It includes various components such as springs, shock absorbers, struts, and control arms. Key factors driving this market include the increasing demand for passenger comfort, vehicle safety, and improved handling performance. Technological advancements like adaptive and semi-active suspensions are also propelling growth. The market caters to a wide range of vehicles, from passenger cars to commercial trucks, across both OEM (original equipment manufacturer) and aftermarket sectors.
Global Automotive Suspension Market Synopsis
The COVID-19 pandemic has led to supply chain disruptions leading to supply shortages or lower demand in the Automotive Suspension market. The travel restrictions and social-distancing measures have resulted in a sharp drop in consumer and business spending and this pattern is to continue for some time. The end-user trend and preferences have changed due to the pandemic and have resulted in manufacturers, developers, and service providers adopting various strategies to stabilize the company.
Global Automotive Suspension Market Dynamics
The major factors that have impacted the growth of Automotive Suspension are as follows:
Drivers:
⮚ Technological Advancements
Innovations in suspension technology, such as adaptive and semi-active suspensions, have revolutionized the market. These systems automatically adjust the suspension settings in real-time based on road conditions and driving dynamics, significantly improving vehicle performance and safety.
Restraint:
- High Costs of Advanced Suspension Systems
The development and implementation of advanced suspension technologies, such as adaptive and semi-active systems, involve significant research and development costs. These high costs are often passed on to consumers, making such systems less affordable and limiting their adoption, particularly in cost-sensitive markets.
Opportunity:
⮚ Advancements in Materials and Manufacturing
Innovations in materials science and manufacturing processes provide opportunities to develop lighter, stronger, and more durable suspension components. For example, the use of advanced composites, high-strength steel, and aluminum alloys can enhance the performance and efficiency of suspension systems while reducing weight and improving fuel economy.
Automotive Suspension Market Segment Overview
By Vehicle Type
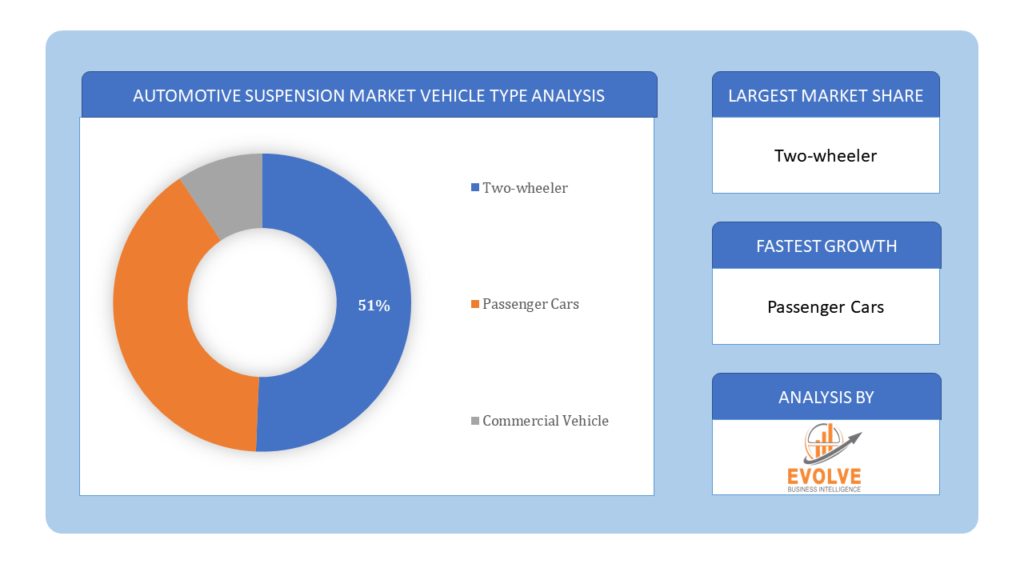
Based on the Vehicle Type, the market is segmented based on Two-wheeler, Passenger Cars, Commercial Vehicle. The passenger car segment is followed by commercial vehicles, which require robust suspension systems to handle heavy loads and varying road conditions
By Suspension Type
Based on Suspension Type, the market has been divided into Hydraulic Suspension, Air Suspension, Leaf Spring. The dominant segment in the global automotive suspension market is the hydraulic suspension segment, which is widely used in various vehicles due to its reliability, durability, and ability to provide precise control over vehicle dynamics and ride quality.
By Component
Based on the Component, the market has been divided into Spring, Shock Dampener, Struts, Control Arms, Ball Joint, Leaf Spring, Air Compressor, Component 8. The global automotive suspension market is dominated by the shock dampener segment, which accounted for the largest market share. Shock dampeners are a critical component of the suspension system, as they help reduce vibrations and improve ride quality across a variety of road conditions.
By System
Based on System, the market has been divided into Passive System, Semi Active/Active System. The global automotive suspension market is dominated by passive suspension systems, which are widely used in various vehicles due to their reliability and cost-effectiveness.
Global Automotive Suspension Market Regional Analysis
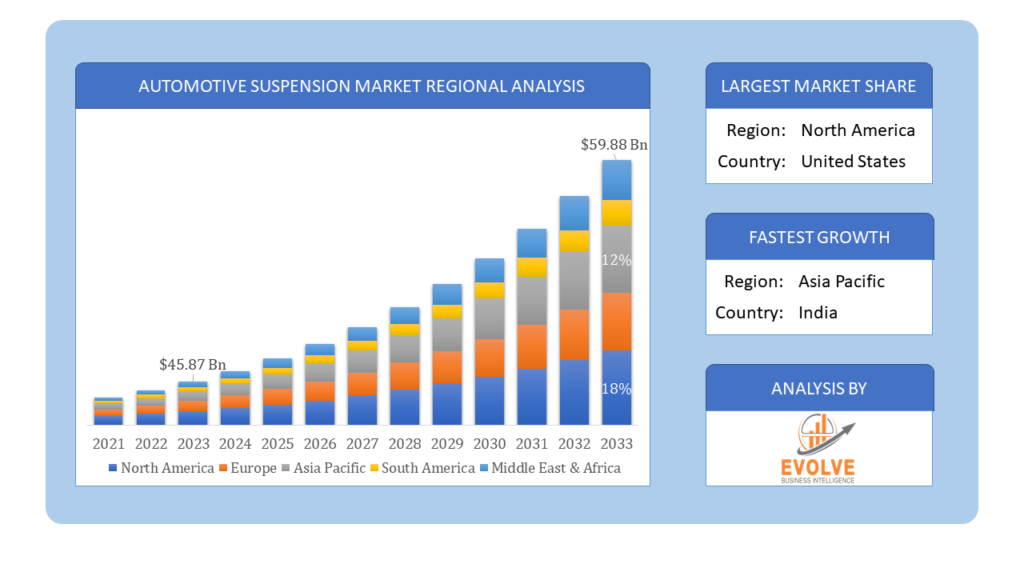
Based on region, the market has been divided into North America, Europe, Asia-Pacific, the Middle East & Africa, and Latin America. The area of North America is anticipated to dominate the market for the usage of Automotive Suspension, followed by those in Asia-Pacific and Europe.
Automotive Suspension North America Market
The North American region holds a dominant position in the Automotive Suspension market. The market for automotive suspension systems will be dominated by North America; expanding demand for passenger and commercial vehicles, stricter safety laws, and the introduction of cutting-edge suspension systems will all contribute to this region’s rapid market expansion.
Automotive Suspension Asia Pacific Market
The Asia-Pacific region is witnessing rapid growth and emerging as a significant market for the Automotive Suspension industry. From 2023 to 2032, the Automotive Suspension System Market in Asia-Pacific is anticipated to develop at the quickest compound annual growth rate (CAGR). This is a result of the region’s growing automobile manufacturing industry. In addition, the automotive suspension system market in China had the most market share, while the market in India had the quickest rate of growth in the Asia-Pacific area.
Competitive Landscape
The competitive landscape includes key players (tier 1, tier 2, and local) having a presence across the globe. Companies such as Fox Factory, Inc., Gabriel India Limited, Hendrickson, KYB Corporation, and Mando Corporation are some of the leading players in the global Automotive Suspension Industry. These players have adopted partnership, acquisition, expansion, and new product development, among others as their key strategies.
Key Market Players:
- Fox Factory, Inc.
- Gabriel India Limited
- Hendrickson
- KYB Corporation
- Mando Corporation
- Sogefi
- Tenneco INC.
- ZF TRW
- Wabco
- Continental
Key Development:
In September 2022, KYB Corporation announced that it will conduct development of new electric power steering (EPS) systems and establish electric oil pump specifications to support its automotive components business
Scope of the Report
Global Automotive Suspension Market, by Vehicle Type
- Two-wheeler
- Passenger Cars
- Commercial Vehicle
Global Automotive Suspension Market, by Suspension Type
- Hydraulic Suspension
- Air Suspension
- Leaf Spring
Global Automotive Suspension Market, by Component
- Spring
- Shock Dampener
- Struts
- Control Arms
- Ball Joint
- Leaf Spring
- Air Compressor
Global Automotive Suspension Market, by System
- Passive System
- Semi Active/Active System
Global Automotive Suspension Market, by Region
- North America
- US
- Canada
- Mexico
- Europe
- UK
- Germany
- France
- Italy
- Spain
- Benelux
- Nordic
- Rest of Europe
- Asia Pacific
- China
- Japan
- South Korea
- Indonesia
- Austalia
- Malaysia
- India
- Rest of Asia Pacific
- South America
- Brazil
- Argentina
- Rest of South America
- Middle East & Africa
- Saudi Arabia
- UAE
- Egypt
- South Africa
- Rest of Middle East & Africa
Parameters | Indicators |
---|---|
Market Size | 2033: $59.88 Billion/strong> |
CAGR | 2.67% CAGR (2023-2033) |
Base year | 2022 |
Forecast Period | 2023-2033 |
Historical Data | 2021 |
Report Coverage | Revenue Forecast, Competitive Landscape, Growth Factors, and Trends |
Key Segmentations | Vehicle Type, Suspension Type, Component, System |
Geographies Covered | North America, Europe, Asia-Pacific, Latin America, Middle East, Africa |
Key Vendors | Fox Factory, Inc., Gabriel India Limited, Hendrickson, KYB Corporation, Mando Corporation, Sogefi, Tenneco INC., ZF TRW, Wabco, Continental |
Key Market Opportunities | Demand for a regenerative suspension system for electric and hybrid vehicles Advancements in lightweight components |
Key Market Drivers | Increased safety regulations Introduction of innovative suspension systems Rising demand for commercial and passenger vehicles |
REPORT CONTENT BRIEF:
- High-level analysis of the current and future Automotive Suspension Industry trends and opportunities
- Detailed analysis of current market drivers, restraining factors, and opportunities analysis in the future
- Historical market size for the year 2021, and forecast from 2023 to 2033
- Automotive Suspension market share analysis for each segment
- Competitor analysis with a comprehensive insight into its product segment, financial strength, and strategies adopted.
- Identifies key strategies adopted by the key players including new product development, mergers and acquisitions, joint ventures, collaborations, and partnerships.
- To identify and understand the various factors involved in the global Automotive Suspension market affected by the pandemic
- To provide year-on-year growth from 2022 to 2033
- To provide short-term, long-term, and overall CAGR comparison from 2022 to 2033.
- Provide Total Addressable Market (TAM) for the Global Automotive Suspension Market.
Press Release
Adventure Sports Travel Insurance Market to Reach USD 14.35 Billion by 2034
Pet Care Market to Reach USD 325.65 Billion by 2034
International Legal Services Market to Reach USD 4235.56 Billion by 2034
Global Business Process Automation Software Market Forecast to Reach USD 23.88 Billion by 2034, Growing at an 11.85% CAGR
Global Aviation Carbon Fiber Market Forecast to Reach USD 8.41 Billion by 2034, Growing at an 11.93% CAGR
Global Spandex Fiber Market Forecast to Reach USD 18.65 Billion by 2034, Growing at a 7.85% CAGR
Global Polymer Nanocomposites Market Forecast to Reach USD 25.65 Billion by 2034, Growing at a 5.85% CAGR
Global Vending Machine Market Forecast to Reach USD 33.98 Billion by 2034, Growing at a 17.21% CAGR
Global Swine Feed Market Forecast to Reach USD 185.45 Billion by 2034, Growing at a 3.52% CAGR
Global Fat Replacers Market Forecast to Reach USD 9.36 Billion by 2034, Growing at a 6.52% CAGR
Frequently Asked Questions (FAQ)
1. What is the study period of this market?
- The study period of the global Automotive Suspension market is 2022- 2033
2. What are the 10 Years CAGR (2023 to 2033) of the global Automotive Suspension market?
- The global Automotive Suspension market is growing at a CAGR of ~67% over the next 10 years
3. Which region has the highest growth rate in the market of Automotive Suspension?
- Asia Pacific is expected to register the highest CAGR during 2023-2033
4. Which region accounted for the largest share of the market of Automotive Suspension?
- North America holds the largest share in 2022
5. Major Key Players in the Market of Automotive Suspension?
- Fox Factory, Inc., Gabriel India Limited, Hendrickson, KYB Corporation, Mando Corporation, Sogefi, Tenneco INC., ZF TRW, Wabco, and Continental are the major companies operating in the Automotive Suspension
6. Do you offer Post Sale Support?
- Yes, we offer 16 hours of analyst support to solve the queries
7. Do you deliver sections of a report?
Yes, we do provide regional as well as country-level reports. Other than this we also provide a sectional report. Please get in contact with our sales representatives
Table of Content
CHAPTER 1. Executive Summary CHAPTER 2. Scope of the Study 2.1. Market Definition 2.2. Market Scope & Segmentation 2.2.1. Objective of Report CHAPTER 3. Evolve BI Methodology 3.1. Data Collection & Validation Approach 3.2. Market Size Estimation and Forecast CHAPTER 4. Exclusive Analysis 4.1. Market Opportunity Score 4.1.1. Vehicle Type Segement – Market Opportunity Score 4.1.2. Suspension Type Segment – Market Opportunity Score 4.1.3. Component Segment – Market Opportunity Score 4.1.4. System Segment – Market Opportunity Score 4.2. Key Market Influencing Indicators CHAPTER 5. Market Insights and Trends 5.1. Value Chain Analysis 5.1.1. Vehicle Type 5.1.2. Manufacturing Process 5.1.3. Distribution Channel 5.1.4. End User 5.2. Porter’s Five Forces Analysis 5.2.1. Bargaining Power of Buyers 5.2.2. Bargaining Power of Suppliers 5.2.3. Threat of New Entrant 5.2.4. Threat of Substitute 5.2.5. Industry Rivalry 5.3. COVID-19 Impact and Post COVID Scenario on Automotive Suspension Market 5.3.1. Impact of COVID-19 5.3.2. Government Support and Industry Revival Policies 5.3.3. Measures Taken by Companies to Mitigate Negative Impact 5.3.4. Post COVID Trend CHAPTER 6. MArket Dynamics 6.1. Introduction 6.2. Drivers 6.2.1. Driver 1 6.2.2. Driver 2 6.2.3. Driver 3 6.3. Restraints 6.3.1. Restraint 1 6.3.2. Restraint 2 6.4. Opportunity 6.4.1. Opportunity 1 CHAPTER 7. Global Automotive Suspension Market, By Vehicle Type 7.1. Introduction 7.1.1. Two-wheeler 7.1.2. Passenger Cars 7.1.3. Commercial Vehicle CHAPTER 8. Global Automotive Suspension Market, By Suspension Type 8.1. Introduction 8.1.1. Hydraulic Suspension 8.1.2. Air Suspension 8.1.3. Leaf Spring CHAPTER 9. Global Automotive Suspension Market, By Component 9.1. Introduction 9.1.1. Spring 9.1.2. Shock Dampener 9.1.3. Struts 9.1.4. Control Arms 9.1.5. Ball Joint 9.1.6. Leaf Spring 9.1.7. Air Compressor CHAPTER 10. Global Automotive Suspension Market, By System 10.1. Introduction 10.1.1. Passive System 10.1.2. Semi Active/Active System CHAPTER 11. Global Automotive Suspension Market, By Region 11.1. Introduction 11.2. NORTH AMERICA 11.2.1. North America: Market Size and Forecast, By Country, 2023 – 2033 ($ Million) 11.2.2. North America: Market Size and Forecast, By Vehicle Type, 2023 – 2033 ($ Million) 11.2.3. North America: Market Size and Forecast, By Suspension Type, 2023 – 2033 ($ Million) 11.2.4. North America: Market Size and Forecast, By Component, 2023 – 2033 ($ Million) 11.2.5. North America: Market Size and Forecast, By System, 2023 – 2033 ($ Million) 11.2.6. US 11.2.6.1. US: Market Size and Forecast, By Vehicle Type, 2023 – 2033 ($ Million) 11.2.6.2. US: Market Size and Forecast, By Suspension Type, 2023 – 2033 ($ Million) 11.2.6.3. US: Market Size and Forecast, By Component, 2023 – 2033 ($ Million) 11.2.6.4. US: Market Size and Forecast, By System, 2023 – 2033 ($ Million) 11.2.7. CANADA 11.2.7.1. Canada: Market Size and Forecast, By Vehicle Type, 2023 – 2033 ($ Million) 11.2.7.2. Canada: Market Size and Forecast, By Suspension Type, 2023 – 2033 ($ Million) 11.2.7.3. Canada: Market Size and Forecast, By Component, 2023 – 2033 ($ Million) 11.2.7.4. Canada: Market Size and Forecast, By System, 2023 – 2033 ($ Million) 11.2.8. MEXICO 11.2.8.1. Mexico: Market Size and Forecast, By Vehicle Type, 2023 – 2033 ($ Million) 11.2.8.2. Mexico: Market Size and Forecast, By Suspension Type, 2023 – 2033 ($ Million) 11.2.8.3. Mexico: Market Size and Forecast, By Component, 2023 – 2033 ($ Million) 11.2.8.4. Mexico: Market Size and Forecast, By System, 2023 – 2033 ($ Million) 11.3. Europe 11.3.1. Europe: Market Size and Forecast, By Country, 2023 – 2033 ($ Million) 11.3.2. Europe: Market Size and Forecast, By Vehicle Type, 2023 – 2033 ($ Million) 11.3.3. Europe: Market Size and Forecast, By Suspension Type, 2023 – 2033 ($ Million) 11.3.4. Europe: Market Size and Forecast, By Component, 2023 – 2033 ($ Million) 11.3.5. Europe: Market Size and Forecast, By System, 2023 – 2033 ($ Million) 11.3.6. U.K. 11.3.6.1. U.K.: Market Size and Forecast, By Vehicle Type, 2023 – 2033 ($ Million) 11.3.6.2. U.K.: Market Size and Forecast, By Suspension Type, 2023 – 2033 ($ Million) 11.3.6.3. U.K.: Market Size and Forecast, By Component, 2023 – 2033 ($ Million) 11.3.6.4. U.K.: Market Size and Forecast, By System, 2023 – 2033 ($ Million) 11.3.7. GERMANY 11.3.7.1. Germany: Market Size and Forecast, By Vehicle Type, 2023 – 2033 ($ Million) 11.3.7.2. Germany: Market Size and Forecast, By Suspension Type, 2023 – 2033 ($ Million) 11.3.7.3. Germany: Market Size and Forecast, By Component, 2023 – 2033 ($ Million) 11.3.7.4. Germany: Market Size and Forecast, By System, 2023 – 2033 ($ Million) 11.3.8. FRANCE 11.3.8.1. France: Market Size and Forecast, By Vehicle Type, 2023 – 2033 ($ Million) 11.3.8.2. France: Market Size and Forecast, By Suspension Type, 2023 – 2033 ($ Million) 11.3.8.3. France: Market Size and Forecast, By Component, 2023 – 2033 ($ Million) 11.3.8.4. France: Market Size and Forecast, By System, 2023 – 2033 ($ Million) 11.3.9. ITALY 11.3.9.1. Italy: Market Size and Forecast, By Vehicle Type, 2023 – 2033 ($ Million) 11.3.9.2. Italy: Market Size and Forecast, By Suspension Type, 2023 – 2033 ($ Million) 11.3.9.3. Italy: Market Size and Forecast, By Component, 2023 – 2033 ($ Million) 11.3.9.4. Italy: Market Size and Forecast, By System, 2023 – 2033 ($ Million) 11.3.10. SPAIN 11.3.10.1. Spain: Market Size and Forecast, By Vehicle Type, 2023 – 2033 ($ Million) 11.3.10.2. Spain: Market Size and Forecast, By Suspension Type, 2023 – 2033 ($ Million) 11.3.10.3. Spain: Market Size and Forecast, By Component, 2023 – 2033 ($ Million) 11.3.10.4. Spain: Market Size and Forecast, By System, 2023 – 2033 ($ Million) 11.3.11. BENELUX 11.3.11.1. BeNeLux: Market Size and Forecast, By Vehicle Type, 2023 – 2033 ($ Million) 11.3.11.2. BeNeLux: Market Size and Forecast, By Suspension Type, 2023 – 2033 ($ Million) 11.3.11.3. BeNeLux: Market Size and Forecast, By Component, 2023 – 2033 ($ Million) 11.3.11.4. BeNeLux: Market Size and Forecast, By System, 2023 – 2033 ($ Million) 11.3.12. RUSSIA 11.3.12.1. Russia: Market Size and Forecast, By Vehicle Type, 2023 – 2033 ($ Million) 11.3.12.2. Russia: Market Size and Forecast, By Suspension Type, 2023 – 2033 ($ Million) 11.3.12.3. Russia: Market Size and Forecast, By Component, 2023 – 2033 ($ Million) 11.3.12.4. Russia: Market Size and Forecast, By System, 2023 – 2033 ($ Million) 11.3.13. REST OF EUROPE 11.3.13.1. Rest of Europe: Market Size and Forecast, By Vehicle Type, 2023 – 2033 ($ Million) 11.3.13.2. Rest of Europe: Market Size and Forecast, By Suspension Type, 2023 – 2033 ($ Million) 11.3.13.3. Rest of Europe: Market Size and Forecast, By Component, 2023 – 2033 ($ Million) 11.3.13.4. Rest of Europe: Market Size and Forecast, By System, 2023 – 2033 ($ Million) 11.4. Asia Pacific 11.4.1. Asia Pacific: Market Size and Forecast, By Country, 2023 – 2033 ($ Million) 11.4.2. Asia Pacific: Market Size and Forecast, By Vehicle Type, 2023 – 2033 ($ Million) 11.4.3. Asia Pacific: Market Size and Forecast, By Suspension Type, 2023 – 2033 ($ Million) 11.4.4. Asia Pacific: Market Size and Forecast, By Component, 2023 – 2033 ($ Million) 11.4.5. Asia Pacific: Market Size and Forecast, By System, 2023 – 2033 ($ Million) 11.4.6. CHINA 11.4.6.1. China: Market Size and Forecast, By Vehicle Type, 2023 – 2033 ($ Million) 11.4.6.2. China: Market Size and Forecast, By Suspension Type, 2023 – 2033 ($ Million) 11.4.6.3. China: Market Size and Forecast, By Component, 2023 – 2033 ($ Million) 11.4.6.4. China: Market Size and Forecast, By System, 2023 – 2033 ($ Million) 11.4.7. JAPAN 11.4.7.1. Japan: Market Size and Forecast, By Vehicle Type, 2023 – 2033 ($ Million) 11.4.7.2. Japan: Market Size and Forecast, By Suspension Type, 2023 – 2033 ($ Million) 11.4.7.3. Japan: Market Size and Forecast, By Component, 2023 – 2033 ($ Million) 11.4.7.4. Japan: Market Size and Forecast, By System, 2023 – 2033 ($ Million) 11.4.8. INDIA 11.4.8.1. India: Market Size and Forecast, By Vehicle Type, 2023 – 2033 ($ Million) 11.4.8.2. India: Market Size and Forecast, By Suspension Type, 2023 – 2033 ($ Million) 11.4.8.3. India: Market Size and Forecast, By Component, 2023 – 2033 ($ Million) 11.4.8.4. India: Market Size and Forecast, By System, 2023 – 2033 ($ Million) 11.4.9. SOUTH KOREA 11.4.9.1. South Korea: Market Size and Forecast, By Vehicle Type, 2023 – 2033 ($ Million) 11.4.9.2. South Korea: Market Size and Forecast, By Suspension Type, 2023 – 2033 ($ Million) 11.4.9.3. South Korea: Market Size and Forecast, By Component, 2023 – 2033 ($ Million) 11.4.9.4. South Korea: Market Size and Forecast, By System, 2023 – 2033 ($ Million) 11.4.10. THAILAND 11.4.10.1. Thailand: Market Size and Forecast, By Vehicle Type, 2023 – 2033 ($ Million) 11.4.10.2. Thailand: Market Size and Forecast, By Suspension Type, 2023 – 2033 ($ Million) 11.4.10.3. Thailand: Market Size and Forecast, By Component, 2023 – 2033 ($ Million) 11.4.10.4. Thailand: Market Size and Forecast, By System, 2023 – 2033 ($ Million) 11.4.11. INDONESIA 11.4.11.1. Indonesia: Market Size and Forecast, By Vehicle Type, 2023 – 2033 ($ Million) 11.4.11.2. Indonesia: Market Size and Forecast, By Suspension Type, 2023 – 2033 ($ Million) 11.4.11.3. Indonesia: Market Size and Forecast, By Component, 2023 – 2033 ($ Million) 11.4.11.4. Indonesia: Market Size and Forecast, By System, 2023 – 2033 ($ Million) 11.4.12. MALAYSIA 11.4.12.1. Malaysia: Market Size and Forecast, By Vehicle Type, 2023 – 2033 ($ Million) 11.4.12.2. Malaysia: Market Size and Forecast, By Suspension Type, 2023 – 2033 ($ Million) 11.4.12.3. Malaysia: Market Size and Forecast, By Component, 2023 – 2033 ($ Million) 11.4.12.4. Malaysia: Market Size and Forecast, By System, 2023 – 2033 ($ Million) 11.4.13. AUSTRALIA 11.4.13.1. Australia: Market Size and Forecast, By Vehicle Type, 2023 – 2033 ($ Million) 11.4.13.2. Australia: Market Size and Forecast, By Suspension Type, 2023 – 2033 ($ Million) 11.4.13.3. Australia: Market Size and Forecast, By Component, 2023 – 2033 ($ Million) 11.4.13.4. Australia: Market Size and Forecast, By System, 2023 – 2033 ($ Million) 11.4.14. REST FO ASIA PACIFIC 11.4.14.1. Rest fo Asia Pacific: Market Size and Forecast, By Vehicle Type, 2023 – 2033 ($ Million) 11.4.14.2. Rest fo Asia Pacific: Market Size and Forecast, By Suspension Type, 2023 – 2033 ($ Million) 11.4.14.3. Rest fo Asia Pacific: Market Size and Forecast, By Component, 2023 – 2033 ($ Million) 11.4.14.4. Rest fo Asia Pacific: Market Size and Forecast, By System, 2023 – 2033 ($ Million) 11.5. South America 11.5.1. South America: Market Size and Forecast, By Country, 2023 – 2033 ($ Million) 11.5.2. South America: Market Size and Forecast, By Vehicle Type, 2023 – 2033 ($ Million) 11.5.3. South America: Market Size and Forecast, By Suspension Type, 2023 – 2033 ($ Million) 11.5.4. South America: Market Size and Forecast, By Component, 2023 – 2033 ($ Million) 11.5.5. South America: Market Size and Forecast, By System, 2023 – 2033 ($ Million) 11.5.6. BRAZIL 11.5.6.1. Brazil: Market Size and Forecast, By Vehicle Type, 2023 – 2033 ($ Million) 11.5.6.2. Brazil: Market Size and Forecast, By Suspension Type, 2023 – 2033 ($ Million) 11.5.6.3. Brazil: Market Size and Forecast, By Component, 2023 – 2033 ($ Million) 11.5.6.4. Brazil: Market Size and Forecast, By System, 2023 – 2033 ($ Million) 11.5.7. ARGENTINA 11.5.7.1. Argentina: Market Size and Forecast, By Vehicle Type, 2023 – 2033 ($ Million) 11.5.7.2. Argentina: Market Size and Forecast, By Suspension Type, 2023 – 2033 ($ Million) 11.5.7.3. Argentina: Market Size and Forecast, By Component, 2023 – 2033 ($ Million) 11.5.7.4. Argentina: Market Size and Forecast, By System, 2023 – 2033 ($ Million) 11.5.8. REST OF SOUTH AMERICA 11.5.8.1. Rest of South America: Market Size and Forecast, By Vehicle Type, 2023 – 2033 ($ Million) 11.5.8.2. Rest of South America: Market Size and Forecast, By Suspension Type, 2023 – 2033 ($ Million) 11.5.8.3. Rest of South America: Market Size and Forecast, By Component, 2023 – 2033 ($ Million) 11.5.8.4. Rest of South America: Market Size and Forecast, By System, 2023 – 2033 ($ Million) 11.6. Middle East & Africa 11.6.1. Middle East & Africa: Market Size and Forecast, By Country, 2023 – 2033 ($ Million) 11.6.2. Middle East & Africa: Market Size and Forecast, By Vehicle Type, 2023 – 2033 ($ Million) 11.6.3. Middle East & Africa: Market Size and Forecast, By Suspension Type, 2023 – 2033 ($ Million) 11.6.4. Middle East & Africa: Market Size and Forecast, By Component, 2023 – 2033 ($ Million) 11.6.5. Middle East & Africa: Market Size and Forecast, By System, 2023 – 2033 ($ Million) 11.6.6. SAUDI ARABIA 11.6.6.1. Saudi Arabia: Market Size and Forecast, By Vehicle Type, 2023 – 2033 ($ Million) 11.6.6.2. Saudi Arabia: Market Size and Forecast, By Suspension Type, 2023 – 2033 ($ Million) 11.6.6.3. Saudi Arabia: Market Size and Forecast, By Component, 2023 – 2033 ($ Million) 11.6.6.4. Saudi Arabia: Market Size and Forecast, By System, 2023 – 2033 ($ Million) 11.6.7. UAE 11.6.7.1. UAE: Market Size and Forecast, By Vehicle Type, 2023 – 2033 ($ Million) 11.6.7.2. UAE: Market Size and Forecast, By Suspension Type, 2023 – 2033 ($ Million) 11.6.7.3. UAE: Market Size and Forecast, By Component, 2023 – 2033 ($ Million) 11.6.7.4. UAE: Market Size and Forecast, By System, 2023 – 2033 ($ Million) 11.6.8. EGYPT 11.6.8.1. Egypt: Market Size and Forecast, By Vehicle Type, 2023 – 2033 ($ Million) 11.6.8.2. Egypt: Market Size and Forecast, By Suspension Type, 2023 – 2033 ($ Million) 11.6.8.3. Egypt: Market Size and Forecast, By Component, 2023 – 2033 ($ Million) 11.6.8.4. Egypt: Market Size and Forecast, By System, 2023 – 2033 ($ Million) 11.6.9. SOUTH AFRICA 11.6.9.1. South Africa: Market Size and Forecast, By Vehicle Type, 2023 – 2033 ($ Million) 11.6.9.2. South Africa: Market Size and Forecast, By Suspension Type, 2023 – 2033 ($ Million) 11.6.9.3. South Africa: Market Size and Forecast, By Component, 2023 – 2033 ($ Million) 11.6.9.4. South Africa: Market Size and Forecast, By System, 2023 – 2033 ($ Million) 11.6.10. REST OF MIDDLE EAST & AFRICA 11.6.10.1. Rest of Middle East & Africa: Market Size and Forecast, By Vehicle Type, 2023 – 2033 ($ Million) 11.6.10.2. Rest of Middle East & Africa: Market Size and Forecast, By Suspension Type, 2023 – 2033 ($ Million) 11.6.10.3. Rest of Middle East & Africa: Market Size and Forecast, By Component, 2023 – 2033 ($ Million) 11.6.10.4. Rest of Middle East & Africa: Market Size and Forecast, By System, 2023 – 2033 ($ Million) CHAPTER 12. Competitive Landscape 12.1. Competitior Benchmarking 2023 12.2. Market Share Analysis 12.3. Key Developments Analysis By Top 5 Companies 12.4. Market Share Acquisition Strategies: Analysis of Key Approaches Employed by Top Players CHAPTER 13. Company Profiles 13.1. Fox Factory, Inc. 13.1.1. Business Overview 13.1.2. Financial Analysis 13.1.2.1. Business Segment Revenue, 2018, 2019, 2020, $ Million 13.1.2.2. Geographic Revenue Mix, 2020 (% Share) 13.1.3. Product Portfolio 13.1.4. Recent Development and Strategies Adopted 13.1.5. SWOT Analysis 13.2. Gabriel India Limited 13.3. Hendrickson 13.4. KYB Corporation 13.5. Mando Corporation 13.6. Sogefi 13.7. Tenneco INC. 13.8. ZF TRW 13.9. Wabco 13.10. Continental