
Automotive Hypervisor Market Analysis and Global Forecast 2023-2033
Price range: $ 1,390.00 through $ 5,520.00
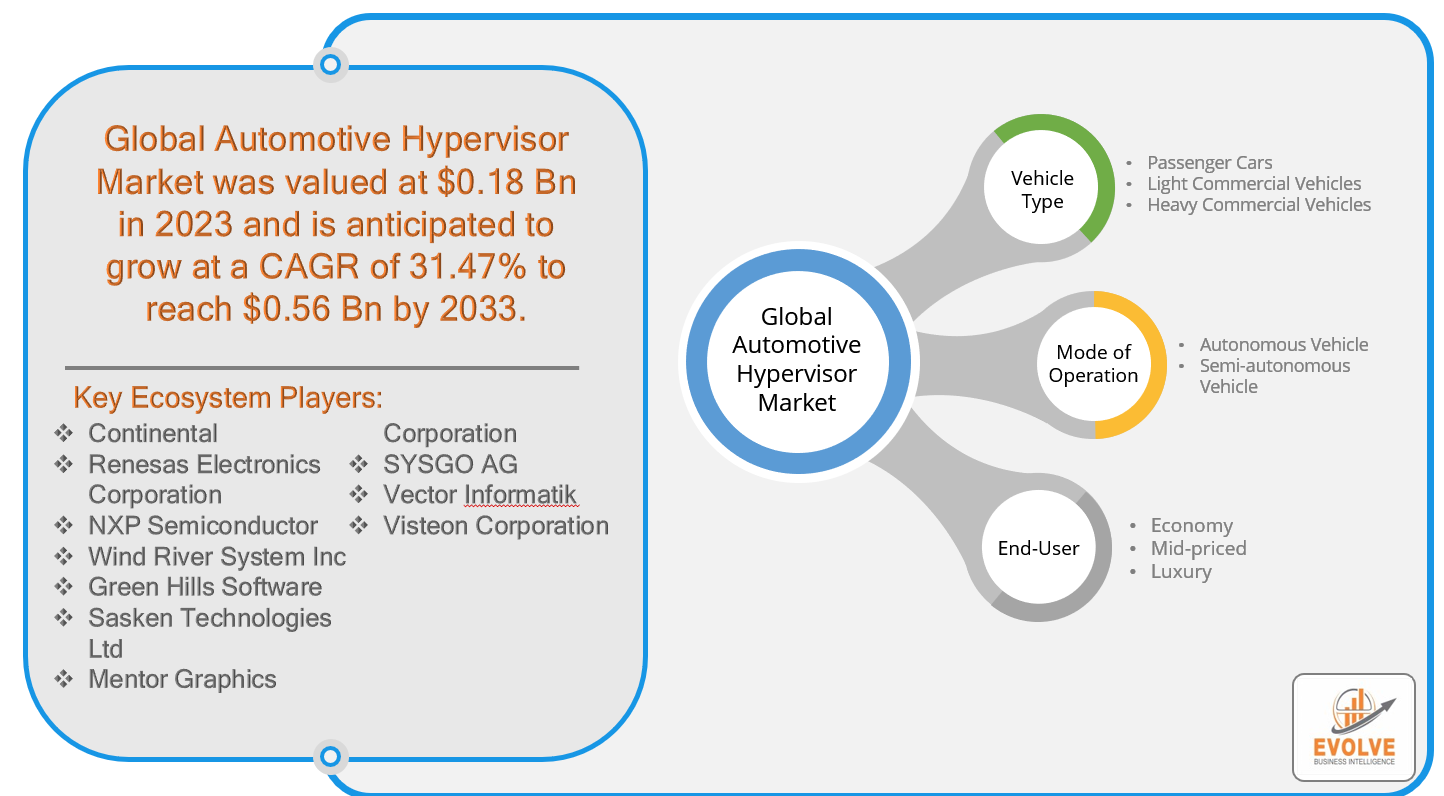
Automotive Hypervisor Market Research Report: By Vehicle Type (Passenger Cars, Light Commercial Vehicles, Heavy Commercial Vehicles), By Mode of Operation (Autonomous Vehicle, Semi-autonomous Vehicle), By End-User (Economy, Mid-priced, Luxury), and by Region — Forecast till 2033
Automotive Hypervisor Market Overview
The Automotive Hypervisor Market Size is expected to reach USD 0.56 Billion by 2033. The Automotive Hypervisor industry size accounted for USD 0.18 Billion in 2023 and is expected to expand at a compound annual growth rate (CAGR) of 31.47% from 2023 to 2033. An automotive hypervisor is a software platform or layer that allows multiple automotive applications and operating systems (OS) to be consolidated and separated on a shared hardware platform. It serves as a virtualization layer, creating a secure and isolated environment within a vehicle’s electronic control units (ECUs) for running various software components. With an automotive hypervisor, different automotive functions and OSs, such as infotainment systems, advanced driver assistance systems (ADAS), and safety-critical applications, can coexist and operate independently on the same hardware. The hypervisor ensures the isolation and integrity of each application, preventing interference and ensuring real-time performance and reliability in the automotive system. It also facilitates efficient resource allocation, and secure communication between applications, and enables individual components to be updated or modified without impacting the entire system. In summary, the automotive hypervisor is a vital component that enables seamless integration, scalability, and flexibility of software systems in modern vehicles.
Global Automotive Hypervisor Market Synopsis
 COVID-19 Impact Analysis
The Automotive Hypervisor market experienced a significant and enduring impact due to the COVID-19 pandemic. Disruptions in global supply chains and manufacturing operations posed challenges for the automotive industry, temporarily slowing down the adoption of innovative technologies like automotive hypervisors. However, the pandemic also accelerated the transition towards connected and autonomous vehicles, driven by the increasing demand for safer and more efficient transportation solutions. Consequently, there was a surge in the need for advanced software platforms such as automotive hypervisors, enabling seamless integration of multiple applications and operating systems within vehicles. The emphasis on contactless experiences and remote services further amplified the demand for software updates and over-the-air (OTA) capabilities, which can be facilitated by hypervisor technology. As the automotive industry recovers and resumes its growth trajectory, the Automotive Hypervisor market is projected to witness substantial expansion, fueled by ongoing digital transformation efforts and a growing emphasis on advanced vehicle functionalities.
Global Automotive Hypervisor Market Dynamics
The major factors that have impacted the growth of Automotive Hypervisor are as follows:
Drivers:
Increasing Demand for Connected and Autonomous Vehicles
The rising demand for connected and autonomous vehicles is a significant driver for the Automotive Hypervisor market. These vehicles require advanced software platforms like hypervisors to integrate and manage multiple applications and operating systems, enabling seamless communication, real-time performance, and enhanced safety features.
Restraint:
- Complex Integration Process
The complex integration process of automotive hypervisors can pose a restraint to market growth. Integrating multiple applications and operating systems within a vehicle’s electronic control units (ECUs) requires careful planning, testing, and validation. This complexity may lead to longer development cycles, increased costs, and potential compatibility issues, which can hinder the widespread adoption of automotive hypervisors.
Opportunity:
Advancements in Software and Connectivity Technologies
The continuous advancements in software and connectivity technologies present significant opportunities for the Automotive Hypervisor market. The evolution of high-speed networks, enhanced processing capabilities, and improved security measures enable the seamless integration and efficient management of diverse applications and operating systems. These technological advancements open doors for innovative features, improved user experiences, and the potential for over-the-air updates and services, further driving the demand for automotive hypervisors.
Automotive Hypervisor Market Segment Overview
By Vehicle Type
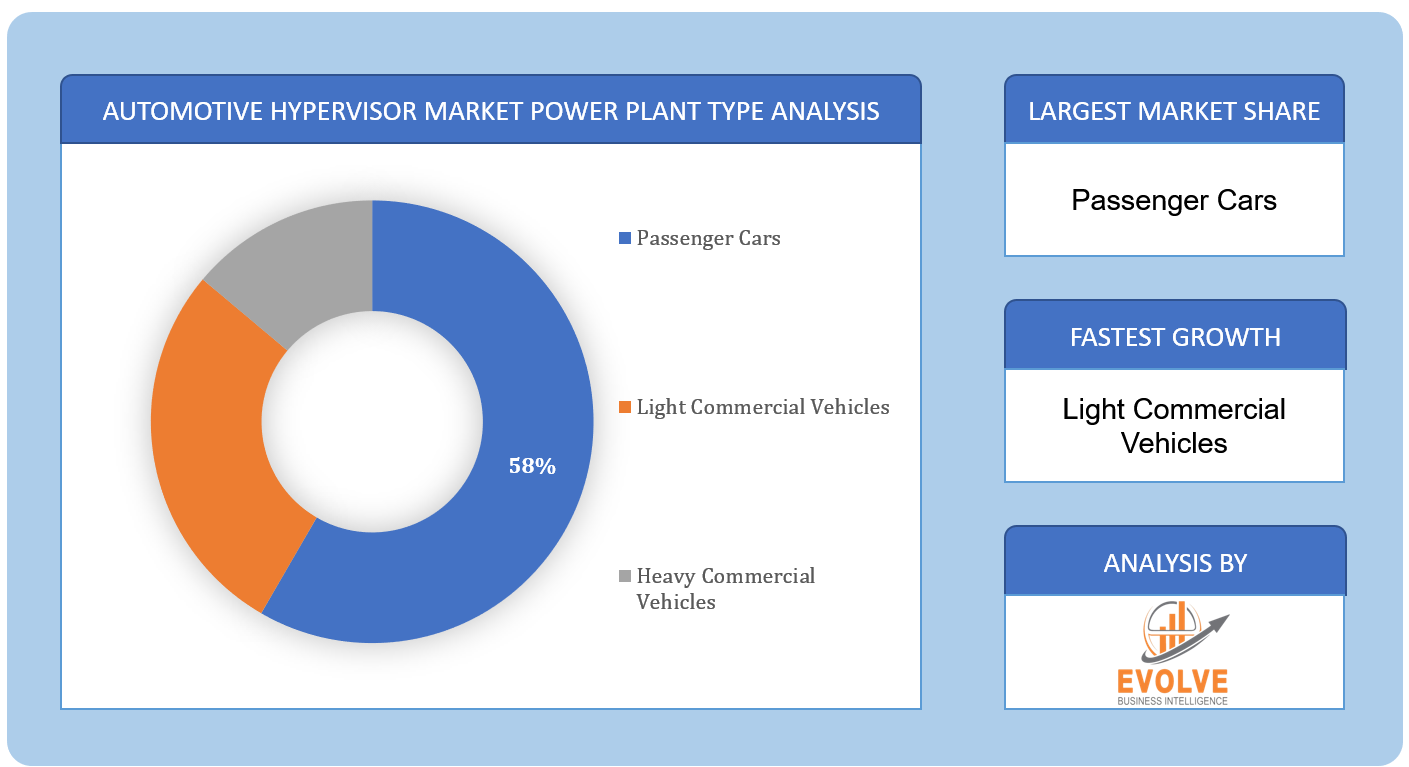 Based on the Vehicle Type, the market is segmented based on Passenger Cars, Light Commercial Vehicles, and Heavy Commercial Vehicles. The Passenger Cars segment was projected to hold the largest market share in the Automotive Hypervisor market. This can be attributed to several factors. Firstly, the increasing demand for advanced infotainment systems, driver assistance features, and connected services in passenger cars has driven the need for robust software platforms like automotive hypervisors. These hypervisors enable the integration of various applications and operating systems, providing a seamless and enhanced user experience. Additionally, the growing popularity of electric and autonomous passenger cars has further propelled the demand for automotive hypervisors, as these vehicles require sophisticated software management for efficient operation and safety.
By Mode of Operation
Based on the Mode of Operation, the market has been divided into Autonomous vehicles, Semi-autonomous vehicles. The Autonomous Vehicle segment is expected to hold the largest market share in the Market. The rapid advancement of autonomous driving technology has led to the emergence of self-driving vehicles that rely on advanced software platforms such as automotive hypervisors. These hypervisors play a critical role in managing and coordinating the complex software systems required for autonomous driving, including sensor fusion, perception algorithms, decision-making processes, and control systems.
By End-User
Based on End-User, the market has been divided into Economy, Mid-priced, and Luxury. The Mid-priced segment is projected to experience significant growth in the Automotive Hypervisor market. The increasing consumer demand for advanced features and technologies in mid-priced vehicles has fueled the need for automotive hypervisors. As customers seek enhanced infotainment systems, driver assistance features, and connectivity options, automakers in the mid-priced segment are integrating sophisticated software platforms like hypervisors to meet these expectations.
Global Automotive Hypervisor Market Regional Analysis
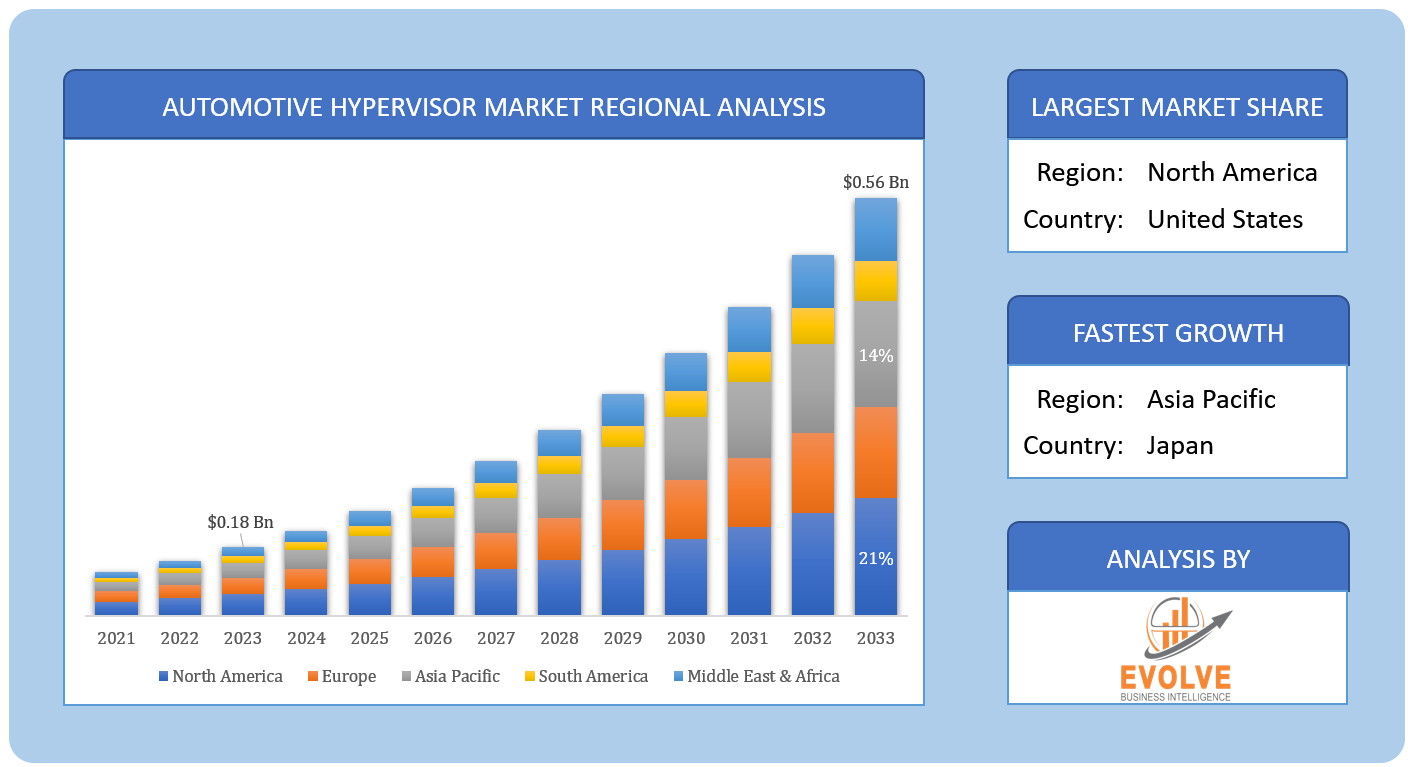
Based on region, the market has been divided into North America, Europe, Asia-Pacific, the Middle East & Africa, and Latin America. The area of North America is anticipated to dominate the market for the usage of Automotive Hypervisor, followed by those in Asia-Pacific and Europe.
North America Market
North America has consistently maintained a significant market share in the Automotive Hypervisor market. This can be attributed to several factors. North America is home to several major automotive manufacturers and technology companies, which have been at the forefront of innovation in the automotive industry. These companies have been early adopters and pioneers in implementing automotive hypervisors to enable advanced functionalities and meet the demands of connected and autonomous vehicles. North America has a strong consumer base that values technology and advanced features in its vehicles, driving the demand for automotive hypervisors. The region’s mature automotive market, combined with a high disposable income and technological infrastructure, has created a conducive environment for the growth of the Automotive Hypervisor market.
Asia Pacific Market
The Automotive Hypervisor industry in the Asia-Pacific region has been witnessing remarkable growth. Several factors contribute to this trend. Firstly, the Asia-Pacific region is a key hub for automotive manufacturing, with countries like China, Japan, and South Korea being major players in the global automotive industry. The region’s robust automotive market and increasing demand for connected and autonomous vehicles have driven the adoption of automotive hypervisors to enable advanced features and functionalities. Secondly, the rapid technological advancements in the region, including the development of high-speed networks, AI capabilities, and IoT infrastructure, provide a strong foundation for the implementation of automotive hypervisors. Additionally, the increasing disposable income and urbanization in countries within the Asia-Pacific region have led to a growing demand for advanced vehicles with enhanced software systems, creating a favorable market for automotive hypervisors.
Competitive Landscape
The competitive landscape includes key players (tier 1, tier 2, and local) having a presence across the globe. Companies such as Continental, Renesas Electronics Corporation, NXP Semiconductor, Wind River System Inc, and Green Hills Software are some of the leading players in the global Automotive Hypervisor Industry. These players have adopted partnership, acquisition, expansion, and new product development, among others as their key strategies.
Key Market Players:
- Continental
- Renesas Electronics Corporation
- NXP Semiconductor
- Wind River System Inc
- Green Hills Software
- Sasken Technologies Ltd
- Mentor Graphics Corporation
- SYSGO AG
- Vector Informatik
- Visteon Corporation
Key development:
In April 2022, Renesas Electronics Corporation unveiled a comprehensive automotive ECU Virtualization Platform, allowing designers to seamlessly integrate multiple applications into a single Electronic Control Unit (ECU) while ensuring their secure and isolated operation. This innovative solution empowers customers to embrace new electrical-electronic (E/E) architectures by leveraging MCU-based zone ECUs that support the consolidation of multiple logical ECUs onto a single physical ECU.
Scope of the Report
Global Automotive Hypervisor Market, by Vehicle Type
- Passenger Cars
- Light Commercial Vehicles
- Heavy Commercial Vehicles
Global Automotive Hypervisor Market, by Mode of Operation
- Autonomous Vehicle
- Semi-autonomous Vehicle
Global Automotive Hypervisor Market, by End-User
- Economy
- Mid-priced
- Luxury
Global Automotive Hypervisor Market, by Region
- North America
- US
- Canada
- Mexico
- Europe
- UK
- Germany
- France
- Italy
- Spain
- Benelux
- Nordic
- Rest of Europe
- Asia Pacific
- China
- Japan
- South Korea
- Indonesia
- Austalia
- Malaysia
- India
- Rest of Asia Pacific
- South America
- Brazil
- Argentina
- Rest of South America
- Middle East & Africa
- Saudi Arabia
- UAE
- Egypt
- South Africa
- Rest of Middle East & Africa
| Parameters | Indicators |
|---|---|
| Market Size | 2033: $0.56 Billion |
| CAGR | 31.47% CAGR (2023-2033) |
| Base year | 2022 |
| Forecast Period | 2023-2033 |
| Historical Data | 2021 |
| Report Coverage | Revenue Forecast, Competitive Landscape, Growth Factors, and Trends |
| Key Segmentations | Vehicle Type, Mode of Operation, End-User |
| Geographies Covered | North America, Europe, Asia-Pacific, Latin America, Middle East, Africa |
| Key Vendors | Continental, Renesas Electronics Corporation, NXP Semiconductor, Wind River System Inc, Green Hills Software, Sasken Technologies Ltd, Mentor Graphics Corporation, SYSGO AG, Vector Informatik, Visteon Corporation |
| Key Market Opportunities | • Advancements in Vehicle Connectivity and Software Technologies |
| Key Market Drivers | • Increasing Adoption of Connected and Autonomous Vehicles |
REPORT CONTENT BRIEF:
- High-level analysis of the current and future Automotive Hypervisor Industry trends and opportunities
- Detailed analysis of current market drivers, restraining factors, and opportunities analysis in the future
- Historical market size for the year 2021, and forecast from 2023 to 2033
- Automotive Hypervisor market share analysis for each segment
- Competitor analysis with a comprehensive insight into its product segment, financial strength, and strategies adopted.
- Identifies key strategies adopted by the key players including new product development, mergers and acquisitions, joint ventures, collaborations, and partnerships.
- To identify and understand the various factors involved in the global Automotive Hypervisor market affected by the pandemic
- To provide year-on-year growth from 2022 to 2033
- To provide short-term, long-term, and overall CAGR comparison from 2022 to 2033.
- Provide Total Addressable Market (TAM) for the Global Automotive Hypervisor Market.
Press Release

Global Pharmaceutical Manufacturing Market to Reach $1.38 Trillion by 2035 with 7.35% CAGR, New Research Shows
The Global Mammography Market Is Estimated To Record a CAGR of Around 10.29% During The Forecast Period
Glue Stick Market to Reach USD 2.35 Billion by 2034
Podiatry Service Market to Reach USD 11.88 Billion by 2034
Microfluidics Technology Market to Reach USD 32.58 Billion by 2034
Ferric Chloride Market to Reach USD 10.65 Billion by 2034
Family Practice EMR Software Market to Reach USD 21.52 Billion by 2034
Electric Hairbrush Market to Reach USD 15.95 Billion by 2034
Daily Bamboo Products Market to Reach USD 143.52 Billion by 2034
Cross-border E-commerce Logistics Market to Reach USD 112.65 Billion by 2034
Frequently Asked Questions (FAQ)
The study period of the global Automotive Hypervisor market is 2022- 2033
The global Automotive Hypervisor market is growing at a CAGR of ~47% over the next 10 years
Asia Pacific is expected to register the highest CAGR during 2023-2033
North America holds the largest share in 2022
Continental, Renesas Electronics Corporation, NXP Semiconductor, Wind River System Inc, Green Hills Software, Sasken Technologies Ltd, Mentor Graphics Corporation, SYSGO AG, Vector Informatik, and Visteon Corporation are the major companies operating in the Automotive Hypervisor
Yes, we offer 16 hours of analyst support to solve the queries
Yes, we do provide regional as well as country-level reports. Other than this we also provide a sectional report. Please get in contact with our sales representatives.
Table of Content
CHAPTER 1. Executive Summary CHAPTER 2. Scope of the Study 2.1. Market Definition 2.2. Market Scope & Segmentation 2.2.1. Objective of Report CHAPTER 3. Evolve BI Methodology 3.1. Data Collection & Validation Approach 3.2. Market Size Estimation and Forecast CHAPTER 4. Exclusive Analysis 4.1. Market Opportunity Score 4.1.1. Vehicle Type Segement – Market Opportunity Score 4.1.2. Mode of Operation Segment – Market Opportunity Score 4.1.3. End-User Segment – Market Opportunity Score 4.2. Key Market Influencing Indicators CHAPTER 5. Market Insights and Trends 5.1. Value Chain Analysis 5.1.1. Raw Material 5.1.2. Manufacturing Process 5.1.3. Distribution Channel 5.1.4. End User 5.2. Porter’s Five Forces Analysis 5.2.1. Bargaining Power of Buyers 5.2.2. Bargaining Power of Suppliers 5.2.3. Threat of New Entrant 5.2.4. Threat of Substitute 5.2.5. Industry Rivalry 5.3. COVID-19 Impact and Post COVID Scenario on Automotive Hypervisor Market 5.3.1. Impact of COVID-19 5.3.2. Government Support and Industry Revival Policies 5.3.3. Measures Taken by Companies to Mitigate Negative Impact 5.3.4. Post COVID Trend CHAPTER 6. MArket Dynamics 6.1. Introduction 6.2. Drivers 6.2.1. Driver 1 6.2.2. Driver 2 6.2.3. Driver 3 6.3. Restraints 6.3.1. Restraint 1 6.3.2. Restraint 2 6.4. Opportunity 6.4.1. Opportunity 1 CHAPTER 7. Global Automotive Hypervisor Market, By Vehicle Type 7.1. Introduction 7.1.1. Passenger Cars 7.1.2. Light Commercial Vehicles 7.1.3. Heavy Commercial Vehicles CHAPTER 8. Global Automotive Hypervisor Market, By Mode of Operation 8.1. Introduction 8.1.1. Autonomous Vehicle 8.1.2. Semi-autonomous Vehicle CHAPTER 9. Global Automotive Hypervisor Market, By End-User 9.1. Introduction 9.1.1. Economy 9.1.2. Mid-priced 9.1.3. Luxury CHAPTER 10. Global Automotive Hypervisor Market, By Region 10.1. Introduction 10.2. NORTH AMERICA 10.2.1. North America: Market Size and Forecast, By Country, 2023 – 2033 ($ Million) 10.2.2. North America: Market Size and Forecast, By Vehicle Type, 2023 – 2033 ($ Million) 10.2.3. North America: Market Size and Forecast, By Mode of Operation, 2023 – 2033 ($ Million) 10.2.4. North America: Market Size and Forecast, By End-User, 2023 – 2033 ($ Million) 10.2.5. US 10.2.5.1. US: Market Size and Forecast, By Vehicle Type, 2023 – 2033 ($ Million) 10.2.5.2. US: Market Size and Forecast, By Mode of Operation, 2023 – 2033 ($ Million) 10.2.5.3. US: Market Size and Forecast, By End-User, 2023 – 2033 ($ Million) 10.2.6. CANADA 10.2.6.1. Canada: Market Size and Forecast, By Vehicle Type, 2023 – 2033 ($ Million) 10.2.6.2. Canada: Market Size and Forecast, By Mode of Operation, 2023 – 2033 ($ Million) 10.2.6.3. Canada: Market Size and Forecast, By End-User, 2023 – 2033 ($ Million) 10.2.7. MEXICO 10.2.7.1. Mexico: Market Size and Forecast, By Vehicle Type, 2023 – 2033 ($ Million) 10.2.7.2. Mexico: Market Size and Forecast, By Mode of Operation, 2023 – 2033 ($ Million) 10.2.7.3. Mexico: Market Size and Forecast, By End-User, 2023 – 2033 ($ Million) 10.3. Europe 10.3.1. Europe: Market Size and Forecast, By Country, 2023 – 2033 ($ Million) 10.3.2. Europe: Market Size and Forecast, By Vehicle Type, 2023 – 2033 ($ Million) 10.3.3. Europe: Market Size and Forecast, By Mode of Operation, 2023 – 2033 ($ Million) 10.3.4. Europe: Market Size and Forecast, By End-User, 2023 – 2033 ($ Million) 10.3.5. U.K. 10.3.5.1. U.K.: Market Size and Forecast, By Vehicle Type, 2023 – 2033 ($ Million) 10.3.5.2. U.K.: Market Size and Forecast, By Mode of Operation, 2023 – 2033 ($ Million) 10.3.5.3. U.K.: Market Size and Forecast, By End-User, 2023 – 2033 ($ Million) 10.3.6. GERMANY 10.3.6.1. Germany: Market Size and Forecast, By Vehicle Type, 2023 – 2033 ($ Million) 10.3.6.2. Germany: Market Size and Forecast, By Mode of Operation, 2023 – 2033 ($ Million) 10.3.6.3. Germany: Market Size and Forecast, By End-User, 2023 – 2033 ($ Million) 10.3.7. FRANCE 10.3.7.1. France: Market Size and Forecast, By Vehicle Type, 2023 – 2033 ($ Million) 10.3.7.2. France: Market Size and Forecast, By Mode of Operation, 2023 – 2033 ($ Million) 10.3.7.3. France: Market Size and Forecast, By End-User, 2023 – 2033 ($ Million) 10.3.8. ITALY 10.3.8.1. Italy: Market Size and Forecast, By Vehicle Type, 2023 – 2033 ($ Million) 10.3.8.2. Italy: Market Size and Forecast, By Mode of Operation, 2023 – 2033 ($ Million) 10.3.8.3. Italy: Market Size and Forecast, By End-User, 2023 – 2033 ($ Million) 10.3.9. SPAIN 10.3.9.1. Spain: Market Size and Forecast, By Vehicle Type, 2023 – 2033 ($ Million) 10.3.9.2. Spain: Market Size and Forecast, By Mode of Operation, 2023 – 2033 ($ Million) 10.3.9.3. Spain: Market Size and Forecast, By End-User, 2023 – 2033 ($ Million) 10.3.10. BENELUX 10.3.10.1. BeNeLux: Market Size and Forecast, By Vehicle Type, 2023 – 2033 ($ Million) 10.3.10.2. BeNeLux: Market Size and Forecast, By Mode of Operation, 2023 – 2033 ($ Million) 10.3.10.3. BeNeLux: Market Size and Forecast, By End-User, 2023 – 2033 ($ Million) 10.3.11. RUSSIA 10.3.11.1. Russia: Market Size and Forecast, By Vehicle Type, 2023 – 2033 ($ Million) 10.3.11.2. Russia: Market Size and Forecast, By Mode of Operation, 2023 – 2033 ($ Million) 10.3.11.3. Russia: Market Size and Forecast, By End-User, 2023 – 2033 ($ Million) 10.3.12. REST OF EUROPE 10.3.12.1. Rest of Europe: Market Size and Forecast, By Vehicle Type, 2023 – 2033 ($ Million) 10.3.12.2. Rest of Europe: Market Size and Forecast, By Mode of Operation, 2023 – 2033 ($ Million) 10.3.12.3. Rest of Europe: Market Size and Forecast, By End-User, 2023 – 2033 ($ Million) 10.4. Asia Pacific 10.4.1. Asia Pacific: Market Size and Forecast, By Country, 2023 – 2033 ($ Million) 10.4.2. Asia Pacific: Market Size and Forecast, By Vehicle Type, 2023 – 2033 ($ Million) 10.4.3. Asia Pacific: Market Size and Forecast, By Mode of Operation, 2023 – 2033 ($ Million) 10.4.4. Asia Pacific: Market Size and Forecast, By End-User, 2023 – 2033 ($ Million) 10.4.5. CHINA 10.4.5.1. China: Market Size and Forecast, By Vehicle Type, 2023 – 2033 ($ Million) 10.4.5.2. China: Market Size and Forecast, By Mode of Operation, 2023 – 2033 ($ Million) 10.4.5.3. China: Market Size and Forecast, By End-User, 2023 – 2033 ($ Million) 10.4.6. JAPAN 10.4.6.1. Japan: Market Size and Forecast, By Vehicle Type, 2023 – 2033 ($ Million) 10.4.6.2. Japan: Market Size and Forecast, By Mode of Operation, 2023 – 2033 ($ Million) 10.4.6.3. Japan: Market Size and Forecast, By End-User, 2023 – 2033 ($ Million) 10.4.7. INDIA 10.4.7.1. India: Market Size and Forecast, By Vehicle Type, 2023 – 2033 ($ Million) 10.4.7.2. India: Market Size and Forecast, By Mode of Operation, 2023 – 2033 ($ Million) 10.4.7.3. India: Market Size and Forecast, By End-User, 2023 – 2033 ($ Million) 10.4.8. SOUTH KOREA 10.4.8.1. South Korea: Market Size and Forecast, By Vehicle Type, 2023 – 2033 ($ Million) 10.4.8.2. South Korea: Market Size and Forecast, By Mode of Operation, 2023 – 2033 ($ Million) 10.4.8.3. South Korea: Market Size and Forecast, By End-User, 2023 – 2033 ($ Million) 10.4.9. THAILAND 10.4.9.1. Thailand: Market Size and Forecast, By Vehicle Type, 2023 – 2033 ($ Million) 10.4.9.2. Thailand: Market Size and Forecast, By Mode of Operation, 2023 – 2033 ($ Million) 10.4.9.3. Thailand: Market Size and Forecast, By End-User, 2023 – 2033 ($ Million) 10.4.10. INDONESIA 10.4.10.1. Indonesia: Market Size and Forecast, By Vehicle Type, 2023 – 2033 ($ Million) 10.4.10.2. Indonesia: Market Size and Forecast, By Mode of Operation, 2023 – 2033 ($ Million) 10.4.10.3. Indonesia: Market Size and Forecast, By End-User, 2023 – 2033 ($ Million) 10.4.11. MALAYSIA 10.4.11.1. Malaysia: Market Size and Forecast, By Vehicle Type, 2023 – 2033 ($ Million) 10.4.11.2. Malaysia: Market Size and Forecast, By Mode of Operation, 2023 – 2033 ($ Million) 10.4.11.3. Malaysia: Market Size and Forecast, By End-User, 2023 – 2033 ($ Million) 10.4.12. AUSTRALIA 10.4.12.1. Australia: Market Size and Forecast, By Vehicle Type, 2023 – 2033 ($ Million) 10.4.12.2. Australia: Market Size and Forecast, By Mode of Operation, 2023 – 2033 ($ Million) 10.4.12.3. Australia: Market Size and Forecast, By End-User, 2023 – 2033 ($ Million) 10.4.13. REST FO ASIA PACIFIC 10.4.13.1. Rest fo Asia Pacific: Market Size and Forecast, By Vehicle Type, 2023 – 2033 ($ Million) 10.4.13.2. Rest fo Asia Pacific: Market Size and Forecast, By Mode of Operation, 2023 – 2033 ($ Million) 10.4.13.3. Rest fo Asia Pacific: Market Size and Forecast, By End-User, 2023 – 2033 ($ Million) 10.5. South America 10.5.1. South America: Market Size and Forecast, By Country, 2023 – 2033 ($ Million) 10.5.2. South America: Market Size and Forecast, By Vehicle Type, 2023 – 2033 ($ Million) 10.5.3. South America: Market Size and Forecast, By Mode of Operation, 2023 – 2033 ($ Million) 10.5.4. South America: Market Size and Forecast, By End-User, 2023 – 2033 ($ Million) 10.5.5. BRAZIL 10.5.5.1. Brazil: Market Size and Forecast, By Vehicle Type, 2023 – 2033 ($ Million) 10.5.5.2. Brazil: Market Size and Forecast, By Mode of Operation, 2023 – 2033 ($ Million) 10.5.5.3. Brazil: Market Size and Forecast, By End-User, 2023 – 2033 ($ Million) 10.5.6. ARGENTINA 10.5.6.1. Argentina: Market Size and Forecast, By Vehicle Type, 2023 – 2033 ($ Million) 10.5.6.2. Argentina: Market Size and Forecast, By Mode of Operation, 2023 – 2033 ($ Million) 10.5.6.3. Argentina: Market Size and Forecast, By End-User, 2023 – 2033 ($ Million) 10.5.7. REST OF SOUTH AMERICA 10.5.7.1. Rest of South America: Market Size and Forecast, By Vehicle Type, 2023 – 2033 ($ Million) 10.5.7.2. Rest of South America: Market Size and Forecast, By Mode of Operation, 2023 – 2033 ($ Million) 10.5.7.3. Rest of South America: Market Size and Forecast, By End-User, 2023 – 2033 ($ Million) 10.6. Middle East & Africa 10.6.1. Middle East & Africa: Market Size and Forecast, By Country, 2023 – 2033 ($ Million) 10.6.2. Middle East & Africa: Market Size and Forecast, By Vehicle Type, 2023 – 2033 ($ Million) 10.6.3. Middle East & Africa: Market Size and Forecast, By Mode of Operation, 2023 – 2033 ($ Million) 10.6.4. Middle East & Africa: Market Size and Forecast, By End-User, 2023 – 2033 ($ Million) 10.6.5. SAUDI ARABIA 10.6.5.1. Saudi Arabia: Market Size and Forecast, By Vehicle Type, 2023 – 2033 ($ Million) 10.6.5.2. Saudi Arabia: Market Size and Forecast, By Mode of Operation, 2023 – 2033 ($ Million) 10.6.5.3. Saudi Arabia: Market Size and Forecast, By End-User, 2023 – 2033 ($ Million) 10.6.6. UAE 10.6.6.1. UAE: Market Size and Forecast, By Vehicle Type, 2023 – 2033 ($ Million) 10.6.6.2. UAE: Market Size and Forecast, By Mode of Operation, 2023 – 2033 ($ Million) 10.6.6.3. UAE: Market Size and Forecast, By End-User, 2023 – 2033 ($ Million) 10.6.7. EGYPT 10.6.7.1. Egypt: Market Size and Forecast, By Vehicle Type, 2023 – 2033 ($ Million) 10.6.7.2. Egypt: Market Size and Forecast, By Mode of Operation, 2023 – 2033 ($ Million) 10.6.7.3. Egypt: Market Size and Forecast, By End-User, 2023 – 2033 ($ Million) 10.6.8. SOUTH AFRICA 10.6.8.1. South Africa: Market Size and Forecast, By Vehicle Type, 2023 – 2033 ($ Million) 10.6.8.2. South Africa: Market Size and Forecast, By Mode of Operation, 2023 – 2033 ($ Million) 10.6.8.3. South Africa: Market Size and Forecast, By End-User, 2023 – 2033 ($ Million) 10.6.9. REST OF MIDDLE EAST & AFRICA 10.6.9.1. Rest of Middle East & Africa: Market Size and Forecast, By Vehicle Type, 2023 – 2033 ($ Million) 10.6.9.2. Rest of Middle East & Africa: Market Size and Forecast, By Mode of Operation, 2023 – 2033 ($ Million) 10.6.9.3. Rest of Middle East & Africa: Market Size and Forecast, By End-User, 2023 – 2033 ($ Million) CHAPTER 12. Competitive Landscape 12.1. Competitior Benchmarking 2023 12.2. Market Share Analysis 12.3. Key Developments Analysis By Top 5 Companies 12.4. Market Share Acquisition Strategies: Analysis of Key Approaches Employed by Top Players CHAPTER 13. Company Profiles 13.1. Continental 13.1.1. Business Overview 13.1.2. Financial Analysis 13.1.2.1. Business Segment Revenue, 2020, 2021, 2022, $ Million 13.1.2.2. Geographic Revenue Mix, 2022 (% Share) 13.1.3. Product Portfolio 13.1.4. Recent Development and Strategies Adopted 13.1.5. SWOT Analysis 13.2. Renesas Electronics Corporation 13.3. NXP Semiconductor 13.4. Wind River System Inc 13.5. Green Hills Software 13.6. Sasken Technologies Ltd 13.7. Mentor Graphics Corporation 13.8. SYSGO AG 13.9. Vector Informatik 13.10. Visteon Corporation
Connect to Analyst
Research Methodology

Our Most Viewed Report and gain instant expertise

Advanced Gear Shifter System Market Analysis and Global Forecast 2023-2033
Air Suspension Market Analysis and Global Forecast 2020-2027

Automotive Lighting Market Analysis and Global Forecast 2023-2033
Cold Chain Market Analysis and Global Forecast 2023-2033


