
Aquaponics Market Analysis and Global Forecast 2023-2033
Price range: $ 1,390.00 through $ 5,520.00
Aquaponics Market Research Report: Information By Growing System (Media Filled Beds, Nutrient Film Technique (NFT), Raft or Deep Water Culture (DWC), By Facility Type (Poly or Glass Greenhouses, Indoor Vertical Farms, Other), By Fish Type (Tilapia, Catfish, Carp, Trout, Ornamental Fish, Other), and by Region — Forecast till 2033
Aquaponics Market Overview
The Aquaponics Market size accounted for USD 1.08 Billion in 2023 and is estimated to account for 1.98 Billion in 2024. The Market is expected to reach USD 3.54 Billion by 2034 growing at a compound annual growth rate (CAGR) of 9.32% from 2024 to 2034. The Aquaponics Market refers to the industry focused on integrated farming systems that combine aquaculture (fish farming) and hydroponics (soilless plant cultivation) in a symbiotic environment. In this system, fish waste provides organic nutrients for plants, while the plants help purify the water, creating a sustainable and self-sufficient ecosystem.
The aquaponics market is experiencing significant growth, driven by a confluence of factors related to sustainability, food security, and consumer demand. the aquaponics market is poised for continued expansion as the world seeks more sustainable and efficient food production methods.
Global Aquaponics Market Synopsis
 Aquaponics Market Dynamics

The major factors that have impacted the growth of Aquaponics Market are as follows:
Drivers:
Ø Growing Demand for Organic and Sustainable Food
Consumers are shifting towards chemical-free, organic, and non-GMO food products. Aquaponics provides natural fertilizers from fish waste, eliminating the need for synthetic fertilizers or pesticides. The rise in health-conscious consumers is driving demand for fresh, nutrient-rich vegetables and fish. Increasing global population and urbanization are putting pressure on conventional agriculture. Climate change and unpredictable weather patterns are affecting traditional farming, making controlled environment farming like aquaponics more attractive and governments and organizations are investing in urban and indoor farming solutions to ensure year-round food production.
Restraint:
- High Initial Investment and Setup Costs
Setting up an aquaponics system requires significant capital for tanks, pumps, filtration systems, grow beds, and lighting. Commercial-scale systems can be expensive, making it less accessible for small farmers and startups and High costs of land, greenhouse infrastructure, and automation further add to the financial burden. Aquaponics involves a complex balance between fish, bacteria, and plants. Operators must understand water chemistry, fish health, nutrient cycles, and system maintenance and Lack of proper training and expertise can lead to system failures and reduced productivity.
Opportunity:
⮚ Expansion of Organic and Sustainable Farming
Rising consumer demand for organic, pesticide-free, and non-GMO food is creating new market opportunities for aquaponics farms. The global organic food industry is expanding, and aquaponics aligns well with sustainability trends. The adoption of IoT-based sensors, AI-driven monitoring, and automation can optimize water quality, nutrient levels, and fish health. AI-powered predictive analytics can help farmers maximize yield and efficiency and automated feeding and water recirculation systems can reduce labor costs and improve scalability.
Aquaponics Market Segment Overview
By Growing System
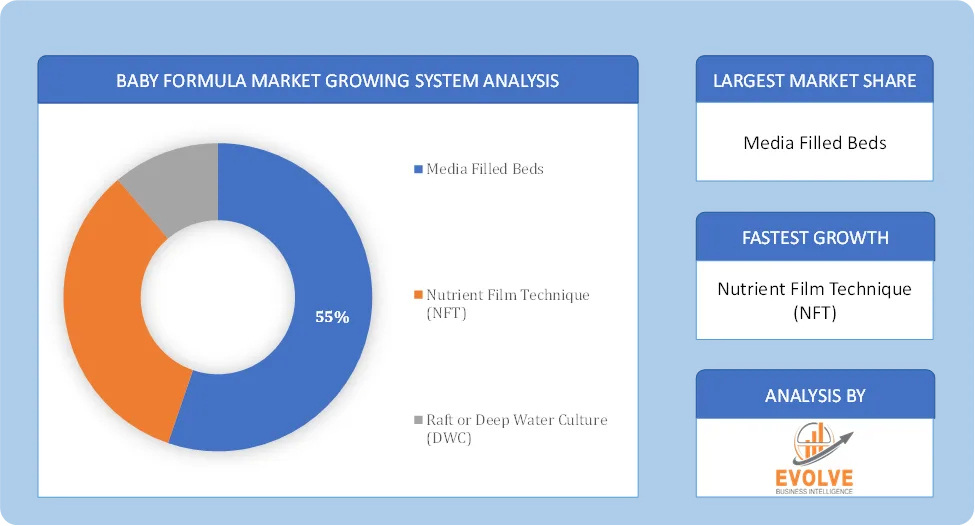 Based on Growing System, the market is segmented based on Media Filled Beds, Nutrient Film Technique (NFT), Raft or Deep Water Culture (DWC). Media-filled beds segment dominant the market. Media-filled beds are popular and widely used in Aquaponics systems due to their proven effectiveness, versatility, and affordability. They provide a stable environment for plant growth, support a wide range of plant types, and act as a biofilter for nutrient conversion. These factors contribute to their dominance in the market and make them a preferred choice for both commercial and home-based Aquaponics setups.
By Facility Type
Based on Facility Type, the market segment has been divided into the Poly or Glass Greenhouses, Indoor Vertical Farms, Other. Indoor Vertical Farms segment dominant the market. Indoor vertical farms maximize space utilization by vertically stacking the growing areas, allowing for high-density cultivation. This makes it particularly suitable for urban areas with limited land availability. The ability to grow plants in a smaller footprint enables efficient use of space and higher crop yields.
By Fish Type
Based on Fish Type, the market segment has been divided into the Tilapia, Catfish, Carp, Trout, Ornamental Fish and Other. The Ornamental Fish dominant the market. The demand for ornamental fish, including tropical and exotic species, has been steadily growing. Ornamental fish are popular as pets and decorative elements in homes, offices, and public spaces. As consumer interest in aquaria and aquarium-related hobbies continues to rise, the demand for a diverse range of ornamental fish species is expected to increase, driving the growth of the segment.
Global Aquaponics Market Regional Analysis
Based on region, the global Aquaponics Market has been divided into North America, Europe, Asia-Pacific, the Middle East & Africa, and Latin America. North America is projected to dominate the use of the Aquaponics Market followed by the Asia-Pacific and Europe regions.
North America Global Aquaponics Market

North America holds a dominant position in the Aquaponics Market. This is driven by a strong focus on sustainable agriculture, widespread consumer demand for organic produce, and significant technological advancements and Increasing adoption of controlled environment agriculture and has Strong presence of commercial aquaponics farms, urban agriculture projects, and research institutions.
Asia-Pacific Global Aquaponics Market
The Asia-Pacific region has indeed emerged as the fastest-growing market for the Aquaponics Market industry. Government initiatives promoting sustainable agriculture in countries like India, China, and Southeast Asian nations. Rising demand for resource-efficient farming practices and growing concerns about food security and Rising demand for fish & organic vegetables in densely populated countries.
Competitive Landscape
The global Aquaponics Market is highly competitive, with numerous players offering a wide range of software solutions. The competitive landscape is characterized by the presence of established companies, as well as emerging startups and niche players. To increase their market position and attract a wide consumer base, the businesses are employing various strategies, such as product launches, and strategic alliances.
Prominent Players:
- Nelson and Pade Inc
- Pentair Aquatic Eco-Systems Inc
- Urban Farming
- Greenlife Aquaponics
- Aquaponics USA
- Aquaponic Lynx
- The Aquaponic Source
- Portable Farms Aquaponics Systems
- ECF Farmsystems GmbH
- Green Acre Aquaponics.
Scope of the Report
Global Aquaponics Market, by Growing System
- Media Filled Beds
- Nutrient Film Technique (NFT)
- Raft or Deep Water Culture (DWC)
Global Aquaponics Market, by Facility Type
- Poly or Glass Greenhouses
- Indoor Vertical Farms
- Other
Global Aquaponics Market, by Fish Type
- Tilapia
- Catfish
- Carp
- Trout
- Ornamental Fish
- Others
Global Aquaponics Market, by Region
- North America
- US
- Canada
- Mexico
- Europe
- UK
- Germany
- France
- Italy
- Spain
- Benelux
- Nordic
- Rest of Europe
- Asia Pacific
- China
- Japan
- South Korea
- Indonesia
- Austalia
- Malaysia
- India
- Rest of Asia Pacific
- South America
- Brazil
- Argentina
- Rest of SouthAmerica
- Middle East &Africa
- Saudi Arabia
- UAE
- Egypt
- SouthAfrica
- Rest of Middle East & Africa
| Parameters | Indicators |
|---|---|
| Market Size | 2033: USD 3.54 Billion |
| CAGR (2023-2033) | 9.32% |
| Base year | 2022 |
| Forecast Period | 2023-2033 |
| Historical Data | 2021 (2017 to 2020 On Demand) |
| Report Coverage | Revenue Forecast, Competitive Landscape, Growth Factors, and Trends |
| Key Segmentations | Growing System, Facility Type, Fish Type |
| Geographies Covered | North America, Europe, Asia-Pacific, South America, Middle East, Africa |
| Key Vendors | Nelson and Pade Inc, Pentair Aquatic Eco-Systems Inc, Urban Farming, Greenlife Aquaponics, Aquaponics USA, Aquaponic Lynx, The Aquaponic Source, Portable Farms Aquaponics Systems, ECF Farmsystems GmbH and Green Acre Aquaponics. |
| Key Market Opportunities | · Expansion of Organic and Sustainable Farming |
| Key Market Drivers | · Growing Demand for Organic and Sustainable Food · Rising Global Food Security Concerns |
REPORT CONTENT BRIEF:
- High-level analysis of the current and future Aquaponics Market trends and opportunities
- Detailed analysis of current market drivers, restraining factors, and opportunities in the future
- Aquaponics Market historical market size for the year 2021, and forecast from 2023 to 2033
- Aquaponics Market share analysis at each product level
- Competitor analysis with detailed insight into its product segment, Government & Defense strength, and strategies adopted.
- Identifies key strategies adopted including product launches and developments, mergers and acquisitions, joint ventures, collaborations, and partnerships as well as funding taken and investment done, among others.
- To identify and understand the various factors involved in the global Aquaponics Market affected by the pandemic
- To provide a detailed insight into the major companies operating in the market. The profiling will include the Government & Defense health of the company’s past 2-3 years with segmental and regional revenue breakup, product offering, recent developments, SWOT analysis, and key strategies.
Frequently Asked Questions (FAQ)
What is the growth rate of the global Aquaponics Market?
The global Aquaponics Market is growing at a CAGR of 9.32% over the next 10 years
Which region has the highest growth rate in the market of Aquaponics Market?
Asia Pacific is expected to register the highest CAGR during 2023-2033
Which region has the largest share of the global Aquaponics Market?
North America holds the largest share in 2022
Who are the key players in the global Aquaponics Market?
Nelson and Pade Inc, Pentair Aquatic Eco-Systems Inc, Urban Farming, Greenlife Aquaponics, Aquaponics USA, Aquaponic Lynx, The Aquaponic Source, Portable Farms Aquaponics Systems, ECF Farmsystems GmbH and Green Acre Aquaponics. are the major companies operating in the market.
Do you offer Post Sale Support?
Yes, we offer 16 hours of analyst support to solve the queries
Do you sell particular sections of a report?
Yes, we provide regional as well as country-level reports. Other than this we also provide a sectional report. Please get in contact with our sales representatives.
Press Release

Global Pharmaceutical Manufacturing Market to Reach $1.38 Trillion by 2035 with 7.35% CAGR, New Research Shows
The Global Mammography Market Is Estimated To Record a CAGR of Around 10.29% During The Forecast Period
Glue Stick Market to Reach USD 2.35 Billion by 2034
Podiatry Service Market to Reach USD 11.88 Billion by 2034
Microfluidics Technology Market to Reach USD 32.58 Billion by 2034
Ferric Chloride Market to Reach USD 10.65 Billion by 2034
Family Practice EMR Software Market to Reach USD 21.52 Billion by 2034
Electric Hairbrush Market to Reach USD 15.95 Billion by 2034
Daily Bamboo Products Market to Reach USD 143.52 Billion by 2034
Cross-border E-commerce Logistics Market to Reach USD 112.65 Billion by 2034
Table of Content
CHAPTER 1. Executive Summary CHAPTER 2. Scope of the Study 2.1. Market Definition 2.2. Market Scope & Segmentation 2.2.1. Objective of Report CHAPTER 3. Evolve BI Methodology 3.1. Data Collection & Validation Approach 3.2. Market Size Estimation and Forecast CHAPTER 4. Exclusive Analysis 4.1. Market Opportunity Score 4.1.1. Growing System Segement – Market Opportunity Score 4.1.2. Facility Type Segment – Market Opportunity Score 4.1.3. Fish Type Segment – Market Opportunity Score 4.2. Key Market Influencing Indicators CHAPTER 5. Market Insights and Trends 5.1. Value Chain Analysis 5.1.1. Raw Material 5.1.2. Manufacturing Process 5.1.3. Distribution Channel 5.1.4. End User 5.2. Porter’s Five Forces Analysis 5.2.1. Bargaining Power of Buyers 5.2.2. Bargaining Power of Suppliers 5.2.3. Threat of New Entrant 5.2.4. Threat of Substitute 5.2.5. Industry Rivalry 5.3. COVID-19 Impact and Post COVID Scenario on Aquaponics Market 5.3.1. Impact of COVID-19 5.3.2. Government Support and Industry Revival Policies 5.3.3. Measures Taken by Companies to Mitigate Negative Impact 5.3.4. Post COVID Trend CHAPTER 6. Market Dynamics 6.1. Introduction 6.2. Drivers 6.2.1. Driver 1 6.2.2. Driver 2 6.2.3. Driver 3 6.3. Restraints 6.3.1. Restraint 1 6.3.2. Restraint 2 6.4. Opportunity 6.4.1. Opportunity 1 CHAPTER 7. Aquaponics Market, By Growing System 7.1. Introduction 7.1.1. Media Filled Beds 7.1.2. Nutrient Film Technique (NFT) 7.1.3 Raft or Deep Water Culture (DWC) CHAPTER 8 Aquaponics Market, By Facility 8.1. Introduction 8.1.1. Poly or Glass Greenhouses 8.1.2. Indoor Vertical Farms 8.1.3. Other CHAPTER 9. Aquaponics Market, By Fish Type 9.1. Introduction 9.1.1. Tilapia 9.1.2. Catfish 9.1.3. Carp 9.1.4. Trout 9.1.5. Ornamental Fish 9.1.6. Other CHAPTER 10. Aquaponics Market, By Region 10.1. Introduction 10.2. NORTH AMERICA 10.2.1. North America: Market Size and Forecast, By Country, 2024 – 2034($ Million) 10.2.2. North America: Market Size and Forecast, By Growing System, 2024 – 2034($ Million) 10.2.3. North America: Market Size and Forecast, By Facility Type, 2024 – 2034($ Million) 10.2.4. North America: Market Size and Forecast, By Fish Type, 2024 – 2034($ Million) 10.2.5. US 10.2.5.1. US: Market Size and Forecast, By Growing System, 2024 – 2034($ Million) 10.2.5.2. US: Market Size and Forecast, By Facility Type, 2024 – 2034($ Million) 10.2.5.3. US: Market Size and Forecast, By Fish Type, 2024 – 2034($ Million) 10.2.6. CANADA 10.2.6.1. Canada: Market Size and Forecast, By Growing System, 2024 – 2034($ Million) 10.2.6.2. Canada: Market Size and Forecast, By Facility Type, 2024 – 2034($ Million) 10.2.6.3. Canada: Market Size and Forecast, By Fish Type, 2024 – 2034($ Million) 10.2.7. MEXICO 10.2.7.1. Mexico: Market Size and Forecast, By Growing System, 2024 – 2034($ Million) 10.2.7.2. Mexico: Market Size and Forecast, By Facility Type, 2024 – 2034($ Million) 10.2.7.3. Mexico: Market Size and Forecast, By Fish Type, 2024 – 2034($ Million) 10.3. Europe 10.3.1. Europe: Market Size and Forecast, By Country, 2024 – 2034($ Million) 10.3.2. Europe: Market Size and Forecast, By Growing System, 2024 – 2034($ Million) 10.3.3. Europe: Market Size and Forecast, By Facility Type, 2024 – 2034($ Million) 10.3.4. Europe: Market Size and Forecast, By Fish Type, 2024 – 2034($ Million) 10.3.5. U.K. 10.3.5.1. U.K.: Market Size and Forecast, By Growing System, 2024 – 2034($ Million) 10.3.5.2. U.K.: Market Size and Forecast, By Mode of Transport, 2024 – 2034($ Million) 10.3.5.3. U.K.: Market Size and Forecast, By Fish Type, 2024 – 2034($ Million) 10.3.6. GERMANY 10.3.6.1. Germany: Market Size and Forecast, By Growing System, 2024 – 2034($ Million) 10.3.6.2. Germany: Market Size and Forecast, By Facility Type, 2024 – 2034($ Million) 10.3.6.3. Germany: Market Size and Forecast, By Fish Type, 2024 – 2034($ Million) 10.3.7. FRANCE 10.3.7.1. France: Market Size and Forecast, By Service Type, 2024 – 2034($ Million) 10.3.7.2. France: Market Size and Forecast, By Facility Type, 2024 – 2034($ Million) 10.3.7.3. France: Market Size and Forecast, By Fish Type, 2024 – 2034($ Million) 10.3.8. ITALY 10.3.8.1. Italy: Market Size and Forecast, By Growing System, 2024 – 2034($ Million) 10.3.8.2. Italy: Market Size and Forecast, By Facility Type, 2024 – 2034($ Million) 10.3.8.3. Italy: Market Size and Forecast, By Fish Type, 2024 – 2034($ Million) 10.3.9. SPAIN 10.3.9.1. Spain: Market Size and Forecast, By Growing System, 2024 – 2034($ Million) 10.3.9.2. Spain: Market Size and Forecast, By Facility Type, 2024 – 2034($ Million) 10.3.9.3. Spain: Market Size and Forecast, By Fish Type, 2024 – 2034($ Million) 10.3.10. BENELUX 10.3.10.1. BeNeLux: Market Size and Forecast, By Growing System, 2024 – 2034($ Million) 10.3.10.2. BeNeLux: Market Size and Forecast, By Facility Type, 2024 – 2034($ Million) 10.3.10.3. BeNeLux: Market Size and Forecast, By Fish Type, 2024 – 2034($ Million) 10.3.11. RUSSIA 10.3.11.1. Russia: Market Size and Forecast, By Growing System, 2024 – 2034($ Million) 10.3.11.2. Russia: Market Size and Forecast, By Facility Type, 2024 – 2034($ Million) 10.3.11.3. Russia: Market Size and Forecast, By Fish Type, 2024 – 2034($ Million) 10.3.12. REST OF EUROPE 10.3.12.1. Rest of Europe: Market Size and Forecast, By Growing System, 2024 – 2034($ Million) 10.3.12.2. Rest of Europe: Market Size and Forecast, By Facility Type, 2024 – 2034($ Million) 10.3.12.3. Rest of Europe: Market Size and Forecast, By Fish Type, 2024 – 2034($ Million) 10.4. Asia Pacific 10.4.1. Asia Pacific: Market Size and Forecast, By Country, 2024 – 2034($ Million) 10.4.2. Asia Pacific: Market Size and Forecast, By Growing System, 2024 – 2034($ Million) 10.4.3. Asia Pacific: Market Size and Forecast, By Facility Type, 2024 – 2034($ Million) 10.4.4. Asia Pacific: Market Size and Forecast, By Fish Type, 2024 – 2034($ Million) 10.4.5. CHINA 10.4.5.1. China: Market Size and Forecast, By Growing System, 2024 – 2034($ Million) 10.4.5.2. China: Market Size and Forecast, By Facility Type, 2024 – 2034($ Million) 10.4.5.3. China: Market Size and Forecast, By Fish Type, 2024 – 2034($ Million) 10.4.6. JAPAN 10.4.6.1. Japan: Market Size and Forecast, By Service Type, 2024 – 2034($ Million) 10.4.6.2. Japan: Market Size and Forecast, By Facility Type, 2024 – 2034($ Million) 10.4.6.3. Japan: Market Size and Forecast, By Fish Type, 2024 – 2034($ Million) 10.4.7. INDIA 10.4.7.1. India: Market Size and Forecast, By Growing System, 2024 – 2034($ Million) 10.4.7.2. India: Market Size and Forecast, By Facility Type, 2024 – 2034($ Million) 10.4.7.3. India: Market Size and Forecast, By Fish Type, 2024 – 2034($ Million) 10.4.8. SOUTH KOREA 10.4.8.1. South Korea: Market Size and Forecast, By Growing System, 2024 – 2034($ Million) 10.4.8.2. South Korea: Market Size and Forecast, By Facility Type, 2024 – 2034($ Million) 10.4.8.3. South Korea: Market Size and Forecast, By Fish Type, 2024 – 2034($ Million) 10.4.9. THAILAND 10.4.9.1. Thailand: Market Size and Forecast, By Growing System, 2024 – 2034($ Million) 10.4.9.2. Thailand: Market Size and Forecast, By Facility Type, 2024 – 2034($ Million) 10.4.9.3. Thailand: Market Size and Forecast, By Fish Type, 2024 – 2034($ Million) 10.4.10. INDONESIA 10.4.10.1. Indonesia: Market Size and Forecast, By Growing System, 2024 – 2034($ Million) 10.4.10.2. Indonesia: Market Size and Forecast, By Facility Type, 2024 – 2034($ Million) 10.4.10.3. Indonesia: Market Size and Forecast, By Fish Type, 2024 – 2034($ Million) 10.4.11. MALAYSIA 10.4.11.1. Malaysia: Market Size and Forecast, By Growing System, 2024 – 2034($ Million) 10.4.11.2. Malaysia: Market Size and Forecast, By Facility Type, 2024 – 2034($ Million) 10.4.11.3. Malaysia: Market Size and Forecast, By Fish Type, 2024 – 2034($ Million) 10.4.12. AUSTRALIA 10.4.12.1. Australia: Market Size and Forecast, By Growing System, 2024 – 2034($ Million) 10.4.12.2. Australia: Market Size and Forecast, By Facility Type, 2024 – 2034($ Million) 10.4.12.3. Australia: Market Size and Forecast, By Fish Type, 2024 – 2034($ Million) 10.4.13. REST FO ASIA PACIFIC 10.4.13.1. Rest fo Asia Pacific: Market Size and Forecast, By Growing System, 2024 – 2034($ Million) 10.4.13.2. Rest fo Asia Pacific: Market Size and Forecast, By Facility Type, 2024 – 2034($ Million) 10.4.13.3. Rest fo Asia Pacific: Market Size and Forecast, By Fish Type, 2024 – 2034($ Million) 10.5. South America 10.5.1. South America: Market Size and Forecast, By Country, 2024 – 2034($ Million) 10.5.2. South America: Market Size and Forecast, By Growing System, 2024 – 2034($ Million) 10.5.3. South America: Market Size and Forecast, By System, 2024 – 2034($ Million) 10.5.4. South America: Market Size and Forecast, By Fish Type, 2024 – 2034($ Million) 10.5.5. BRAZIL 10.5.5.1. Brazil: Market Size and Forecast, By Growing System, 2024 – 2034($ Million) 10.5.5.2. Brazil: Market Size and Forecast, By Facility Type, 2024 – 2034($ Million) 10.5.5.3. Brazil: Market Size and Forecast, By Fish Type, 2024 – 2034($ Million) 10.5.6. ARGENTINA 10.5.6.1. Argentina: Market Size and Forecast, By Growing System, 2024 – 2034($ Million) 10.5.6.2. Argentina: Market Size and Forecast, By Facility Type, 2024 – 2034($ Million) 10.5.6.3. Argentina: Market Size and Forecast, By Fish Type, 2024 – 2034($ Million) 10.5.7. REST OF SOUTH AMERICA 10.5.7.1. Rest of South America: Market Size and Forecast, By Growing System, 2024 – 2034($ Million) 10.5.7.2. Rest of South America: Market Size and Forecast, By Facility Type, 2024 – 2034($ Million) 10.5.7.3. Rest of South America: Market Size and Forecast, By Fish Type, 2024 – 2034($ Million) 10.6. Middle East & Africa 10.6.1. Middle East & Africa: Market Size and Forecast, By Country, 2024 – 2034($ Million) 10.6.2. Middle East & Africa: Market Size and Forecast, By Growing System, 2024 – 2034($ Million) 10.6.3. Middle East & Africa: Market Size and Forecast, By Facility Type, 2024 – 2034($ Million) 10.6.4. Middle East & Africa: Market Size and Forecast, By Fish Type, 2024 – 2034($ Million) 10.6.5. SAUDI ARABIA 10.6.5.1. Saudi Arabia: Market Size and Forecast, By Growing System, 2024 – 2034($ Million) 10.6.5.2. Saudi Arabia: Market Size and Forecast, By Facility Type, 2024 – 2034($ Million) 10.6.5.3. Saudi Arabia: Market Size and Forecast, By Fish Type, 2024 – 2034($ Million) 10.6.6. UAE 10.6.6.1. UAE: Market Size and Forecast, By Growing System, 2024 – 2034($ Million) 10.6.6.2. UAE: Market Size and Forecast, By Facility Type, 2024 – 2034($ Million) 10.6.6.3. UAE: Market Size and Forecast, By Fish Type, 2024 – 2034($ Million) 10.6.7. EGYPT 10.6.7.1. Egypt: Market Size and Forecast, By Growing System, 2024 – 2034($ Million) 10.6.7.2. Egypt: Market Size and Forecast, By Facility Type, 2024 – 2034($ Million) 10.6.7.3. Egypt: Market Size and Forecast, By Fish Type, 2024 – 2034($ Million) 10.6.8. SOUTH AFRICA 10.6.8.1. South Africa: Market Size and Forecast, By Growing System, 2024 – 2034($ Million) 10.6.8.2. South Africa: Market Size and Forecast, By Facility Type, 2024 – 2034($ Million) 10.6.8.3. South Africa: Market Size and Forecast, By Fish Type, 2024 – 2034($ Million) 10.6.9. REST OF MIDDLE EAST & AFRICA 10.6.9.1. Rest of Middle East & Africa: Market Size and Forecast, By Growing System, 2024 – 2034($ Million) 10.6.9.2. Rest of Middle East & Africa: Market Size and Forecast, By Facility Type, 2024 – 2034($ Million) 10.6.9.3.Rest of Middle East & Africa: Market Size and Forecast, By Fish Type, 2024 – 2034($ Million) CHAPTER 12. Competitive Landscape 12.1. Competitior Benchmarking 2023- 12.2. Market Share Analysis 12.3. Key Developments Analysis By Top 5 Companies 12.4. Market Share Acquisition Strategies: Analysis of Key Approaches Employed by Top Players CHAPTER 13. Company Profiles 13.1. Nelson and Pade Inc 13.1.1. Hanon Systems 13.1.2. Financial Analysis 13.1.2.1. Business Segment Revenue, 2020, 2021, 2022, $ Million 13.1.2.2. Geographic Revenue Mix, 2022 (% Share) 13.1.3. Product Portfolio 13.1.4. Recent Development and Strategies Adopted 13.1.5. SWOT Analysis 13.2. Pentair Aquatic Eco-Systems Inc 13.3. Urban Farming 13.4. Greenlife Aquaponics 13.5. Aquaponics USA 13.6. Aquaponic Lynx 13.7. The Aquaponic Source 13.8. Portable Farms Aquaponics Systems 13.9 ECF Farmsystems GmbH 13.10 Green Acre Aquaponics. |
Connect to Analyst
Research Methodology

Our Most Viewed Report and gain instant expertise

Automated Guided Vehicles (AGVs) Market Analysis and Global Forecast 2023-2033
Automated Guided Vehicles (AGVs) Market Research Report: By Type (Tow Vehicles, Unit Load Carriers, Pallet Trucks, Assembly Line Vehicles, Forklift Trucks), By Navigation Technology (Laser Guidance, Magnetic Guidance, Inductive Guidance, Optical Tape Guidance, Other), By Application (Transportation, Distribution, Storage, Assembly, Packaging, Waste Handling), By End-User (Automotive, Manufacturing, Food & Beverages, Aerospace, Healthcare, Logistics, Retail, Others), and by Region — Forecast till 2033
Page: 171 Construction Equipment Rental Market Analysis and Global Forecast 2023-2033
Construction Equipment Rental Market Research Report: Information By Product Type (Backhoes, Excavators, Loaders, Crawler Dozers, Cranes, Concrete Pumps, Compactors, Transit Mixers, Concrete Mixers, Others), By Equipment (Earthmoving, Material Handling, Road Building & Concrete), and by Region — Forecast till 2033
Page: 171
Global Corrugated Packaging Market Analysis and Global Forecast 2023-2033

