Press Release
Select category
  • Select category
  • Aerospace & Defense
    • Aircraft Components
    • Aircraft Material
    • Aviation
    • Defense
    • Marine
    • Security
    • Space
    • Technology
  • Agriculture
    • Materials
    • Technology
  • Automotive
    • Automotive Systems
    • Chemical Automotive
    • Component
    • Freight & Logistics
    • Material
    • Technology
    • Transport Mode
    • Utility
    • Vehicle
  • Automotive (CI)
  • Baby Products and supplies
  • BFSI
    • Banking
  • Chemical and Materials
    • Advanced Materials
    • Chemical
    • Coatings and Additives
    • Composites
    • Paints
    • Textile
  • Chemical and Materials (CI)
  • Construction & Manufacturing
    • Agriculture
    • Construction and Improvements
    • Construction Materials
    • Decor
    • Equipment and Machinery
    • Industrial Equipment & Automation
    • Packaging
  • Construction & Manufacturing (CI)
  • Consumer & Goods
    • Baby products and supplies
    • Beauty & Personal Care
    • Consumer
    • Home Products
    • Retail
    • Sports & Fitness
    • Travel
  • Electronics and Semiconductor
    • Communication Equipment
    • Display Technology
    • Electronic Component
    • Electronic Devices
    • Emerging Technologies
    • Security
    • Semiconductor
    • Sensor & Control
    • Technology
  • Electronics and Semiconductor (CI)
  • Energy and Power
    • Conventional Energy
    • Equipment
    • Power
    • Renewable Energy
    • Services
    • Storage and Distribution
    • Technology
    • Utility
  • Energy and Power (CI)
  • Food & Beverage
    • Baby Food
    • Beverages
    • Dairy Products
    • Food Ingredient
    • Food Products
    • Food Services and Hospitality
    • Packaging
    • Processed Food
  • Healthcare
  • Healthcare (CI)
  • Industrial Automation & Equipment
    • Component
  • Information and Communication Technology
    • Communication
    • Data Center
    • Data Center and Networking
    • Emerging Technologies
    • Entertainment Technologies
    • Security
    • Software and Services
    • Technology
  • Information and Communication Technology ICT (CI)
  • Life Science
    • Biotechnology
    • Diagnostics and Biotech
    • Healthcare Equipment
    • Healthcare IT
    • Medical Devices
    • Packaging
    • Pharmaceutical
    • Therapeutic
  • Miscellaneous
    • BFSI
    • Education and Training
  • Uncategorized
Evolve Business Intelligence Evolve Business Intelligence
  • Home
  • About Us
  • Services
  • Market Reports
    • Automotive
      • Component
      • Vehicle
      • Chemical Automotive
      • Technology
      • Freight & Logistics
      • Material
      • Technology
      • Transport Mode
      • Utility
      • Vehicle
    • Chemical and Materials
      • Chemical
      • Advanced Materials
      • Coatings and Additives
      • Composites
      • Paints
      • Textile
    • Aerospace & Defense
      • Marine
      • Security
      • Technology
      • Aircraft Components
      • Aircraft Material
    • Construction & Manufacturing
    • Electronics and Semiconductor
      • Display Technology
      • Electronic Component
      • Electronic Devices
      • Semiconductor
      • Communication Equipment
      • Emerging Technologies
      • Security
      • Sensor & Control
      • Technology
    • Energy and Power
    • Life Science
    • Consumer & Goods
      • Baby products and supplies
      • Beauty & Personal Care
      • Consumer
      • Home Products
    • Information and Communication Technology
      • Emerging Technologies
      • Entertainment Technologies
      • Security
      • Communication
      • Data Center
      • Data Center and Networking
      • Software and Services
      • Technology
  • Competitive Intelligence (CI)
    • Automotive (CI)
    • Chemical and Materials (CI)
    • Construction & Manufacturing (CI)
    • Energy and Power (CI)
    • Electronics and Semiconductor (CI)
    • Healthcare (CI)
    • Information and Communication Technology ICT (CI)
  • Contact Us
Menu
Evolve Business Intelligence Evolve Business Intelligence
Press Release
Automotive Market research
Click to enlarge
Home » Our Report Repository » Airport Electric Vehicle Charging Station Market Analysis and Global Forecast (2023-2033) with COVID Impact Analysis
Energy and Power
AC-DC Power Supply Adapter Market Analysis and Global Forecast (2023-2033) with COVID Impact Analysis $ 3,475.00
Back to products
Energy and Power
Aquaculture Products Market Analysis and Global Forecast (2023-2033) with COVID Impact Analysis $ 3,475.00

Airport Electric Vehicle Charging Station Market Analysis and Global Forecast (2023-2033) with COVID Impact Analysis

$ 3,475.00

Airport Electric Vehicle Charging Station Market Research Report: By Mode of charging (Plug-in charging, Wireless charging), By Charging level (Level 2, Level 3), By Product Type (Standing Type, Wall Mounted Type, Wireless Pad), and by Region — Forecast till 2033

Categories: Aerospace & Defense, Aircraft Components
Share:
  • Description
  • Table of Content
  • Connect to Analyst
  • Research Methodology
Description

Airport Electric Vehicle Charging Station Market Overview

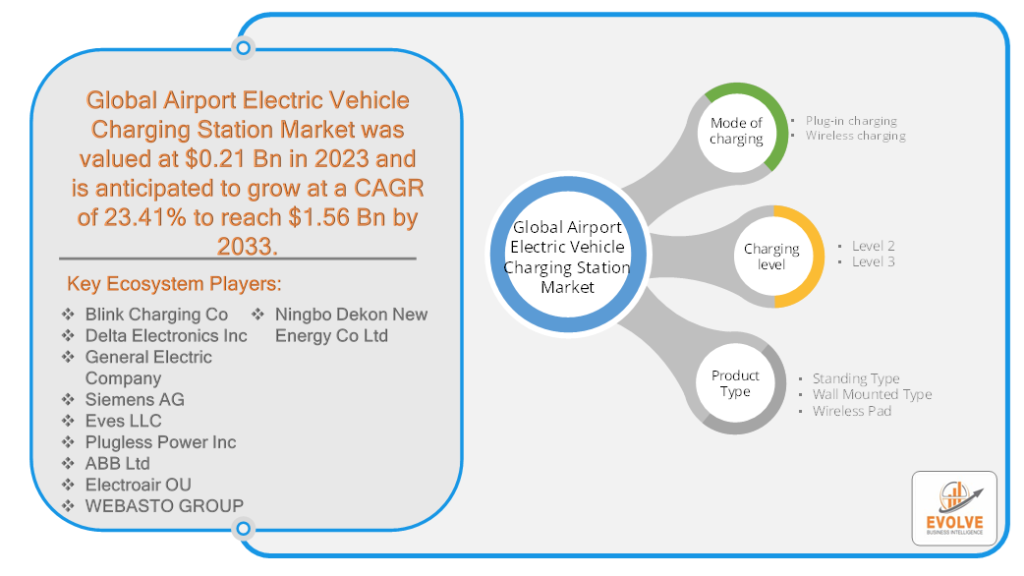
Airport Electric Vehicle Charging Station Market Size is expected to reach USD 1.56 Billion by 2033. The Airport Electric Vehicle Charging Station industry size accounted for USD 0.21 Billion in 2023 and is expected to expand at a compound annual growth rate (CAGR) of 23.41% from 2023 to 2033. An Airport Electric Vehicle Charging Station refers to a specialized infrastructure facility located within or adjacent to an airport that is designed to provide electric vehicle charging services to electric cars and other electric vehicles. These charging stations are equipped with dedicated charging points or stations that enable EV owners to connect their vehicles and recharge their batteries while utilizing airport facilities or during their travel to and from the airport. The charging stations may offer different levels of charging capabilities, including Level 1, Level 2, and sometimes even Level 3 or DC fast charging, to accommodate various electric vehicle models. The purpose of these charging stations is to support the adoption of electric vehicles, promote sustainable transportation options, and contribute to environmental sustainability efforts within the airport ecosystem.

Global Airport Electric Vehicle Charging Station Market Synopsis

COVID-19 Impact Analysis

The Airport Electric Vehicle Charging Station market was significantly affected by the COVID-19 pandemic as airports faced reduced activity, travel restrictions, and lockdown measures. These factors led to a decline in overall usage of electric vehicle charging stations, as passenger traffic decreased and many individuals worked remotely or avoided non-essential travel. Consequently, there was a decrease in demand for airport charging facilities, resulting in lower utilization rates and slower installation of new charging stations. However, with the gradual easing of travel restrictions and global recovery efforts, the market is anticipated to regain momentum. This rebound will be driven by the increasing adoption of electric vehicles and the growing focus on sustainable transportation solutions in the post-pandemic era.

Global Airport Electric Vehicle Charging Station Market Dynamics

The major factors that have impacted the growth of the Airport Electric Vehicle Charging Station are as follows:

Drivers:

⮚      Increasing Adoption of Electric Vehicles

One of the key drivers for the Airport Electric Vehicle Charging Station market is the rising adoption of electric vehicles (EVs) globally. As more individuals and organizations embrace EVs for their transportation needs, the demand for charging infrastructure, including at airports, is expected to grow. The need for convenient and accessible charging solutions at airports will drive the installation and expansion of EV charging stations to cater to the increasing number of EV owners.

Restraint:

  • Limited Availability of Charging Infrastructure

A significant restraint for the Airport Electric Vehicle Charging Station market is the limited availability of charging infrastructure, particularly in certain regions or airports. The installation of charging stations requires significant investment, coordination with utility providers, and space allocation, which can pose challenges for some airports. The lack of charging infrastructure can deter EV owners from choosing airports that do not offer charging facilities, impacting the overall market growth.

Opportunity:

    Government Initiatives and Incentives

Government initiatives and incentives aimed at promoting sustainable transportation and reducing carbon emissions present a significant opportunity for the Airport Electric Vehicle Charging Station market. Many governments across the world are implementing policies, such as funding programs, tax incentives, and regulations that encourage the development of charging infrastructure. Airports can leverage these initiatives and collaborate with government entities to secure funding and support for the installation and expansion of EV charging stations, thereby driving the market growth.

Airport Electric Vehicle Charging Station Market Segment Overview

By Mode of charging

Based on the Mode of charging, the market is segmented based on Plug-in charging, Wireless charging. The Plug-in charging segment was indeed anticipated to hold a significant market share in the Airport Electric Vehicle Charging Station market. This is due to the widespread adoption of plug-in electric vehicles (PEVs) and their compatibility with various charging standards. Plug-in charging stations offer convenient and flexible charging options, allowing EV owners to connect their vehicles to the charging infrastructure using standard charging cables. The popularity of plug-in charging is driven by its ease of use, compatibility with a wide range of electric vehicles, and the ability to charge at different power levels. As the demand for PEVs continues to grow, the plug-in charging segment is expected to maintain its dominance in the Airport Electric Vehicle Charging Station market.

By Charging level

Based on the Charging level, the market has been divided into Level 2, and Level 3. The Level 2 segment is expected to hold the largest market share in the Market. Level 2 charging stations provide a reliable and efficient charging solution for electric vehicles, making them a popular choice among EV owners. With a power output of 240 volts, Level 2 charging stations offer faster charging compared to Level 1 chargers while being more affordable and easier to install than high-power Level 3 DC fast chargers. Additionally, Level 2 charging infrastructure is compatible with a wide range of electric vehicle models, making it a versatile and widely adopted charging option at airports.

By Product Type

Based on Product Type, the market has been divided into Standing Type, Wall Mounted Type, and Wireless Pad. The market is projected to see significant growth in the Wall Mounted Type segment. Wall-mounted charging stations offer several advantages, including space efficiency, easy installation on existing structures, and versatility in terms of deployment locations within airports. These charging stations can be mounted on walls or pillars, saving valuable floor space and providing a more organized charging setup. The scalability and flexibility of wall-mounted charging stations make them suitable for various airport environments, including parking lots, terminals, and other accessible areas.

Global Airport Electric Vehicle Charging Station Market Regional Analysis

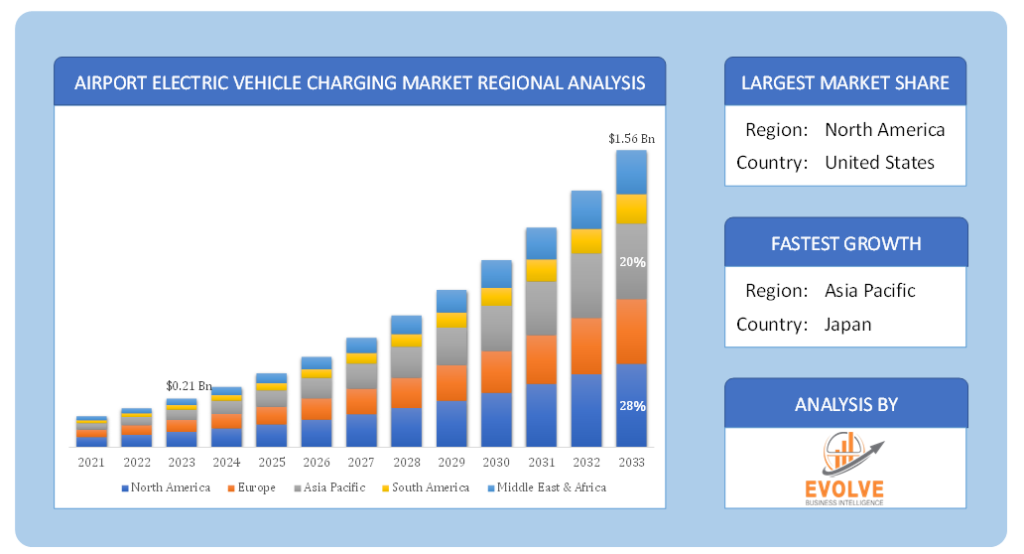
Based on region, the market has been divided into North America, Europe, Asia-Pacific, the Middle East & Africa, and Latin America. The area of North America is anticipated to dominate the market for the usage of Airport Electric Vehicle Charging Stations, followed by those in Asia-Pacific and Europe.
North America Market

North America has traditionally held a substantial market share in the Airport Electric Vehicle Charging Station market. The region has been at the forefront of electric vehicle adoption and has witnessed significant investments in charging infrastructure. Several factors contribute to North America’s market dominance, including supportive government policies, incentives for electric vehicles, and a robust charging infrastructure network. Moreover, North America is home to some of the world’s largest airports, which have been proactive in installing charging stations to cater to the growing number of electric vehicles. The region’s advanced technological capabilities, strong consumer demand for sustainable transportation solutions, and a well-established charging infrastructure ecosystem have all contributed to North America’s significant market share in the Airport Electric Vehicle Charging Station market.

Asia Pacific Market

The Asia-Pacific region has indeed been experiencing a growing compound annual growth rate (CAGR) in the Airport Electric Vehicle Charging Station industry. The region has witnessed a rapid increase in electric vehicle adoption, particularly in countries like China, Japan, and South Korea. This surge in electric vehicle sales has prompted airports in the Asia-Pacific region to invest in and expand their charging infrastructure to meet the rising demand. Government initiatives, favorable policies, and investments in sustainable transportation solutions have further fueled the growth of the Airport Electric Vehicle Charging Station market in the Asia-Pacific region. With a focus on reducing carbon emissions and promoting clean energy, the Asia-Pacific market is expected to continue its positive trajectory, driving the CAGR growth in the Airport Electric Vehicle Charging Station industry.

Competitive Landscape

The competitive landscape includes key players (tier 1, tier 2, and local) having a presence across the globe. Companies such as ABB Ltd, Delta Electronics Inc, General Electric Company, Siemens AG, and Eves are some of the leading players in the global Airport Electric Vehicle Charging Station Industry. These players have adopted partnership, acquisition, expansion, and new product development, among others as their key strategies.

Key Market Players:

  • Blink Charging Co
  • Delta Electronics Inc
  • General Electric Company
  • Siemens AG
  • Eves LLC
  • Plugless Power Inc
  • ABB Ltd
  • Electroair OU
  • WEBASTO GROUP
  • Ningbo Dekon New Energy Co Ltd

Key development:

On May 2023: Siemens eMobility announced the introduction of the latest iteration of VersiCharge AC Series electric vehicle (EV) chargers, designed for both commercial and residential use. This groundbreaking EV charger sets a new industry standard by integrating with building management systems, granting operators the ability to monitor, manage, and make real-time adjustments to the system. The third generation of AC charging, known as VersiCharge, provides convenient tools for power demand adjustment, precise energy usage metering, and enhanced network connectivity for electric vehicle service providers, buildings, and automation systems. The UL/cUL-certified model offers up to 11.5 kW of alternating current (AC) charging power and includes various configurations tailored to multi-family residences, workplaces, and utility applications.

Scope of the Report

Global Airport Electric Vehicle Charging Station Market, by Mode of Charging

  • Plug-in charging
  • Wireless charging

Global Airport Electric Vehicle Charging Station Market, by Charging Level

  • Level 2
  • Level 3

Global Airport Electric Vehicle Charging Station Market, by Product Type

  • Standing Type
  • Wall Mounted Type
  • Wireless Pad

Global Airport Electric Vehicle Charging Station Market, by Region

  • North America
    • US
    • Canada
    • Mexico
  • Europe
    • UK
    • Germany
    • France
    • Italy
    • Spain
    • Benelux
    • Nordic
    • Rest of Europe
  • Asia Pacific
    • China
    • Japan
    • South Korea
    • Indonesia
    • Austalia
    • Malaysia
    • India
    • Rest of Asia Pacific
  • South America
    • Brazil
    • Argentina
    • Rest of South America
  • Middle East & Africa
    • Saudi Arabia
    • UAE
    • Egypt
    • South Africa
    • Rest of Middle East & Africa


Parameters Indicators
Market Size 2033: $1.56 Billion
CAGR 23.41% CAGR (2023-2033)
Base year 2022
Forecast Period 2023-2033
Historical Data 2021
Report Coverage Revenue Forecast, Competitive Landscape, Growth Factors, and Trends
Key Segmentations Mode of charging, Charging level, Product Type
Geographies Covered North America, Europe, Asia-Pacific, Latin America, Middle East, Africa
Key Vendors Blink Charging Co., Delta Electronics Inc, General Electric Company, Siemens AG, Eves LLC, Plugless Power Inc., ABB Ltd, Electroair OU, WEBASTO GROUP, Ningbo Dekon New Energy Co Ltd
Key Market Opportunities Collaborations between airports, government entities, and private sector players to expand charging infrastructure
Technological advancements leading to faster charging speeds and improved charging efficiency
Integration of renewable energy sources in charging infrastructure to promote clean energy usage
Key Market Drivers Increasing adoption of electric vehicles (EVs) globally
Government initiatives and incentives promoting sustainable transportation
Growing demand for convenient and accessible charging infrastructure


REPORT CONTENT BRIEF:

  • High-level analysis of the current and future Airport Electric Vehicle Charging Station Industry trends and opportunities
  • Detailed analysis of current market drivers, restraining factors, and opportunities analysis in the future
  • Historical market size for the year 2021, and forecast from 2023 to 2033
  • Airport Electric Vehicle Charging Station market share analysis for each segment
  • Competitor analysis with a comprehensive insight into its product segment, financial strength, and strategies adopted.
  • Identifies key strategies adopted by the key players including new product development, mergers and acquisitions, joint ventures, collaborations, and partnerships.
  • To identify and understand the various factors involved in the global Airport Electric Vehicle Charging Station market affected by the pandemic
  • To provide year-on-year growth from 2022 to 2033
  • To provide short-term, long-term, and overall CAGR comparison from 2022 to 2033.
  • Provide Total Addressable Market (TAM) for the Global Airport Electric Vehicle Charging Station Market.

Frequently Asked Questions (FAQ)

For more details mail us at

[email protected]

Ask a question / additional requirement

Press Release

  • The Global Double Chamber Injection Devices Market Is Estimated To Record a CAGR of Around 9.99% During The Forecast Period

    The Global Double Chamber Injection Devices Market Is Estimated To Record a CAGR of Around 9.99% During The Forecast Period

    August 26, 2023

  • The Global Flexible Printed Circuit Board Market Is Estimated To Record a CAGR of Around 11.60% During The Forecast Period

    The Global Flexible Printed Circuit Board Market Is Estimated To Record a CAGR of Around 11.60% During The Forecast Period

    August 26, 2023

  • The Global Clinical Biomarkers Market Is Estimated To Record a CAGR of Around 16.7% During The Forecast Period

    The Global Clinical Biomarkers Market Is Estimated To Record a CAGR of Around 16.7% During The Forecast Period

    August 26, 2023

  • The Global Data Center Environmental Monitoring System Market Is Estimated To Record a CAGR of Around 8.45% During The Forecast Period

    The Global Data Center Environmental Monitoring System Market Is Estimated To Record a CAGR of Around 8.45% During The Forecast Period

    August 26, 2023

  • The Global Data Center Networking Market Is Estimated To Record a CAGR of Around 15.55% During The Forecast Period

    The Global Data Center Networking Market Is Estimated To Record a CAGR of Around 15.55% During The Forecast Period

    August 26, 2023

  • The Global Graft Delivery Device Market Is Estimated To Record a CAGR of Around 12.99% During The Forecast Period

    The Global Graft Delivery Device Market Is Estimated To Record a CAGR of Around 12.99% During The Forecast Period

    August 26, 2023

  • The Global HubSpot Consulting and Implementation Market Is Estimated To Record a CAGR of Around 15.23% During The Forecast Period

    The Global HubSpot Consulting and Implementation Market Is Estimated To Record a CAGR of Around 15.23% During The Forecast Period

    August 26, 2023

  • The Global Liquid Skin Protectors Market Is Estimated To Record a CAGR of Around 10.64% During The Forecast Period

    The Global Liquid Skin Protectors Market Is Estimated To Record a CAGR of Around 10.64% During The Forecast Period

    August 26, 2023

  • The Global Lithium-Ion Battery Energy Storage System Market Is Estimated To Record a CAGR of Around 15.5% During The Forecast Period

    The Global Lithium-Ion Battery Energy Storage System Market Is Estimated To Record a CAGR of Around 15.5% During The Forecast Period

    August 26, 2023

  • The Global Machine Safety Market Is Estimated To Record a CAGR of Around 6.9% During The Forecast Period

    The Global Machine Safety Market Is Estimated To Record a CAGR of Around 6.9% During The Forecast Period

    August 26, 2023

1. What is the study period of this market?

  • The study period of the global Airport Electric Vehicle Charging Station market is 2022- 2033

2. What are the 10 Years CAGR (2023 to 2033) of the global Airport Electric Vehicle Charging Station market?

  • The global Airport Electric Vehicle Charging Station market is growing at a CAGR of ~41% over the next 10 years

3. Which region has the highest growth rate in the market of Airport Electric Vehicle Charging Stations?

  • Asia Pacific is expected to register the highest CAGR during 2023-2033

4. Which region accounted for the largest share of the market of Airport Electric Vehicle Charging Station?

  • North America holds the largest share in 2022

5. Major Key Players in the Market of Airport Electric Vehicle Charging Stations?

  • Blink Charging Co., Delta Electronics Inc, General Electric Company, Siemens AG, Eves LLC, Plugless Power Inc., ABB Ltd, Electroair OU, WEBASTO GROUP, Ningbo Dekon New Energy Co Ltd are the major companies operating in the Airport Electric Vehicle Charging Station

6. Do you offer Post Sale Support?

  • Yes, we offer 16 hours of analyst support to solve the queries

7. Do you deliver sections of a report?

Yes, we do provide regional as well as country-level reports. Other than this we also provide a sectional report. Please get in contact with our sales representatives.

Table of Content

Table of Content

CHAPTER 1.                 Executive Summary

CHAPTER 2.                 Scope of the Study

2.1.        Market Definition

2.2.        Market Scope & Segmentation

2.2.1.         Objective of Report

CHAPTER 3.                 Evolve BI Methodology

3.1.        Data Collection & Validation Approach

3.2.        Market Size Estimation and Forecast

CHAPTER 4.                 Exclusive Analysis

4.1.        Market Opportunity Score

4.1.1.         Type Segement – Market Opportunity Score

4.1.2.         Application Segment – Market Opportunity Score

4.1.3.         Vertical Segment – Market Opportunity Score

4.2.        Key Market Influencing Indicators

CHAPTER 5.                 Market Insights and Trends

5.1.        Value Chain Analysis

5.1.1.         Raw Material

5.1.2.         Manufacturing Process

5.1.3.         Distribution Channel

5.1.4.         End User

5.2.        Porter’s Five Forces Analysis

5.2.1.         Bargaining Power of Buyers

5.2.2.         Bargaining Power of Suppliers

5.2.3.         Threat of New Entrant

5.2.4.         Threat of Substitute

5.2.5.         Industry Rivalry

5.3.        COVID-19 Impact and Post COVID Scenario on AC-DC Power Supply Adapter Market

5.3.1.         Impact of COVID-19

5.3.2.         Government Support and Industry Revival Policies

5.3.3.         Measures Taken by Companies to Mitigate Negative Impact

5.3.4.         Post COVID Trend

CHAPTER 6.                 MArket Dynamics

6.1.        Introduction

6.2.        Drivers

6.2.1.         Driver 1

6.2.2.         Driver 2

6.2.3.         Driver 3

6.3.        Restraints

6.3.1.         Restraint 1

6.3.2.         Restraint 2

6.4.        Opportunity

6.4.1.         Opportunity 1

CHAPTER 7.                 Global AC-DC Power Supply Adapter Market, By Type

7.1.        Introduction

7.1.1.         AC-DC Wall Power Adapter

7.1.2.         AC-DC External Plug-in Power Adapter

CHAPTER 8.                 Global AC-DC Power Supply Adapter Market, By Application

8.1.        Introduction

8.1.1.         Home Appliances

8.1.2.         Computer and Laptops

8.1.3.         Mobile Phones and Wearable

8.1.4.         Electronics

8.1.5.         Automotive

8.1.6.         Others

CHAPTER 9.                 Global AC-DC Power Supply Adapter Market, By Vertical

9.1.        Introduction

9.1.1.         Consumer Electronics

9.1.2.         Telecommunications

9.1.3.         Food and Beverages

9.1.4.         Medical and Healthcare

9.1.5.         Military and Aerospace

9.1.6.         Industrial

CHAPTER 10.               Global AC-DC Power Supply Adapter Market, By Region

10.1.     Introduction

10.2.     NORTH AMERICA

10.2.1.      North America: Market Size and Forecast, By Country, 2023 – 2033 ($ Million)

10.2.2.      North America: Market Size and Forecast, By Type, 2023 – 2033 ($ Million)

10.2.3.      North America: Market Size and Forecast, By Application, 2023 – 2033 ($ Million)

10.2.4.      North America: Market Size and Forecast, By Vertical, 2023 – 2033 ($ Million)

10.2.5.      US

10.2.5.1.       US: Market Size and Forecast, By Type, 2023 – 2033 ($ Million)

10.2.5.2.       US: Market Size and Forecast, By Application, 2023 – 2033 ($ Million)

10.2.5.3.       US: Market Size and Forecast, By Vertical, 2023 – 2033 ($ Million)

10.2.6.      CANADA

10.2.6.1.       Canada: Market Size and Forecast, By Type, 2023 – 2033 ($ Million)

10.2.6.2.       Canada: Market Size and Forecast, By Application, 2023 – 2033 ($ Million)

10.2.6.3.       Canada: Market Size and Forecast, By Vertical, 2023 – 2033 ($ Million)

10.2.7.      MEXICO

10.2.7.1.       Mexico: Market Size and Forecast, By Type, 2023 – 2033 ($ Million)

10.2.7.2.       Mexico: Market Size and Forecast, By Application, 2023 – 2033 ($ Million)

10.2.7.3.       Mexico: Market Size and Forecast, By Vertical, 2023 – 2033 ($ Million)

10.3.     Europe

10.3.1.      Europe: Market Size and Forecast, By Country, 2023 – 2033 ($ Million)

10.3.2.      Europe: Market Size and Forecast, By Type, 2023 – 2033 ($ Million)

10.3.3.      Europe: Market Size and Forecast, By Application, 2023 – 2033 ($ Million)

10.3.4.      Europe: Market Size and Forecast, By Vertical, 2023 – 2033 ($ Million)

10.3.5.      U.K.

10.3.5.1.       U.K.: Market Size and Forecast, By Type, 2023 – 2033 ($ Million)

10.3.5.2.       U.K.: Market Size and Forecast, By Application, 2023 – 2033 ($ Million)

10.3.5.3.       U.K.: Market Size and Forecast, By Vertical, 2023 – 2033 ($ Million)

10.3.6.      GERMANY

10.3.6.1.       Germany: Market Size and Forecast, By Type, 2023 – 2033 ($ Million)

10.3.6.2.       Germany: Market Size and Forecast, By Application, 2023 – 2033 ($ Million)

10.3.6.3.       Germany: Market Size and Forecast, By Vertical, 2023 – 2033 ($ Million)

10.3.7.      FRANCE

10.3.7.1.       France: Market Size and Forecast, By Type, 2023 – 2033 ($ Million)

10.3.7.2.       France: Market Size and Forecast, By Application, 2023 – 2033 ($ Million)

10.3.7.3.       France: Market Size and Forecast, By Vertical, 2023 – 2033 ($ Million)

10.3.8.      ITALY

10.3.8.1.       Italy: Market Size and Forecast, By Type, 2023 – 2033 ($ Million)

10.3.8.2.       Italy: Market Size and Forecast, By Application, 2023 – 2033 ($ Million)

10.3.8.3.       Italy: Market Size and Forecast, By Vertical, 2023 – 2033 ($ Million)

10.3.9.           SPAIN

10.3.9.1.        Spain: Market Size and Forecast, By Type, 2023 – 2033 ($ Million)

10.3.9.2.        Spain: Market Size and Forecast, By Application, 2023 – 2033 ($ Million)

10.3.9.3.        Spain: Market Size and Forecast, By Vertical, 2023 – 2033 ($ Million)

10.3.10.         BENELUX

10.3.10.1.     BeNeLux: Market Size and Forecast, By Type, 2023 – 2033 ($ Million)

10.3.10.2.     BeNeLux: Market Size and Forecast, By Application, 2023 – 2033 ($ Million)

10.3.10.3.     BeNeLux: Market Size and Forecast, By Vertical, 2023 – 2033 ($ Million)

10.3.11.         RUSSIA

10.3.11.1.     Russia: Market Size and Forecast, By Type, 2023 – 2033 ($ Million)

10.3.11.2.     Russia: Market Size and Forecast, By Application, 2023 – 2033 ($ Million)

10.3.11.3.     Russia: Market Size and Forecast, By Vertical, 2023 – 2033 ($ Million)

10.3.12.         REST OF EUROPE

10.3.12.1.     Rest of Europe: Market Size and Forecast, By Type, 2023 – 2033 ($ Million)

10.3.12.2.     Rest of Europe: Market Size and Forecast, By Application, 2023 – 2033 ($ Million)

10.3.12.3.     Rest of Europe: Market Size and Forecast, By Vertical, 2023 – 2033 ($ Million)

10.4.     Asia Pacific

10.4.1.      Asia Pacific: Market Size and Forecast, By Country, 2023 – 2033 ($ Million)

10.4.2.      Asia Pacific: Market Size and Forecast, By Type, 2023 – 2033 ($ Million)

10.4.3.      Asia Pacific: Market Size and Forecast, By Application, 2023 – 2033 ($ Million)

10.4.4.      Asia Pacific: Market Size and Forecast, By Vertical, 2023 – 2033 ($ Million)

10.4.5.      CHINA

10.4.5.1.       China: Market Size and Forecast, By Type, 2023 – 2033 ($ Million)

10.4.5.2.       China: Market Size and Forecast, By Application, 2023 – 2033 ($ Million)

10.4.5.3.       China: Market Size and Forecast, By Vertical, 2023 – 2033 ($ Million)

10.4.6.      JAPAN

10.4.6.1.       Japan: Market Size and Forecast, By Type, 2023 – 2033 ($ Million)

10.4.6.2.       Japan: Market Size and Forecast, By Application, 2023 – 2033 ($ Million)

10.4.6.3.       Japan: Market Size and Forecast, By Vertical, 2023 – 2033 ($ Million)

10.4.7.      INDIA

10.4.7.1.       India: Market Size and Forecast, By Type, 2023 – 2033 ($ Million)

10.4.7.2.       India: Market Size and Forecast, By Application, 2023 – 2033 ($ Million)

10.4.7.3.       India: Market Size and Forecast, By Vertical, 2023 – 2033 ($ Million)

10.4.8.      SOUTH KOREA

10.4.8.1.       South Korea: Market Size and Forecast, By Type, 2023 – 2033 ($ Million)

10.4.8.2.       South Korea: Market Size and Forecast, By Application, 2023 – 2033 ($ Million)

10.4.8.3.       South Korea: Market Size and Forecast, By Vertical, 2023 – 2033 ($ Million)

10.4.9.           THAILAND

10.4.9.1.        Thailand: Market Size and Forecast, By Type, 2023 – 2033 ($ Million)

10.4.9.2.        Thailand: Market Size and Forecast, By Application, 2023 – 2033 ($ Million)

10.4.9.3.        Thailand: Market Size and Forecast, By Vertical, 2023 – 2033 ($ Million)

10.4.10.         INDONESIA

10.4.10.1.     Indonesia: Market Size and Forecast, By Type, 2023 – 2033 ($ Million)

10.4.10.2.     Indonesia: Market Size and Forecast, By Application, 2023 – 2033 ($ Million)

10.4.10.3.     Indonesia: Market Size and Forecast, By Vertical, 2023 – 2033 ($ Million)

10.4.11.         MALAYSIA

10.4.11.1.     Malaysia: Market Size and Forecast, By Type, 2023 – 2033 ($ Million)

10.4.11.2.     Malaysia: Market Size and Forecast, By Application, 2023 – 2033 ($ Million)

10.4.11.3.     Malaysia: Market Size and Forecast, By Vertical, 2023 – 2033 ($ Million)

10.4.12.         AUSTRALIA

10.4.12.1.     Australia: Market Size and Forecast, By Type, 2023 – 2033 ($ Million)

10.4.12.2.     Australia: Market Size and Forecast, By Application, 2023 – 2033 ($ Million)

10.4.12.3.     Australia: Market Size and Forecast, By Vertical, 2023 – 2033 ($ Million)

10.4.13.         REST FO ASIA PACIFIC

10.4.13.1.     Rest fo Asia Pacific: Market Size and Forecast, By Type, 2023 – 2033 ($ Million)

10.4.13.2.     Rest fo Asia Pacific: Market Size and Forecast, By Application, 2023 – 2033 ($ Million)

10.4.13.3.     Rest fo Asia Pacific: Market Size and Forecast, By Vertical, 2023 – 2033 ($ Million)

10.5.     South America

10.5.1.      South America: Market Size and Forecast, By Country, 2023 – 2033 ($ Million)

10.5.2.      South America: Market Size and Forecast, By Type, 2023 – 2033 ($ Million)

10.5.3.      South America: Market Size and Forecast, By Application, 2023 – 2033 ($ Million)

10.5.4.      South America: Market Size and Forecast, By Vertical, 2023 – 2033 ($ Million)

10.5.5.      BRAZIL

10.5.5.1.       Brazil: Market Size and Forecast, By Type, 2023 – 2033 ($ Million)

10.5.5.2.       Brazil: Market Size and Forecast, By Application, 2023 – 2033 ($ Million)

10.5.5.3.       Brazil: Market Size and Forecast, By Vertical, 2023 – 2033 ($ Million)

10.5.6.      ARGENTINA

10.5.6.1.       Argentina: Market Size and Forecast, By Type, 2023 – 2033 ($ Million)

10.5.6.2.       Argentina: Market Size and Forecast, By Application, 2023 – 2033 ($ Million)

10.5.6.3.       Argentina: Market Size and Forecast, By Vertical, 2023 – 2033 ($ Million)

10.5.7.      REST OF SOUTH AMERICA

10.5.7.1.       Rest of South America: Market Size and Forecast, By Type, 2023 – 2033 ($ Million)

10.5.7.2.       Rest of South America: Market Size and Forecast, By Application, 2023 – 2033 ($ Million)

10.5.7.3.       Rest of South America: Market Size and Forecast, By Vertical, 2023 – 2033 ($ Million)

10.6.     Middle East & Africa

10.6.1.      Middle East & Africa: Market Size and Forecast, By Country, 2023 – 2033 ($ Million)

10.6.2.      Middle East & Africa: Market Size and Forecast, By Type, 2023 – 2033 ($ Million)

10.6.3.      Middle East & Africa: Market Size and Forecast, By Application, 2023 – 2033 ($ Million)

10.6.4.      Middle East & Africa: Market Size and Forecast, By Vertical, 2023 – 2033 ($ Million)

10.6.5.      SAUDI ARABIA

10.6.5.1.       Saudi Arabia: Market Size and Forecast, By Type, 2023 – 2033 ($ Million)

10.6.5.2.       Saudi Arabia: Market Size and Forecast, By Application, 2023 – 2033 ($ Million)

10.6.5.3.       Saudi Arabia: Market Size and Forecast, By Vertical, 2023 – 2033 ($ Million)

10.6.6.      UAE

10.6.6.1.       UAE: Market Size and Forecast, By Type, 2023 – 2033 ($ Million)

10.6.6.2.       UAE: Market Size and Forecast, By Application, 2023 – 2033 ($ Million)

10.6.6.3.       UAE: Market Size and Forecast, By Vertical, 2023 – 2033 ($ Million)

10.6.7.      EGYPT

10.6.7.1.       Egypt: Market Size and Forecast, By Type, 2023 – 2033 ($ Million)

10.6.7.2.       Egypt: Market Size and Forecast, By Application, 2023 – 2033 ($ Million)

10.6.7.3.       Egypt: Market Size and Forecast, By Vertical, 2023 – 2033 ($ Million)

10.6.8.      SOUTH AFRICA

10.6.8.1.       South Africa: Market Size and Forecast, By Type, 2023 – 2033 ($ Million)

10.6.8.2.       South Africa: Market Size and Forecast, By Application, 2023 – 2033 ($ Million)

10.6.8.3.       South Africa: Market Size and Forecast, By Vertical, 2023 – 2033 ($ Million)

10.6.9.           REST OF MIDDLE EAST & AFRICA

10.6.9.1.        Rest of Middle East & Africa: Market Size and Forecast, By Type, 2023 – 2033 ($ Million)

10.6.9.2.        Rest of Middle East & Africa: Market Size and Forecast, By Application, 2023 – 2033 ($ Million)

10.6.9.3.        Rest of Middle East & Africa: Market Size and Forecast, By Vertical, 2023 – 2033 ($ Million)

CHAPTER 12.               Competitive Landscape

12.1.     Competitior Benchmarking 2023

12.2.     Market Share Analysis

12.3.     Key Developments Analysis By Top 5 Companies

12.4.     Market Share Acquisition Strategies: Analysis of Key Approaches Employed by Top Players

CHAPTER 13.               Company Profiles

13.1.     Keysight Technologies

13.1.1.      Business Overview

13.1.2.      Financial Analysis

13.1.2.1.       Business Segment Revenue, 2020, 2021, 2022, $ Million

13.1.2.2.       Geographic Revenue Mix, 2022 (% Share)

13.1.3.      Product Portfolio

13.1.4.      Recent Development and Strategies Adopted

13.1.5.      SWOT Analysis

13.2.     KIKUSUI ELECTRONICS CORP

13.3.     Good Will Instrument Co Ltd

13.4.     Rohde & Schwarz

13.5.     Ametek Inc

13.6.     Delta Electronics, Inc

13.7.     B&K Precision Corporation

13.8.     ETA-USA

13.9.     ITECH ELECTRONIC CO LTD

13.10.  Huawei Technologies Co Ltd


Connect to Analyst

Connect to Analyst

Research Methodology

Research Methodology

Related products

Small Satellite Market Analysis and Forecast (2021-2028) with COVID Impact Analysis

$ 3,475.00

Small Satellite Market by Product Type (Minisatellite, Microsatellite, Nanosatellite, Pico-satellites, Others), By Application (Imaging and Earth Observations, Imaging and Earth Observations, Science & Explorations, Technology Development, Others) and By Geography – COVID-19 Impact Analysis, Post COVID Analysis, Opportunities, Trends and Forecast from 2021 to 2028

Report Code: EB_A&D_439 | Page: 159 | Published Date: May 2021
Add to cart
Quick view

Aircraft Propeller Market Analysis and Global Forecast (2021-2028) with COVID Impact Analysis

$ 3,475.00

Aircraft Propeller Market By Aircraft Type (Military Aircraft, Civil & Commercial Aircraft), By Component (Blades, Hubs, Spinners, Others), By Propeller Type (Fixed Pitch Propeller, Varying Pitch Propeller), By End Use (Original Equipment Manufacturer, Aftermarket) and By Geography – COVID-19 Impact Analysis, Post COVID Analysis, Opportunities, Trends and Forecast from 2021 to 2028

Report Code: EB_A&D_709| Page: 179 | Report Status: Upcoming
Add to cart
Quick view

Ground Support Equipment Market Analysis and Global Forecast (2021-2028) with COVID Impact Analysis

$ 3,475.00

Ground Support Equipment Market By Point of Sale (Equipment, Maintenance Services), By Mode of Operation (Conventional/Manned GSE, Remotely Operated GSE, Autonomous GSE), By Type (Mobile, Fixed) and By Geography – COVID-19 Impact Analysis, Post COVID Analysis, Opportunities, Trends and Forecast from 2021 to 2028

Report Code: EB_A&D_426 | Page: 165 | Published Date: May 2021
Add to cart
Quick view
Aerospace market research-ebi

Unmanned Aerial Vehicle Market

$ 3,475.00
Report Code: EB_A&D_1| Page: 134 | Published Date: Feb 2021 Unmanned Aerial Vehicle Market By Mode of Operation (Remotely Piloted, Optionally Piloted, and Fully Autonomous) By Size (Small, Medium and Large) By Application (Commercial, Defense and Civil) By Type (Fixed Wing and Rotor Wing) By Geography: Global trends, opportunities and forecast – 2020 to 2027
Add to cart
Quick view

Aviation Analytics Market Analysis and Forecast (2021-2028) with COVID Impact Analysis

$ 3,475.00

Aviation Analytics Market by End Users (Airlines, Airports, Others,), By Application (Flight Risk Management, Inventory Management, Fuel Management, Revenue Management, Others) and By Geography – COVID-19 Impact Analysis, Post COVID Analysis, Opportunities, Trends and Forecast from 2021 to 2028

Report Code: EB_A&D_441| Page: 179| Report Status: Upcoming
Add to cart
Quick view

Counter-UAS Market Analysis and Global Forecast (2021-2028) with COVID Impact Analysis

$ 3,475.00

Counter-UAS Market By System Configuration (Portable, Vehicle-Mounted, Standalone), By Technology (Laser Systems, Kinetic Systems, Electronic Systems), By Application (Detection, Interdiction), By End Use (Military and Defense, Commercial, Homeland Security) and By Geography – COVID-19 Impact Analysis, Post COVID Analysis, Opportunities, Trends and Forecast from 2021 to 2028

Report Code: EB_A&D_707| Page: 177 | Published Date: March 2021
Add to cart
Quick view

Satellite Services Market Analysis and Forecast (2021-2028) with COVID Impact Analysis

$ 3,475.00

Satellite Services Market by Product Type (Consumer Services, Fixed Satellite Services, Fixed Satellite Services, Remote Sensing, Others), By End User (Media & Entertainment, Government, Aviation, Defense, Others) and By Geography – COVID-19 Impact Analysis, Post COVID Analysis, Opportunities, Trends and Forecast from 2021 to 2028

Report Code: EB_A&D_437| Page: 162| Published Date: May 2021
Add to cart
Quick view

Sustainable Aviation Fuel Market Analysis and Global Forecast (2021-2028) with COVID Impact Analysis

$ 3,475.00

Sustainable Aviation Fuel Market By fuel type (Biofuel, Hydrogen Fuel, Power to Liquid Fuel), By Manufacturing fuel type (Hydro processed Fatty Acid Esters, Fischer Tropsch Synthetic Paraffinic Kerosene, Fischer Tropsch, Alcohol to Jet SPK, Others), By Blending Capacity (Below 30%, 30% to 50%, Above 50%) and By Geography – COVID-19 Impact Analysis, Post COVID Analysis, Opportunities, Trends and Forecast from 2021 to 2028

Report Code: EB_A&D_708| Page: 178 | Published Date: April 2021
Add to cart
Quick view

Uncover Market Secrets: Get Market Insights in Your Inbox 🚀

Join over 5,000 professionals staying ahead of industry trends. Subscribe to our weekly market research newsletter.

Join our community of industry leaders and stay ahead of the curve. Subscribe now for data-driven market intelligence and strategic recommendations that will set your business on a path to success! Don't miss out on our FREE exclusive insights – sign up today and soar above your competition!🚀

cropped-evolvebi-Logo-2021-1.png
M/S Evolve Business Intelligence C-218, 2nd floor, M-Cube, N.H. – 48, Balitha, Vapi, Valsad- Gujarat
Email: [email protected]

Email: [email protected]

  • Important Links
    • About Evolvebi
    • Competitive Intelligence
    • Become a reseller
    • Contact Us
  • Top Search By Countries Hot
    • United State
    • Europe
    • Asia Pacific
    • Middle East & Africa
    • Latin America

© 2021 - 2023 Evolve Business Intelligence. All rights reserved. Developed by Nectron

Privacy Policy | Terms and Conditions | Cancellation and Refund policy

  • Home
  • About Us
  • Services
  • Market Reports
    • Automotive
      • Component
      • Vehicle
      • Chemical Automotive
      • Technology
      • Freight & Logistics
      • Material
      • Technology
      • Transport Mode
      • Utility
      • Vehicle
    • Chemical and Materials
      • Chemical
      • Advanced Materials
      • Coatings and Additives
      • Composites
      • Paints
      • Textile
    • Aerospace & Defense
      • Marine
      • Security
      • Technology
      • Aircraft Components
      • Aircraft Material
    • Construction & Manufacturing
    • Electronics and Semiconductor
      • Display Technology
      • Electronic Component
      • Electronic Devices
      • Semiconductor
      • Communication Equipment
      • Emerging Technologies
      • Security
      • Sensor & Control
      • Technology
    • Energy and Power
    • Life Science
    • Consumer & Goods
      • Baby products and supplies
      • Beauty & Personal Care
      • Consumer
      • Home Products
    • Information and Communication Technology
      • Emerging Technologies
      • Entertainment Technologies
      • Security
      • Communication
      • Data Center
      • Data Center and Networking
      • Software and Services
      • Technology
  • Competitive Intelligence (CI)
    • Automotive (CI)
    • Chemical and Materials (CI)
    • Construction & Manufacturing (CI)
    • Energy and Power (CI)
    • Electronics and Semiconductor (CI)
    • Healthcare (CI)
    • Information and Communication Technology ICT (CI)
  • Contact Us
We use cookies to improve your experience on our website. By browsing this website, you agree to our use of cookies.
More info Accept
I allow the Site owner to contact me via email/phone to discuss this enquiry. (If you want to know more about the way this site handles the data, then please go through our privacy policy).
Brought to you by WisdmLabs: WordPress Development Experts

Sending...