Agrochemical Market Analysis and Global Forecast 2023-2033
$ 1,390.00 – $ 5,520.00Price range: $ 1,390.00 through $ 5,520.00
Agrochemical Market Research Report: By Fertilizer Type (Nitrogen fertilizer, Phosphatic Fertilizer, Potassic Fertilizer), By Pesticide Type (Fungicides, Herbicides, Insecticides, Others), By Crop Type (Cereals & Grains, Oilseeds & Pulses, Fruits & Vegetables, Others), and by Region — Forecast till 2033.
Page: 137
Agrochemical Market Overview
The Agrochemical Market Size is expected to reach USD 287.47 Billion by 2033. The Agrochemical industry size accounted for USD 224.25 Billion in 2023 and is expected to expand at a compound annual growth rate (CAGR) of 2.86% from 2023 to 2033. The agrochemicals market refers to the industry that produces and sells various products used in agriculture to improve crop yields and protect plants from pests and diseases. This market is segmented by type, including fertilizers, pesticides, adjuvants, and plant growth regulators, and by application, such as crop-based and non-crop-based uses. The market is dominated by key players like BASF SE, Corteva Agriscience, Yara International ASA, Bayer Crop Science, and Adama Agricultural Solutions, among others. The market is expected to grow at a CAGR of 4% to reach USD 308.17 billion by 2029, with the Asia-Pacific region, particularly India and China, leading in consumption. The market is driven by factors such as the growing demand for high-quality, blemish-free produce, and the need to maintain aesthetics and marketability. The industry is also experiencing innovations in the feed and animal husbandry sectors, advancements in product development and diagnostics, and a surge in demand for fertilizers and pesticides essential for boosting agricultural productivity to satisfy the increasing demand for food supply.
Global Agrochemical Market Synopsis
The Agrochemical market experienced a positive impact due to the COVID-19 pandemic. Due to supply chain disruptions brought on by the COVID-19 pandemic, there are now shortages or decreased demand in the agrochemicals sector. Spending by consumers and businesses has decreased significantly as a result of the travel restrictions and social distancing measures, and this trend is expected to persist for some time. The epidemic has altered end-user trends and tastes, prompting manufacturers, developers, and service providers to implement diverse tactics aimed at stabilizing their businesses.
Global Agrochemical Market Dynamics
The major factors that have impacted the growth of Agrochemical are as follows:
Drivers:
⮚ Technological Advancements
Advances in biotechnology, such as genetically modified (GM) crops, precision agriculture, and digital farming technologies, have transformed agricultural practices. Agrochemical companies invest in research and development to develop new formulations and technologies that improve crop protection and enhance yields.
Restraint:
- Technological Challenges
While technological advancements drive innovation in the agrochemical industry, they also present challenges related to product development, formulation optimization, and regulatory approval. Developing novel active ingredients and formulations that meet efficacy, safety, and environmental standards requires substantial investment in research and development, as well as collaboration with regulatory agencies and academic institutions
Opportunity:
⮚ Digital Farming Platforms
Digital farming platforms and agritech startups are revolutionizing the way farmers manage their operations, from crop planning and monitoring to decision-making and analytics. Agrochemical companies can leverage digital technologies to provide integrated solutions that combine agronomic expertise with data-driven insights, enabling farmers to make informed decisions about agrochemical use and crop management practices.
Agrochemical Market Segment Overview
By Fertilizer Type
 Based on the Fertilizer Type, the market is segmented based on Nitrogen fertilizer, Phosphatic Fertilizer and Potassic Fertilizer. Phosphatic fertilizers follow suit, providing essential phosphorus for plant development and root formation. Potassic fertilizers also play a significant role, supplying potassium vital for plant stress tolerance and fruit quality. Together, these fertilizer types form the backbone of modern agricultural practices, supporting sustainable crop production worldwide.
By Pesticide Type
Based on the Pesticide Type, the market has been divided into Fungicides, Herbicides, Insecticides and Others. Herbicides dominate this segment, driven by their widespread usage to control weeds and improve crop yields. Insecticides follow closely, catering to the need for pest management, while fungicides play a crucial role in protecting crops from fungal diseases. Overall, this segment reflects the diverse arsenal of chemical solutions employed in modern agriculture to ensure crop health and maximize productivity.
By Crop Type
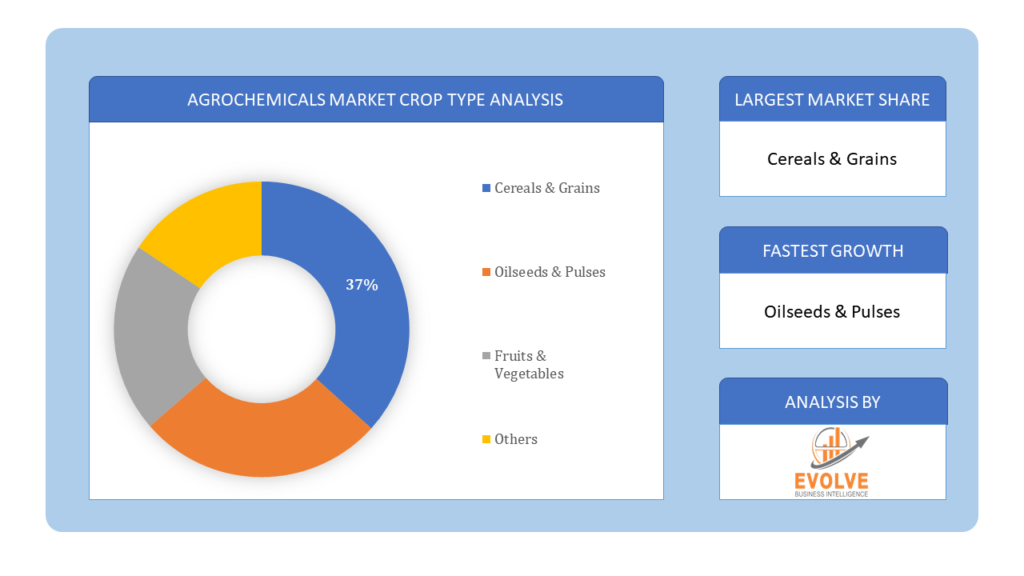
Based on Crop Type, the market has been divided into Cereals & Grains, Oilseeds & Pulses, Fruits & Vegetables and Others. Food grains held a dominant position in the market in 2022 and are anticipated to increase at the fastest rate throughout the course of the forecast period. Despite a decline in the per capita direct consumption of food grains, the population growth is anticipated to drive a 2% annual increase in the total demand over the medium term.
Global Agrochemical Market Regional Analysis
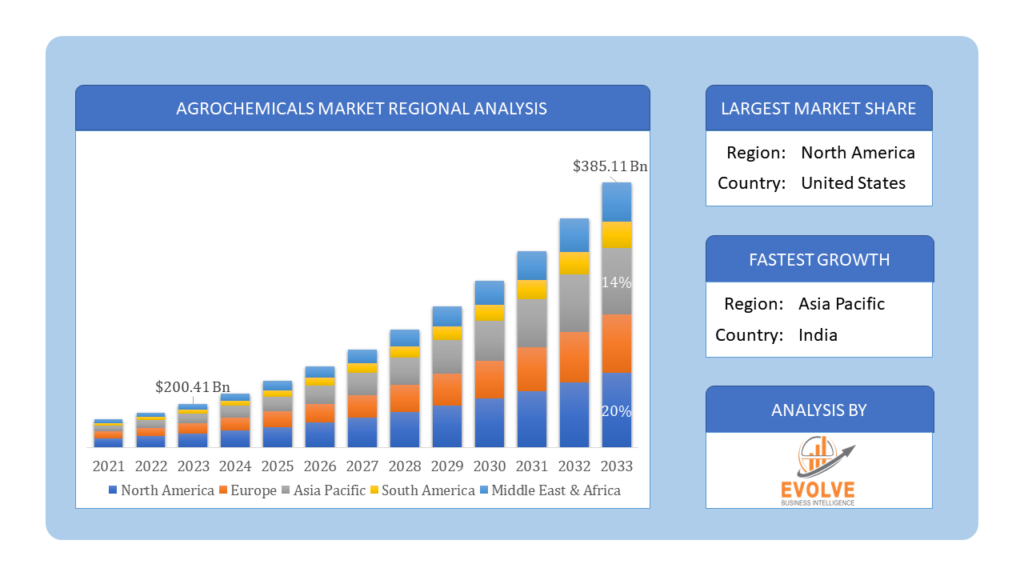
Based on region, the market has been divided into North America, Europe, Asia-Pacific, the Middle East & Africa, and Latin America. The area of Asia Pacific is anticipated to dominate the market for the usage of Agrochemical, followed by those in North America and Europe.
 Agrochemical Asia Pacific Market
Asia Pacific dominates the Agrochemical market due to several factors. The agrochemicals market in Asia-Pacific was valued at USD 154.3 billion in 2022 and is projected to increase at a substantial compound annual growth rate (CAGR) throughout the course of the study. China, Japan, and India are the main contributors to the regional market. The FAO and International Trade Center (ITC) both state that China is the biggest producer and exporter of pesticides worldwide. India is the world’s fourth-largest producer of agrochemicals, behind the United States, China, and Japan, according to the Food and Agriculture Organization (FAO) and the Organization for Economic Co-operation and Development (OECD).
Agrochemical North America Market
The North America region has been witnessing remarkable growth in recent years. In 2022, the agrochemicals market in North America is expected to be the second largest. Furthermore, in 2022, the US agrochemical market had the most market share. Because of the increasing demand for commodities including blueberries, sorghum, soy, and maize, the United States controlled the North American agrochemicals industry. Furthermore, the United States has the top position in the global production of almonds, blueberries, sorghum, and maize.
Competitive Landscape
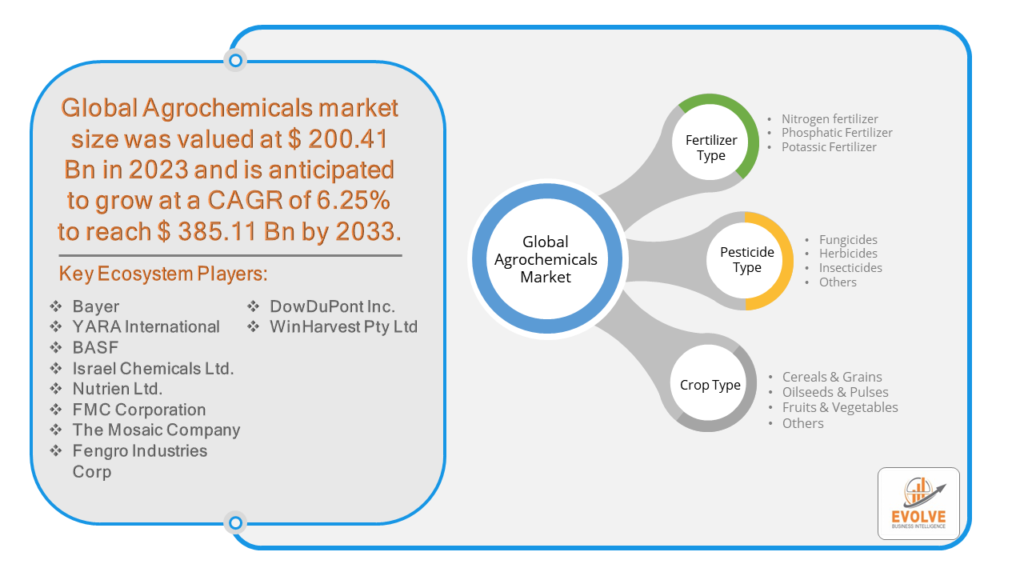
The competitive landscape includes key players (tier 1, tier 2, and local) having a presence across the globe. Companies such as Bayer, YARA International, BASF, Israel Chemicals Ltd., and Nutrien Ltd. are some of the leading players in the global Agrochemical Industry. These players have adopted partnership, acquisition, expansion, and new product development, among others as their key strategies.
Key Market Players:
- Bayer
- YARA International
- BASF
- Israel Chemicals Ltd.
- Nutrien Ltd.
- FMC Corporation
- The Mosaic Company
- Fengro Industries Corp
- DowDuPont Inc
- WinHarvest Pty Ltd
Key development:
In December 2020: BASF planned on introducing the insecticide Renestra in 2021. With the help of this new tool, soybean farmers can now completely control a variety of insect pests and soybean aphids that are resistant to conventional chemicals.
Scope of the Report
Global Agrochemical Market, by Fertilizer Type
- Nitrogen fertilizer
- Phosphatic Fertilizer
- Potassic Fertilizer
Global Agrochemical Market, by Pesticide Type
- Fungicides
- Herbicides
- Insecticides
- Others
Global Agrochemical Market, by Crop Type
- Cereals & Grains
- Oilseeds & Pulses
- Fruits & Vegetables
- Others
Global Agrochemical Market, by Region
- North America
- US
- Canada
- Mexico
- Europe
- UK
- Germany
- France
- Italy
- Spain
- Benelux
- Nordic
- Rest of Europe
- Asia Pacific
- China
- Japan
- South Korea
- Indonesia
- Austalia
- Malaysia
- India
- Rest of Asia Pacific
- South America
- Brazil
- Argentina
- Rest of South America
- Middle East & Africa
- Saudi Arabia
- UAE
- Egypt
- South Africa
- Rest of Middle East & Africa
| Parameters | Indicators |
|---|---|
| Market Size | 2033: $287.47 Billion |
| CAGR | 2.86% CAGR (2023-2033) |
| Base year | 2022 |
| Forecast Period | 2023-2033 |
| Historical Data | 2021 |
| Report Coverage | Revenue Forecast, Competitive Landscape, Growth Factors, and Trends |
| Key Segmentations | Fertilizer Type, Pesticide Type, Crop Type |
| Geographies Covered | North America, Europe, Asia-Pacific, Latin America, Middle East, Africa |
| Key Vendors | Bayer, YARA International, BASF, Israel Chemicals Ltd., Nutrien Ltd., FMC Corporation, The Mosaic Company, Fengro Industries Corp, DowDuPont Inc, WinHarvest Pty Ltd |
| Key Market Opportunities | • Rapidly growing population |
| Key Market Drivers | •• Growing food demand globally |
REPORT CONTENT BRIEF:
- High-level analysis of the current and future Agrochemical Industry trends and opportunities
- Detailed analysis of current market drivers, restraining factors, and opportunities analysis in the future
- Historical market size for the year 2021, and forecast from 2023 to 2033
- Agrochemical market share analysis for each segment
- Competitor analysis with a comprehensive insight into its product segment, financial strength, and strategies adopted.
- Identifies key strategies adopted by the key players including new product development, mergers and acquisitions, joint ventures, collaborations, and partnerships.
- To identify and understand the various factors involved in the global Agrochemical market affected by the pandemic
- To provide year-on-year growth from 2022 to 2033
- To provide short-term, long-term, and overall CAGR comparison from 2022 to 2033.
- Provide Total Addressable Market (TAM) for the Global Agrochemical Market.
Press Release

Global Pharmaceutical Manufacturing Market to Reach $1.38 Trillion by 2035 with 7.35% CAGR, New Research Shows

The Global Mammography Market Is Estimated To Record a CAGR of Around 10.29% During The Forecast Period

Glue Stick Market to Reach USD 2.35 Billion by 2034

Podiatry Service Market to Reach USD 11.88 Billion by 2034

Microfluidics Technology Market to Reach USD 32.58 Billion by 2034

Ferric Chloride Market to Reach USD 10.65 Billion by 2034

Family Practice EMR Software Market to Reach USD 21.52 Billion by 2034

Electric Hairbrush Market to Reach USD 15.95 Billion by 2034

Daily Bamboo Products Market to Reach USD 143.52 Billion by 2034

Cross-border E-commerce Logistics Market to Reach USD 112.65 Billion by 2034
Frequently Asked Questions (FAQ)
What is the study period of the Agrochemicals Market?
The study period includes historical data from 2021 and forecasts for the years 2023 to 2033.
What is the growth rate of the Agrochemicals Market?
The Agrochemicals Market is expected to expand at a compound annual growth rate (CAGR) of 2.86% from 2023 to 2033.
Which region has the highest growth rate in the Agrochemicals Market?
The Asia Pacific region is anticipated to have the highest growth rate in the Agrochemicals Market, driven by factors such as rapid urbanization, agricultural expansion, and increasing food demand.
Which region has the largest share of the Agrochemicals Market?
Currently, Asia Pacific dominates the Agrochemicals Market, with countries like China, Japan, and India contributing significantly to market growth.
Who are the key players in the Agrochemicals Market?
Key players in the Agrochemicals Market include BASF SE, Corteva Agriscience, Yara International ASA, Bayer Crop Science, Adama Agricultural Solutions, Bayer, YARA International, BASF, Israel Chemicals Ltd., Nutrien Ltd., FMC Corporation, The Mosaic Company, Fengro Industries Corp, DowDuPont Inc, and WinHarvest Pty Ltd.
Do you offer Post sales support?
Yes, we offer 16 hours of analyst support to solve the queries
Do you sell particular sections of a report?
Yes, we provide regional as well as country-level reports. Other than this we also provide a sectional report. Please get in contact with our sales representatives.
Table of Content
CHAPTER 1. Executive Summary CHAPTER 2. Scope of the Study 2.1. Market Definition 2.2. Market Scope & Segmentation 2.2.1. Objective of Report CHAPTER 3. Evolve BI Methodology 3.1. Data Collection & Validation Approach 3.2. Market Size Estimation and Forecast CHAPTER 4. Exclusive Analysis 4.1. Market Opportunity Score 4.1.1. Fertilizer Type Segement – Market Opportunity Score 4.1.2. Pesticide TypeSegment – Market Opportunity Score 4.1.3. Crop Type Segment – Market Opportunity Score 4.2. Key Market Influencing Indicators CHAPTER 5. Market Insights and Trends 5.1. Value Chain Analysis 5.1.1. Raw Material 5.1.2. Manufacturing Process 5.1.3. Distribution Channel 5.1.4. End User 5.2. Porter’s Five Forces Analysis 5.2.1. Bargaining Power of Buyers 5.2.2. Bargaining Power of Suppliers 5.2.3. Threat of New Entrant 5.2.4. Threat of Substitute 5.2.5. Industry Rivalry 5.3. COVID-19 Impact and Post COVID Scenario on Agrochemical Market 5.3.1. Impact of COVID-19 5.3.2. Government Support and Industry Revival Policies 5.3.3. Measures Taken by Companies to Mitigate Negative Impact 5.3.4. Post COVID Trend CHAPTER 6. MArket Dynamics 6.1. Introduction 6.2. Drivers 6.2.1. Driver 1 6.2.2. Driver 2 6.2.3. Driver 3 6.3. Restraints 6.3.1. Restraint 1 6.3.2. Restraint 2 6.4. Opportunity 6.4.1. Opportunity 1 CHAPTER 7. Global Agrochemical Market, By Fertilizer Type 7.1. Introduction 7.1.1. Nitrogen fertilizer 7.1.2. Phosphatic Fertilizer 7.1.3. Potassic Fertilizer CHAPTER 8. Global Agrochemical Market, By Pesticide Type 8.1. Introduction 8.1.1. Fungicides 8.1.2. Herbicides 8.1.3. Insecticides 8.1.4. Others CHAPTER 9. Global Agrochemical Market, By Crop Type 9.1. Introduction 9.1.1. Cereals & Grains 9.1.2. Oilseeds & Pulses 9.1.3. Fruits & Vegetables 9.1.4. Others CHAPTER 10. Global Agrochemical Market, By Region 10.1. Introduction 10.2. NORTH AMERICA 10.2.1. North America: Market Size and Forecast, By Country, 2023 – 2033 ($ Million) 10.2.2. North America: Market Size and Forecast, By Fertilizer Type, 2023 – 2033 ($ Million) 10.2.3. North America: Market Size and Forecast, By Pesticide Type, 2023 – 2033 ($ Million) 10.2.4. North America: Market Size and Forecast, By Crop Type, 2023 – 2033 ($ Million) 10.2.5. US 10.2.5.1. US: Market Size and Forecast, By Fertilizer Type, 2023 – 2033 ($ Million) 10.2.5.2. US: Market Size and Forecast, By Pesticide Type, 2023 – 2033 ($ Million) 10.2.5.3. US: Market Size and Forecast, By Crop Type, 2023 – 2033 ($ Million) 10.2.6. CANADA 10.2.6.1. Canada: Market Size and Forecast, By Fertilizer Type, 2023 – 2033 ($ Million) 10.2.6.2. Canada: Market Size and Forecast, By Pesticide Type, 2023 – 2033 ($ Million) 10.2.6.3. Canada: Market Size and Forecast, By Crop Type, 2023 – 2033 ($ Million) 10.2.7. MEXICO 10.2.7.1. Mexico: Market Size and Forecast, By Fertilizer Type, 2023 – 2033 ($ Million) 10.2.7.2. Mexico: Market Size and Forecast, By Pesticide Type, 2023 – 2033 ($ Million) 10.2.7.3. Mexico: Market Size and Forecast, By Crop Type, 2023 – 2033 ($ Million) 10.3. Europe 10.3.1. Europe: Market Size and Forecast, By Country, 2023 – 2033 ($ Million) 10.3.2. Europe: Market Size and Forecast, By Fertilizer Type, 2023 – 2033 ($ Million) 10.3.3. Europe: Market Size and Forecast, By Pesticide Type, 2023 – 2033 ($ Million) 10.3.4. Europe: Market Size and Forecast, By Crop Type, 2023 – 2033 ($ Million) 10.3.5. U.K. 10.3.5.1. U.K.: Market Size and Forecast, By Fertilizer Type, 2023 – 2033 ($ Million) 10.3.5.2. U.K.: Market Size and Forecast, By Pesticide Type, 2023 – 2033 ($ Million) 10.3.5.3. U.K.: Market Size and Forecast, By Crop Type, 2023 – 2033 ($ Million) 10.3.6. GERMANY 10.3.6.1. Germany: Market Size and Forecast, By Fertilizer Type, 2023 – 2033 ($ Million) 10.3.6.2. Germany: Market Size and Forecast, By Pesticide Type, 2023 – 2033 ($ Million) 10.3.6.3. Germany: Market Size and Forecast, By Crop Type, 2023 – 2033 ($ Million) 10.3.7. FRANCE 10.3.7.1. France: Market Size and Forecast, By Fertilizer Type, 2023 – 2033 ($ Million) 10.3.7.2. France: Market Size and Forecast, By Pesticide Type, 2023 – 2033 ($ Million) 10.3.7.3. France: Market Size and Forecast, By Crop Type, 2023 – 2033 ($ Million) 10.3.8. ITALY 10.3.8.1. Italy: Market Size and Forecast, By Fertilizer Type, 2023 – 2033 ($ Million) 10.3.8.2. Italy: Market Size and Forecast, By Pesticide Type, 2023 – 2033 ($ Million) 10.3.8.3. Italy: Market Size and Forecast, By Crop Type, 2023 – 2033 ($ Million) 10.3.9. SPAIN 10.3.9.1. Spain: Market Size and Forecast, By Fertilizer Type, 2023 – 2033 ($ Million) 10.3.9.2. Spain: Market Size and Forecast, By Pesticide Type, 2023 – 2033 ($ Million) 10.3.9.3. Spain: Market Size and Forecast, By Crop Type, 2023 – 2033 ($ Million) 10.3.10. BENELUX 10.3.10.1. BeNeLux: Market Size and Forecast, By Fertilizer Type, 2023 – 2033 ($ Million) 10.3.10.2. BeNeLux: Market Size and Forecast, By Pesticide Type, 2023 – 2033 ($ Million) 10.3.10.3. BeNeLux: Market Size and Forecast, By Crop Type, 2023 – 2033 ($ Million) 10.3.11. RUSSIA 10.3.11.1. Russia: Market Size and Forecast, By Fertilizer Type, 2023 – 2033 ($ Million) 10.3.11.2. Russia: Market Size and Forecast, By Pesticide Type, 2023 – 2033 ($ Million) 10.3.11.3. Russia: Market Size and Forecast, By Crop Type, 2023 – 2033 ($ Million) 10.3.12. REST OF EUROPE 10.3.12.1. Rest of Europe: Market Size and Forecast, By Fertilizer Type, 2023 – 2033 ($ Million) 10.3.12.2. Rest of Europe: Market Size and Forecast, By Pesticide Type, 2023 – 2033 ($ Million) 10.3.12.3. Rest of Europe: Market Size and Forecast, By Crop Type, 2023 – 2033 ($ Million) 10.4. Asia Pacific 10.4.1. Asia Pacific: Market Size and Forecast, By Country, 2023 – 2033 ($ Million) 10.4.2. Asia Pacific: Market Size and Forecast, By Fertilizer Type, 2023 – 2033 ($ Million) 10.4.3. Asia Pacific: Market Size and Forecast, By Pesticide Type, 2023 – 2033 ($ Million) 10.4.4. Asia Pacific: Market Size and Forecast, By Crop Type, 2023 – 2033 ($ Million) 10.4.5. CHINA 10.4.5.1. China: Market Size and Forecast, By Fertilizer Type, 2023 – 2033 ($ Million) 10.4.5.2. China: Market Size and Forecast, By Pesticide Type, 2023 – 2033 ($ Million) 10.4.5.3. China: Market Size and Forecast, By Crop Type, 2023 – 2033 ($ Million) 10.4.6. JAPAN 10.4.6.1. Japan: Market Size and Forecast, By Fertilizer Type, 2023 – 2033 ($ Million) 10.4.6.2. Japan: Market Size and Forecast, By Pesticide Type, 2023 – 2033 ($ Million) 10.4.6.3. Japan: Market Size and Forecast, By Crop Type, 2023 – 2033 ($ Million) 10.4.7. INDIA 10.4.7.1. India: Market Size and Forecast, By Fertilizer Type, 2023 – 2033 ($ Million) 10.4.7.2. India: Market Size and Forecast, By Pesticide Type, 2023 – 2033 ($ Million) 10.4.7.3. India: Market Size and Forecast, By Crop Type, 2023 – 2033 ($ Million) 10.4.8. SOUTH KOREA 10.4.8.1. South Korea: Market Size and Forecast, By Fertilizer Type, 2023 – 2033 ($ Million) 10.4.8.2. South Korea: Market Size and Forecast, By Pesticide Type, 2023 – 2033 ($ Million) 10.4.8.3. South Korea: Market Size and Forecast, By Crop Type, 2023 – 2033 ($ Million) 10.4.9. THAILAND 10.4.9.1. Thailand: Market Size and Forecast, By Fertilizer Type, 2023 – 2033 ($ Million) 10.4.9.2. Thailand: Market Size and Forecast, By Pesticide Type, 2023 – 2033 ($ Million) 10.4.9.3. Thailand: Market Size and Forecast, By Crop Type, 2023 – 2033 ($ Million) 10.4.10. INDONESIA 10.4.10.1. Indonesia: Market Size and Forecast, By Fertilizer Type, 2023 – 2033 ($ Million) 10.4.10.2. Indonesia: Market Size and Forecast, By Pesticide Type, 2023 – 2033 ($ Million) 10.4.10.3. Indonesia: Market Size and Forecast, By Crop Type, 2023 – 2033 ($ Million) 10.4.11. MALAYSIA 10.4.11.1. Malaysia: Market Size and Forecast, By Fertilizer Type, 2023 – 2033 ($ Million) 10.4.11.2. Malaysia: Market Size and Forecast, By Pesticide Type, 2023 – 2033 ($ Million) 10.4.11.3. Malaysia: Market Size and Forecast, By Crop Type, 2023 – 2033 ($ Million) 10.4.12. AUSTRALIA 10.4.12.1. Australia: Market Size and Forecast, By Fertilizer Type, 2023 – 2033 ($ Million) 10.4.12.2. Australia: Market Size and Forecast, By Pesticide Type, 2023 – 2033 ($ Million) 10.4.12.3. Australia: Market Size and Forecast, By Crop Type, 2023 – 2033 ($ Million) 10.4.13. REST FO ASIA PACIFIC 10.4.13.1. Rest fo Asia Pacific: Market Size and Forecast, By Fertilizer Type, 2023 – 2033 ($ Million) 10.4.13.2. Rest fo Asia Pacific: Market Size and Forecast, By Pesticide Type, 2023 – 2033 ($ Million) 10.4.13.3. Rest fo Asia Pacific: Market Size and Forecast, By Crop Type, 2023 – 2033 ($ Million) 10.5. South America 10.5.1. South America: Market Size and Forecast, By Country, 2023 – 2033 ($ Million) 10.5.2. South America: Market Size and Forecast, By Fertilizer Type, 2023 – 2033 ($ Million) 10.5.3. South America: Market Size and Forecast, By Pesticide Type, 2023 – 2033 ($ Million) 10.5.4. South America: Market Size and Forecast, By Crop Type, 2023 – 2033 ($ Million) 10.5.5. BRAZIL 10.5.5.1. Brazil: Market Size and Forecast, By Fertilizer Type, 2023 – 2033 ($ Million) 10.5.5.2. Brazil: Market Size and Forecast, By Pesticide Type, 2023 – 2033 ($ Million) 10.5.5.3. Brazil: Market Size and Forecast, By Crop Type, 2023 – 2033 ($ Million) 10.5.6. ARGENTINA 10.5.6.1. Argentina: Market Size and Forecast, By Fertilizer Type, 2023 – 2033 ($ Million) 10.5.6.2. Argentina: Market Size and Forecast, By Pesticide Type, 2023 – 2033 ($ Million) 10.5.6.3. Argentina: Market Size and Forecast, By Crop Type, 2023 – 2033 ($ Million) 10.5.7. REST OF SOUTH AMERICA 10.5.7.1. Rest of South America: Market Size and Forecast, By Fertilizer Type, 2023 – 2033 ($ Million) 10.5.7.2. Rest of South America: Market Size and Forecast, By Pesticide Type, 2023 – 2033 ($ Million) 10.5.7.3. Rest of South America: Market Size and Forecast, By Crop Type, 2023 – 2033 ($ Million) 10.6. Middle East & Africa 10.6.1. Middle East & Africa: Market Size and Forecast, By Country, 2023 – 2033 ($ Million) 10.6.2. Middle East & Africa: Market Size and Forecast, By Fertilizer Type, 2023 – 2033 ($ Million) 10.6.3. Middle East & Africa: Market Size and Forecast, By Pesticide Type, 2023 – 2033 ($ Million) 10.6.4. Middle East & Africa: Market Size and Forecast, By Crop Type, 2023 – 2033 ($ Million) 10.6.5. SAUDI ARABIA 10.6.5.1. Saudi Arabia: Market Size and Forecast, By Fertilizer Type, 2023 – 2033 ($ Million) 10.6.5.2. Saudi Arabia: Market Size and Forecast, By Pesticide Type, 2023 – 2033 ($ Million) 10.6.5.3. Saudi Arabia: Market Size and Forecast, By Crop Type, 2023 – 2033 ($ Million) 10.6.6. UAE 10.6.6.1. UAE: Market Size and Forecast, By Fertilizer Type, 2023 – 2033 ($ Million) 10.6.6.2. UAE: Market Size and Forecast, By Pesticide Type, 2023 – 2033 ($ Million) 10.6.6.3. UAE: Market Size and Forecast, By Crop Type, 2023 – 2033 ($ Million) 10.6.7. EGYPT 10.6.7.1. Egypt: Market Size and Forecast, By Fertilizer Type, 2023 – 2033 ($ Million) 10.6.7.2. Egypt: Market Size and Forecast, By Pesticide Type, 2023 – 2033 ($ Million) 10.6.7.3. Egypt: Market Size and Forecast, By Crop Type, 2023 – 2033 ($ Million) 10.6.8. SOUTH AFRICA 10.6.8.1. South Africa: Market Size and Forecast, By Fertilizer Type, 2023 – 2033 ($ Million) 10.6.8.2. South Africa: Market Size and Forecast, By Pesticide Type, 2023 – 2033 ($ Million) 10.6.8.3. South Africa: Market Size and Forecast, By Crop Type, 2023 – 2033 ($ Million) 10.6.9. REST OF MIDDLE EAST & AFRICA 10.6.9.1. Rest of Middle East & Africa: Market Size and Forecast, By Fertilizer Type, 2023 – 2033 ($ Million) 10.6.9.2. Rest of Middle East & Africa: Market Size and Forecast, By Pesticide Type, 2023 – 2033 ($ Million) 10.6.9.3. Rest of Middle East & Africa: Market Size and Forecast, By Crop Type, 2023 – 2033 ($ Million) CHAPTER 12. Competitive Landscape 12.1. Competitior Benchmarking 2023 12.2. Market Share Analysis 12.3. Key Developments Analysis By Top 5 Companies 12.4. Market Share Acquisition Strategies: Analysis of Key Approaches Employed by Top Players CHAPTER 13. Company Profiles 13.1. Bayer 13.1.1. Business Overview 13.1.2. Financial Analysis 13.1.2.1. Business Segment Revenue, 2020, 2021, 2022, $ Million 13.1.2.2. Geographic Revenue Mix, 2022 (% Share) 13.1.3. Product Portfolio 13.1.4. Recent Development and Strategies Adopted 13.1.5. SWOT Analysis 13.2. YARA International 13.3. BASF 13.4. Israel Chemicals Ltd. 13.5. Nutrien Ltd. 13.6. FMC Corporation 13.7. The Mosaic Company 13.8. Fengro Industries Corp 13.9. DowDuPont Inc 13.10. Genie AI Ltd
Connect to Analyst
Research Methodology


