Virtual Power Plant Market Analysis and Global Forecast 2024-2034
$ 1,390.00 – $ 5,520.00Price range: $ 1,390.00 through $ 5,520.00
Virtual Power Plant Market Research Report: Information By Technology Type (Distribution Generation, Demand Response, Mixed Asset , Others), By Application (Commercial, Industrial, Residential, Others), and by Region — Forecast till 2034
Page: 99
Virtual Power Plant Market Overview
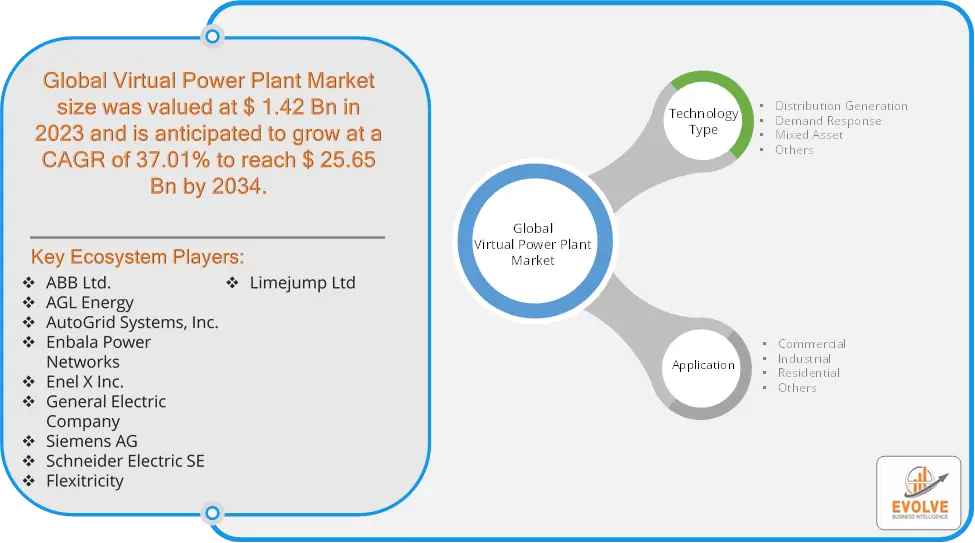
The Virtual Power Plant Market size accounted for USD 1.42 Billion in 2023 and is estimated to account for 2.04 Billion in 2024. The Market is expected to reach USD 25.65 Billion by 2034 growing at a compound annual growth rate (CAGR) of 37.01% from 2024 to 2034. A Virtual Power Plant (VPP) Market refers to the growing industry centered around the development, deployment, and management of virtual power plants—a technology that aggregates decentralized power sources such as renewable energy installations (solar panels, wind turbines), battery storage systems, and demand-response mechanisms into a unified, cloud-based platform. This enables efficient energy management, optimizing supply and demand in real-time.
The VPP market is driven by factors such as the increasing adoption of renewable energy, advancements in smart grid technology, and the need for grid stability, especially in regions with high renewable penetration. It also supports energy trading, allowing participants to sell excess power back to the grid.
Global Virtual Power Plant Market Synopsis
 Virtual Power Plant Market Dynamics
The major factors that have impacted the growth of Virtual Power Plant Market are as follows:
Drivers:
Ø Grid Stability and Flexibility Needs
VPPs enhance grid resilience by managing energy fluctuations, especially in regions with a high share of intermittent renewable energy sources. They help balance supply and demand in real-time, ensuring grid stability. Improvements in battery storage systems, which can store excess energy from renewables, make VPPs more efficient by allowing energy to be dispatched when demand is high, even when renewable generation is low. VPPs allow energy producers and consumers to optimize energy usage and reduce costs through demand-side management. Additionally, excess energy can be sold back to the grid, creating new revenue streams.
Restraint:
- Perception of High Initial Investment Costs and Data Privacy Concerns
Setting up a VPP requires significant investment in hardware (e.g., energy storage, renewable generation) and software (e.g., aggregation platforms, real-time control systems). This high initial cost can deter potential adopters, particularly smaller entities or regions with limited financial resources. VPPs rely heavily on digital infrastructure and cloud-based systems, making them susceptible to cyberattacks. Any breach or disruption in these systems could affect grid stability, creating concerns about data security and the reliability of VPPs.
Opportunity:
⮚ Rising Demand for Energy Efficiency
VPPs can optimize energy consumption, reduce waste, and improve overall grid efficiency. This creates opportunities for businesses and utilities seeking to lower operational costs and enhance energy efficiency in both residential and industrial applications. VPPs are well-positioned to capitalize on the global trend toward smart grid development. Smart grid technologies, including IoT and advanced metering infrastructure, offer new possibilities for real-time monitoring, automation, and optimization of distributed energy resources through VPPs.
Virtual Power Plant Market Segment Overview
By Technology Type
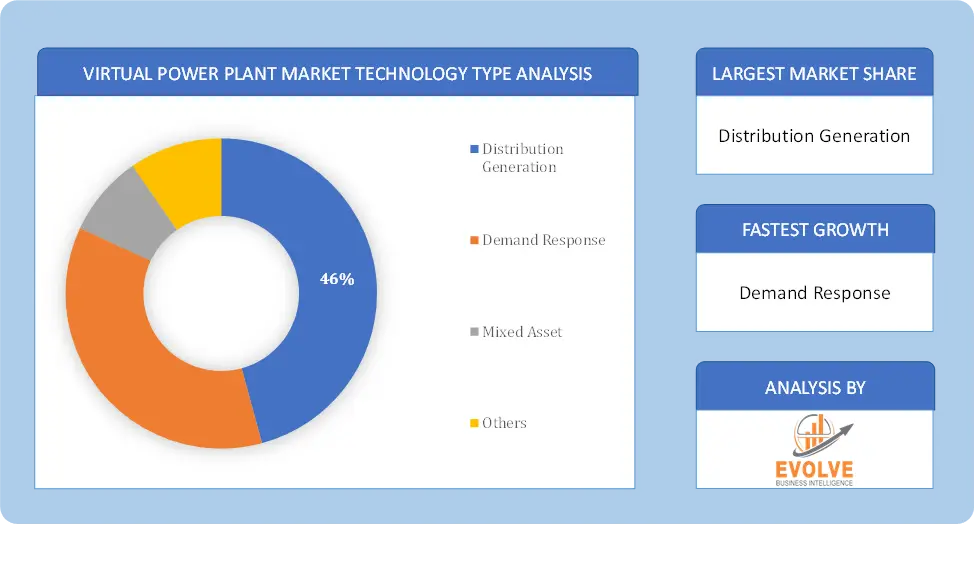
 Based on Technology Type, the market is segmented based on Distribution Generation, Demand Response, Mixed Asset and Others. The demand response segment dominant the market. The demand for demand response will rise due to grid modernization and the burgeoning virtual power plant business. Because smart devices are being used more frequently to control customer-sited loads, the mixed asset market is anticipated to increase faster.
By Application
Based on Application, the market segment has been divided into Commercial, Industrial, Residential and Others. The industrial segment dominant the market. The industrial sector, comprising manufacturing facilities, large-scale commercial buildings, and industrial complexes, exhibited a significant adoption of VPP solutions. These entities recognized the immense benefits of VPPs, such as enhanced energy efficiency, reduced operational costs, and optimized power utilization. Moreover, energy efficiency and high reliability during peak load made Virtual power plants worthy for the industrial segment.
Global Virtual Power Plant Market Regional Analysis
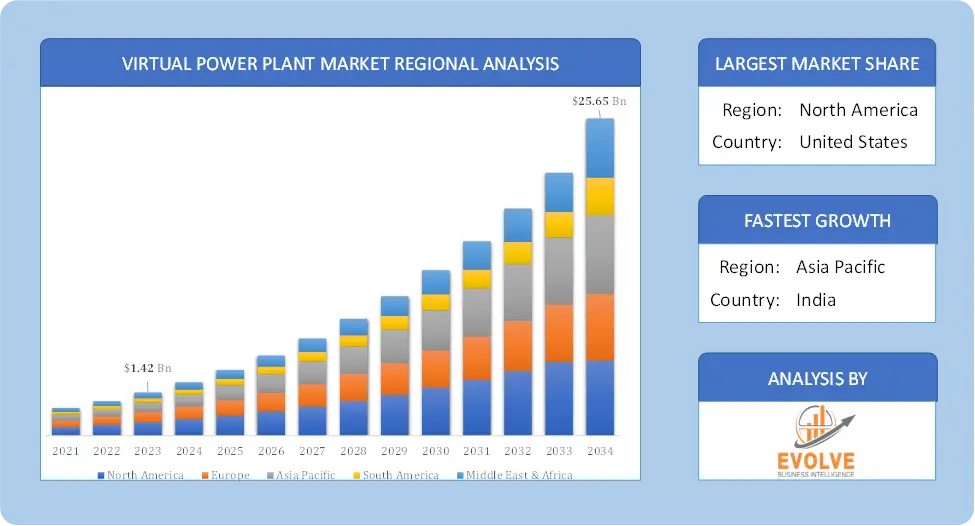
Based on region, the global Virtual Power Plant Market has been divided into North America, Europe, Asia-Pacific, the Middle East & Africa, and Latin America. North America is projected to dominate the use of the Virtual Power Plant Market followed by the Asia-Pacific and Europe regions.
 Virtual Power Plant North America Market
North America holds a dominant position in the Virtual Power Plant Market. The VPP market in North America is driven by the increasing adoption of renewable energy, a mature smart grid infrastructure, and favorable government policies that promote decarbonization and the U.S. has a strong focus on grid modernization, integrating distributed energy resources (DERs), and demand-response programs. The California market is particularly advanced, with extensive renewable energy projects and regulatory support for VPPs.
Virtual Power Plant Asia-Pacific Market
The Asia-Pacific region has indeed emerged as the fastest-growing market for the Virtual Power Plant Market industry. The Asia-Pacific region is experiencing fast growth in the VPP market, primarily driven by increasing renewable energy investments, energy storage adoption, and the need for grid resilience in densely populated areas and China is a major player in the VPP market due to its large-scale renewable energy projects, particularly in wind and solar power. The Chinese government’s focus on smart grids and decentralized energy systems is fostering VPP growth.
Competitive Landscape
The global Virtual Power Plant Market is highly competitive, with numerous players offering a wide range of software solutions. The competitive landscape is characterized by the presence of established companies, as well as emerging startups and niche players. To increase their market position and attract a wide consumer base, the businesses are employing various strategies, such as product launches, and strategic alliances.
Prominent Players:
- ABB Ltd.
- AGL Energy
- AutoGrid Systems, Inc.
- Enbala Power Networks
- Enel X Inc.
- General Electric Company
- Siemens AG
- Schneider Electric SE
- Flexitricity
- Limejump Ltd
Key Development
In September 2020, Tesla announced the launch of phase 3 of its virtual power plant in South Australia, connecting 4,000 homes with Powerwalls and solar panels. The project aims to enhance grid reliability and sustainability through residential solar generation and energy storage.
Scope of the Report
Global Virtual Power Plant Market, by Technology Type
- Distribution Generation
- Demand Response
- Mixed Asset
- Others
Global Virtual Power Plant Market, by Application
- Commercial
- Industrial
- Residential
- Others
Global Virtual Power Plant Market, by Region
- North America
- US
- Canada
- Mexico
- Europe
- UK
- Germany
- France
- Italy
- Spain
- Benelux
- Nordic
- Rest of Europe
- Asia Pacific
- China
- Japan
- South Korea
- Indonesia
- Austalia
- Malaysia
- India
- Rest of Asia Pacific
- South America
- Brazil
- Argentina
- Rest of South America
- Middle East & Africa
- Saudi Arabia
- UAE
- Egypt
- South Africa
- Rest of Middle East & Africa
| Parameters | Indicators |
|---|---|
| Market Size | 2033: $25.65 Billion |
| CAGR | 37.01% CAGR (2023-2033) |
| Base year | 2022 |
| Forecast Period | 2023-2033 |
| Historical Data | 2021 |
| Report Coverage | Revenue Forecast, Competitive Landscape, Growth Factors, and Trends |
| Key Segmentations | Technology Type, Application |
| Geographies Covered | North America, Europe, Asia-Pacific, Latin America, Middle East, Africa |
| Key Vendors | ABB Ltd., AGL Energy, AutoGrid Systems Inc., Enbala Power Networks, Enel X Inc., General Electric Company, Siemens AG, Schneider Electric SE, Flexitricity and Limejump Ltd |
| Key Market Opportunities | • Rising Demand for Energy Efficiency • Grid Modernization and Smart Grid Integration |
| Key Market Drivers | • Grid Stability and Flexibility Needs • Advancements in Energy Storage Technology |
REPORT CONTENT BRIEF:
- High-level analysis of the current and future Virtual Power Plant Market trends and opportunities
- Detailed analysis of current market drivers, restraining factors, and opportunities in the future
- Virtual Power Plant Market historical market size for the year 2021, and forecast from 2023 to 2033
- Virtual Power Plant Market share analysis at each product level
- Competitor analysis with detailed insight into its product segment, Government & Defense strength, and strategies adopted.
- Identifies key strategies adopted including product launches and developments, mergers and acquisitions, joint ventures, collaborations, and partnerships as well as funding taken and investment done, among others.
- To identify and understand the various factors involved in the global Virtual Power Plant Market affected by the pandemic
- To provide a detailed insight into the major companies operating in the market. The profiling will include the Government & Defense health of the company’s past 2-3 years with segmental and regional revenue breakup, product offering, recent developments, SWOT analysis, and key strategies.
Press Release

Global Pharmaceutical Manufacturing Market to Reach $1.38 Trillion by 2035 with 7.35% CAGR, New Research Shows

The Global Mammography Market Is Estimated To Record a CAGR of Around 10.29% During The Forecast Period

Glue Stick Market to Reach USD 2.35 Billion by 2034

Podiatry Service Market to Reach USD 11.88 Billion by 2034

Microfluidics Technology Market to Reach USD 32.58 Billion by 2034

Ferric Chloride Market to Reach USD 10.65 Billion by 2034

Family Practice EMR Software Market to Reach USD 21.52 Billion by 2034

Electric Hairbrush Market to Reach USD 15.95 Billion by 2034

Daily Bamboo Products Market to Reach USD 143.52 Billion by 2034

Cross-border E-commerce Logistics Market to Reach USD 112.65 Billion by 2034
Frequently Asked Questions (FAQ)
What is the study period of this market?
The study period of the global Virtual Power Plant Market is 2021- 2033
What is the growth rate of the global Virtual Power Plant Market?
The global Virtual Power Plant Market is growing at a CAGR of 37.01% over the next 10 years
Which region has the highest growth rate in the market of Virtual Power Plant Market?
Asia Pacific is expected to register the highest CAGR during 2024-2034
Which region has the largest share of the global Virtual Power Plant Market?
North America holds the largest share in 2022
Who are the key players in the global Virtual Power Plant Market?
ABB Ltd., AGL Energy, AutoGrid Systems Inc., Enbala Power Networks, Enel X Inc., General Electric Company, Siemens AG, Schneider Electric SE, Flexitricity and Limejump Ltd are the major companies operating in the market.
Do you offer Post Sale Support?
Yes, we offer 16 hours of analyst support to solve the queries
Do you sell particular sections of a report?
Yes, we provide regional as well as country-level reports. Other than this we also provide a sectional report. Please get in contact with our sales representatives
Table of Content
Chapter 1. Executive Summary Chapter 2. Scope of The Study 2.1. Market Definition 2.2. Scope of The Study 2.2.1. Objectives of Report Chapter 3. Evolve BI Methodology Chapter 4. Market Insights and Trends 4.1. Supply/ Value Chain Analysis 4.2. Porter’s Five Forces Analysis 4.2.1. Threat of New Entrants 4.2.2. Bargaining Power of Buyers 4.2.3. Bargaining Power of Suppliers 4.2.4. Threat of Substitutes 4.2.5. Industry Rivalry 4.3. Impact of COVID-19 on Virtual Power Plant Market 4.3.1. Impact on Market Size 4.3.2. End User Trend, Preferences and Budget Impact 4.3.3. Regulatory Framework/Government Policies 4.3.4. Key Players Strategy to Tackle Negative Impact 4.3.5. Opportunity Window Chapter 5. Market Dynamics 5.1. Introduction 5.2. DRO Analysis 5.2.1. Drivers 5.2.2. Restraints 5.2.3. Opportunities Chapter 6. Global Virtual Power Plant Market, By Technology Type 6.1. Introduction 6.2. Distribution Generation 6.3. Demand Response 6.4. Mixed Asset 6.5. Others Chapter 7. Global Virtual Power Plant Market, By Application 7.1. Introduction 7.2. Commercial 7.3. Industrial 7.4. Residential 7.5. Others Chapter 8. Global Virtual Power Plant Market, By Region 8.1. Introduction 8.2. North America 8.2.1. Introduction 8.2.2. Driving Factors, Opportunity Analyzed and Key Trends 8.2.3. Market Size and Forecast, By Country, 2020 - 2028 8.2.4. Market Size and Forecast, By Technology Type, 2020 - 2028 8.2.5. Market Size and Forecast, By Application, 2020 – 2026 8.2.6. US 8.2.6.1. Introduction 8.2.6.2. Driving Factors, Opportunity Analyzed and Key Trends 8.2.6.3. Market Size and Forecast, By Technology Type, 2020 - 2028 8.2.6.4. Market Size and Forecast, By Application, 2020 - 2028 8.2.7. Canada 8.2.7.1. Introduction 8.2.7.2. Driving Factors, Opportunity Analyzed and Key Trends 8.2.7.3. Market Size and Forecast, By Technology Type, 2020 - 2028 8.2.7.4. Market Size and Forecast, By Application, 2020 - 2028 8.3. Europe 8.3.1. Introduction 8.3.2. Driving Factors, Opportunity Analyzed and Key Trends 8.3.3. Market Size and Forecast, By Country, 2020 - 2028 8.3.4. Market Size and Forecast, By Technology Type, 2020 - 2028 8.3.5. Market Size and Forecast, By Application, 2020 – 2026 8.3.6. Germany 8.3.6.1. Introduction 8.3.6.2. Driving Factors, Opportunity Analyzed and Key Trends 8.3.6.3. Market Size and Forecast, By Technology Type, 2020 - 2028 8.3.6.4. Market Size and Forecast, By Application, 2020 - 2028 8.3.7. France 8.3.7.1. Introduction 8.3.7.2. Driving Factors, Opportunity Analyzed and Key Trends 8.3.7.3. Market Size and Forecast, By Technology Type, 2020 - 2028 8.3.7.4. Market Size and Forecast, By Application, 2020 - 2028 8.3.8. UK 8.3.8.1. Introduction 8.3.8.2. Driving Factors, Opportunity Analyzed and Key Trends 8.3.8.3. Market Size and Forecast, By Technology Type, 2020 - 2028 8.3.8.4. Market Size and Forecast, By Application, 2020 - 2028 8.3.9. Italy 8.3.9.1. Introduction 8.3.9.2. Driving Factors, Opportunity Analyzed and Key Trends 8.3.9.3. Market Size and Forecast, By Technology Type, 2020 - 2028 8.3.9.4. Market Size and Forecast, By Application, 2020 - 2028 8.3.10. Rest of Europe 8.3.10.1. Introduction 8.3.10.2. Driving Factors, Opportunity Analyzed and Key Trends 8.3.10.3. Market Size and Forecast, By Technology Type, 2020 - 2028 8.3.10.4. Market Size and Forecast, By Application, 2020 - 2028 8.4. Asia-Pacific 8.4.1. Introduction 8.4.2. Driving Factors, Opportunity Analyzed and Key Trends 8.4.3. Market Size and Forecast, By Country, 2020 - 2028 8.4.4. Market Size and Forecast, By Technology Type, 2020 - 2028 8.4.5. Market Size and Forecast, By Application, 2020 - 2028 8.4.6. China 8.4.6.1. Introduction 8.4.6.2. Driving Factors, Opportunity Analyzed and Key Trends 8.4.6.3. Market Size and Forecast, By Technology Type, 2020 - 2028 8.4.6.4. Market Size and Forecast, By Application, 2020 - 2028 8.4.7. India 8.4.7.1. Introduction 8.4.7.2. Driving Factors, Opportunity Analyzed and Key Trends 8.4.7.3. Market Size and Forecast, By Technology Type, 2020 - 2028 8.4.7.4. Market Size and Forecast, By Application, 2020 - 2028 8.4.8. Japan 8.4.8.1. Introduction 8.4.8.2. Driving Factors, Opportunity Analyzed and Key Trends 8.4.8.3. Market Size and Forecast, By Technology Type, 2020 - 2028 8.4.8.4. Market Size and Forecast, By Application, 2020 - 2028 8.4.9. South Korea 8.4.9.1. Introduction 8.4.9.2. Driving Factors, Opportunity Analyzed and Key Trends 8.4.9.3. Market Size and Forecast, By Technology Type, 2020 - 2028 8.4.9.4. Market Size and Forecast, By Application, 2020 - 2028 8.4.10. Rest of Asia-Pacific 8.4.10.1. Introduction 8.4.10.2. Driving Factors, Opportunity Analyzed and Key Trends 8.4.10.3. Market Size and Forecast, By Technology Type, 2020 - 2028 8.4.10.4. Market Size and Forecast, By Application, 2020 - 2028 8.5. Rest of The World (RoW) 8.5.1. Introduction 8.5.2. Driving Factors, Opportunity Analyzed and Key Trends 8.5.3. Market Size and Forecast, By Technology Type, 2020 - 2028 8.5.4. Market Size and Forecast, By Application, 2020 - 2028 8.5.5. Market Size and Forecast, By Region, 2020 - 2028 8.5.6. South America 8.5.6.1. Introduction 8.5.6.2. Driving Factors, Opportunity Analyzed and Key Trends 8.5.6.3. Market Size and Forecast, By Technology Type, 2020 - 2028 8.5.6.4. Market Size and Forecast, By Application, 2020 - 2028 8.5.7. Middle East and Africa 8.5.7.1. Introduction 8.5.7.2. Driving Factors, Opportunity Analyzed and Key Trends 8.5.7.3. Market Size and Forecast, By Technology Type, 2020 - 2028 8.5.7.4. Market Size and Forecast, By Application, 2020 - 2028 Chapter 9. Competitive Landscape 9.1. Introduction 9.2. Vendor Share Analysis, 2020/Key Players Positioning, 2020 Chapter 10. Company Profiles 10.1. ABB Ltd. 10.1.1. Business Overview 10.1.2. Financial Analysis 10.1.3. Technology Portfolio 10.1.4. Recent Development and Strategies Adopted 10.1.5. SWOT Analysis 10.2. AGL Energy 10.2.1. Business Overview 10.2.2. Financial Analysis 10.2.3. Technology Portfolio 10.2.4. Recent Development and Strategies Adopted 10.2.5. SWOT Analysis 10.3. AutoGrid Systems, Inc. 10.3.1. Business Overview 10.3.2. Financial Analysis 10.3.3. Technology Portfolio 10.3.4. Recent Development and Strategies Adopted 10.3.5. SWOT Analysis 10.4. Enbala Power Networks 10.4.1. Business Overview 10.4.2. Financial Analysis 10.4.3. Technology Portfolio 10.4.4. Recent Development and Strategies Adopted 10.4.5. SWOT Analysis 10.5. Enel X Inc. 10.5.1. Business Overview 10.5.2. Financial Analysis 10.5.3. Technology Portfolio 10.5.4. Recent Development and Strategies Adopted 10.5.5. SWOT Analysis 10.6. General Electric Company 10.6.1. Business Overview 10.6.2. Financial Analysis 10.6.3. Technology Portfolio 10.6.4. Recent Development and Strategies Adopted 10.6.5. SWOT Analysis 10.7. Siemens AG 10.7.1. Business Overview 10.7.2. Financial Analysis 10.7.3. Technology Portfolio 10.7.4. Recent Development and Strategies Adopted 10.7.5. SWOT Analysis 10.8. Schneider Electric SE 10.8.1. Business Overview 10.8.2. Financial Analysis 10.8.3. Technology Portfolio 10.8.4. Recent Development and Strategies Adopted 10.8.5. SWOT Analysis 10.9. Flexitricity 10.9.1. Business Overview 10.9.2. Financial Analysis 10.9.3. Technology Portfolio 10.9.4. Recent Development and Strategies Adopted 10.9.5. SWOT Analysis 10.10. Limejump Ltd 10.10.1. Business Overview 10.10.2. Financial Analysis 10.10.3. Technology Portfolio 10.10.4. Recent Development and Strategies Adopted 10.10.5. SWOT Analysis Chapter 11. Key Takeaways
Connect to Analyst
Research Methodology


