Sustainable Aviation Fuel Market Analysis and Global Forecast 2023-2033
Price range: $ 1,390.00 through $ 5,520.00
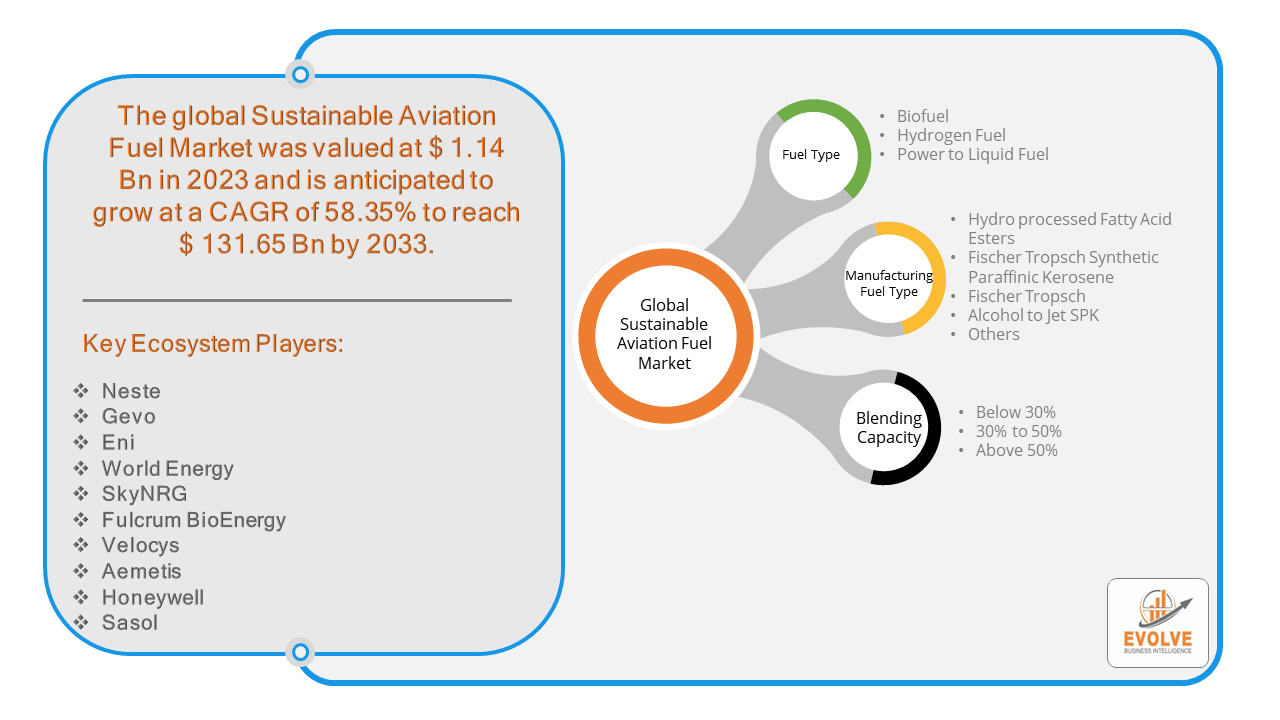
Sustainable Aviation Fuel Market Research Report: Information By fuel type (Biofuel, Hydrogen Fuel, Power to Liquid Fuel), By Manufacturing fuel type (Hydro processed Fatty Acid Esters, Fischer Tropsch Synthetic Paraffinic Kerosene, Fischer Tropsch, Alcohol to Jet SPK, Others), By Blending Capacity (Below 30%, 30% to 50%, Above 50%), and by Region — Forecast till 2033
Page: 178
Sustainable Aviation Fuel Market Overview
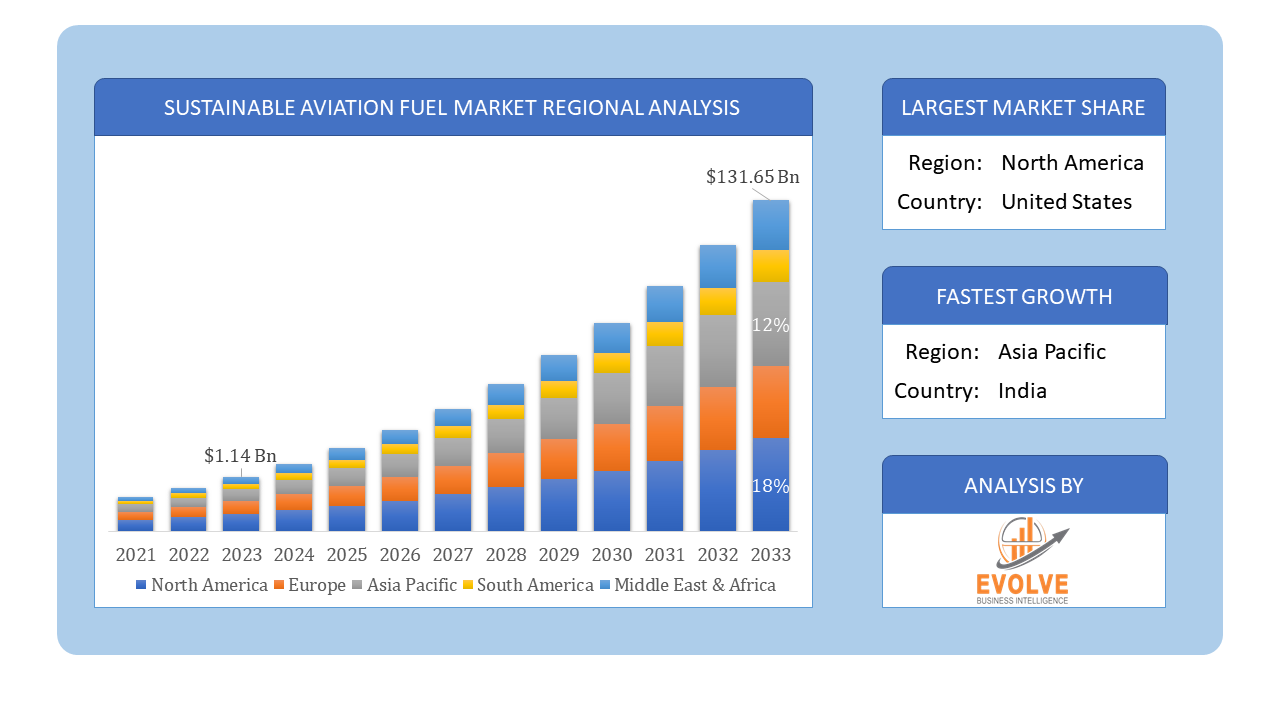
The Sustainable Aviation Fuel Market Size is expected to reach USD 131.65 Billion by 2033. The Sustainable Aviation Fuel Market industry size accounted for USD 1.14 Billion in 2023 and is expected to expand at a compound annual growth rate (CAGR) of 58.35% from 2023 to 2033. The Sustainable Aviation Fuel (SAF) Market refers to the market for alternative aviation fuels that are produced sustainably, typically from renewable resources such as biomass, waste oils, or synthetic processes that minimize carbon emissions. SAF aims to reduce the aviation industry’s carbon footprint by offering lower or net-zero carbon emissions compared to conventional jet fuels derived from fossil fuels. This market is gaining traction due to increasing environmental regulations and initiatives aimed at reducing greenhouse gas emissions in aviation.
This is due to the increasing demand for sustainable travel and the falling production costs of SAF. The growth of this market will help to reduce greenhouse gas emissions from aviation and make air travel more sustainable.
Global Sustainable Aviation Fuel Market Synopsis
 COVID-19 Impact Analysis
The COVID-19 pandemic had a significant impact on the Sustainable Aviation Fuel (SAF) Market. During the height of the pandemic, global air travel plummeted due to travel restrictions and reduced demand. This led to decreased consumption of jet fuel, including SAF, as airlines grounded flights and focused on cost-cutting measures. The pandemic also highlighted the aviation industry’s vulnerability to global crises and intensified efforts towards sustainability. Governments and aviation stakeholders increasingly focused on recovery plans that included investments in SAF as part of broader environmental goals. Many governments introduced or strengthened policies supporting SAF production and adoption post-pandemic as part of economic recovery and climate change mitigation strategies. This has contributed to renewed interest and investments in the SAF market. The SAF market faced supply chain disruptions and logistical challenges during the pandemic, affecting production and distribution.
Sustainable Aviation Fuel Market Dynamics
The major factors that have impacted the growth of Sustainable Aviation Fuel Market are as follows:
Drivers:
Ø Technological Advancements
Advances in technology have made SAF production more efficient and cost-effective. Innovations in feedstock sourcing, conversion processes (such as biomass-to-liquid and synthetic fuels), and distribution infrastructure are reducing barriers to entry. Government subsidies, tax credits, and financial incentives encourage investment in SAF production and usage. These incentives help mitigate the higher costs associated with SAF compared to conventional jet fuels. Growing public awareness and concern about climate change are influencing consumer choices and putting pressure on industries, including aviation, to adopt sustainable practices. This shift in consumer sentiment can drive demand for SAF among airlines and passengers.
Restraint:
- Perception of High Production Costs
SAF currently has higher production costs compared to conventional jet fuels, primarily due to limited economies of scale and higher costs associated with feedstock procurement, processing, and refining. This cost barrier limits widespread adoption, especially without substantial government subsidies or incentives. Fluctuations in crude oil prices can impact the economic competitiveness of SAF relative to conventional jet fuels. Price volatility and market uncertainties can deter long-term investments in SAF production and adoption.
Opportunity:
⮚ Corporate Sustainability Commitments
Airlines and aviation stakeholders are increasingly integrating sustainability into their business strategies. Corporate sustainability commitments, including carbon neutrality pledges and ESG goals, drive demand for SAF as a key component of achieving environmental targets. Ongoing advancements in SAF production technologies, such as synthetic fuels and advanced biofuels, are improving efficiency and reducing production costs. Innovations in feedstock sourcing and conversion processes enhance scalability and competitiveness in the market. Increasing public awareness of climate change and sustainability is driving demand for greener aviation options. Consumer preferences and corporate responsibility initiatives are influencing airlines to offer SAF as a choice, creating a market pull for sustainable alternatives.
Sustainable Aviation Fuel Market Segment Overview
By Fuel Type
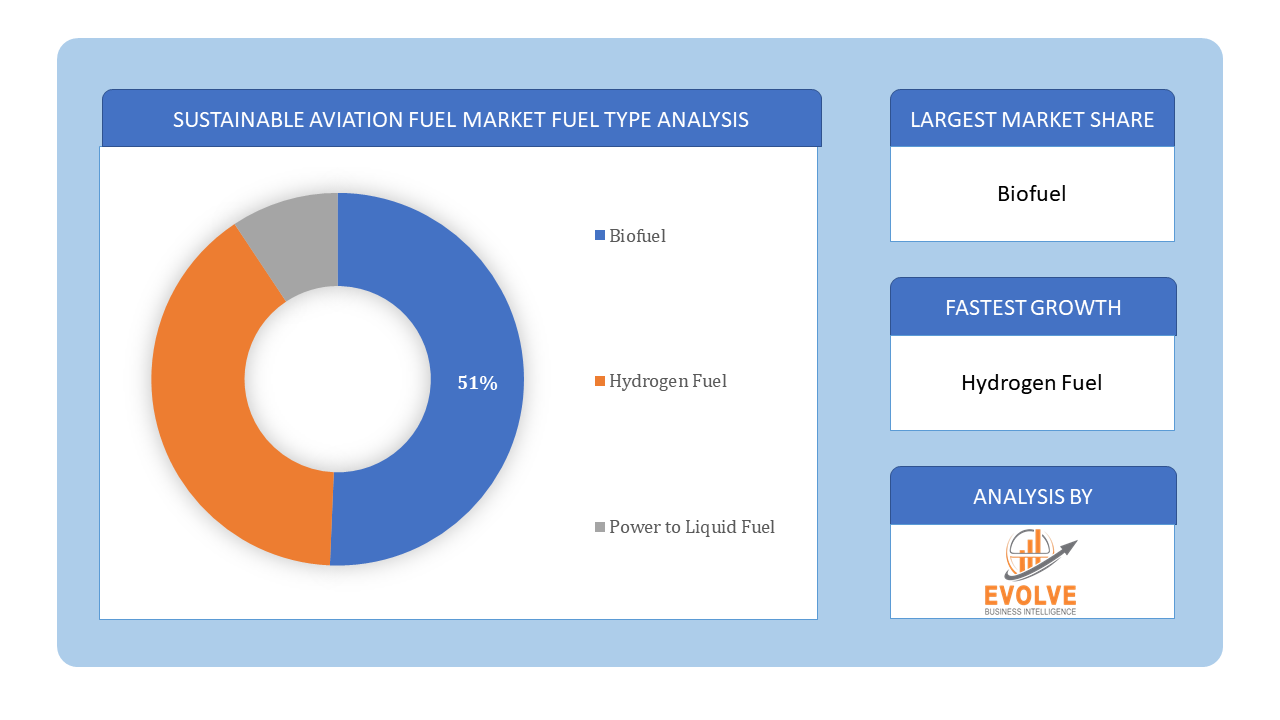 Based on Fuel Type, the market is segmented based on Biofuel, Hydrogen Fuel and Power to Liquid Fuel. The biofuel segment dominated the market. Technologies for producing biofuels have been created and improved over time, becoming economically viable. The fact that biofuels rule the market in large part is due to the established infrastructure and production methods.
By Manufacturing Fuel Type
Based on Manufacturing Fuel Type, the market segment has been divided into the Hydro processed Fatty Acid Esters, Fischer Tropsch Synthetic Paraffinic Kerosene, Fischer Tropsch, Alcohol to Jet SPK and Others. The Fischer Tropsch Synthetic Paraffinic Kerosene segment dominant the market. Coal, natural gas, or biomass feedstocks have been gasified into syngas of hydrogen and carbon monoxide in the FTSPK process. In the FT reactor, this syngas is enzymatically transformed into a liquid hydrocarbon fuel mixing component. The raw material used in the kerosene process includes wood waste, municipal solid waste, and grass.
By Blending Capacity
Based on Blending Capacity, the market segment has been divided into the Below 30%, 30% to 50% and Above 50%. The 30% to 50% segment dominated the market. In order to suit the needs of both commercial and military aviation, drop-in capability, moderate blend capacity, supply logistics transportation, and aircraft fleet enable lower overall costs.
Global Sustainable Aviation Fuel Market Regional Analysis
Based on region, the global Sustainable Aviation Fuel Market has been divided into North America, Europe, Asia-Pacific, the Middle East & Africa, and Latin America. North America is projected to dominate the use of the Sustainable Aviation Fuel Market followed by the Asia-Pacific and Europe regions.
 North America Market
North America holds a dominant position in the Sustainable Aviation Fuel Market. The United States and Canada are significant players in the SAF market, driven by a combination of regulatory support, corporate sustainability goals, and research investments. States like California have implemented Low Carbon Fuel Standards (LCFS) that incentivize SAF production and use.
Asia-Pacific Market
The Asia-Pacific region has indeed emerged as the fastest-growing market for the Sustainable Aviation Fuel Market industry. Countries like Japan, Australia, and Singapore are emerging as key markets for SAF, supported by government initiatives and growing airline commitments to sustainability. Japan, for instance, has launched programs to promote bio jet fuels and hydrogen-based SAF.
Competitive Landscape
The global Sustainable Aviation Fuel Market is highly competitive, with numerous players offering a wide range of software solutions. The competitive landscape is characterized by the presence of established companies, as well as emerging startups and niche players. To increase their market position and attract a wide consumer base, the businesses are employing various strategies, such as product launches, and strategic alliances.
Prominent Players:
- Neste
- Gevo
- Eni
- World Energy
- SkyNRG
- Fulcrum BioEnergy
- Velocys
- Aemetis
- Honeywell
- Sasol
Key Development
In, January 2022, Cepsa approved a contract with Iberia and Iberia Express for the development and mass production of sustainable aviation fuel. According to the agreement, SAF must be generated from waste, recovered oils, and second-generation plant-based biofeedstock.
In March 2022, Neste Company and DHL Express unveiled the biggest SAF transactions ever. One of the most significant sustainable aviation fuel contracts in the aviation sector, this arrangement represents Neste’s most noticeable SAF. Global connectivity from this partnership will improve Neste’s current web.
Scope of the Report
Global Sustainable Aviation Fuel Market, by Fuel Type
- Biofuel
- Hydrogen Fuel
- Power to Liquid Fuel
Global Sustainable Aviation Fuel Market, by Manufacturing Fuel Type
- Hydro processed Fatty Acid Esters
- Fischer Tropsch Synthetic Paraffinic Kerosene
- Fischer Tropsch
- Alcohol to Jet SPK
- Others
Global Sustainable Aviation Fuel Market, by Blending Capacity
- Below 30%
- 30% to 50%
- Above 50%
Global Sustainable Aviation Fuel Market, by Region
- North America
- US
- Canada
- Mexico
- Europe
- UK
- Germany
- France
- Italy
- Spain
- Benelux
- Nordic
- Rest of Europe
- Asia Pacific
- China
- Japan
- South Korea
- Indonesia
- Austalia
- Malaysia
- India
- Rest of Asia Pacific
- South America
- Brazil
- Argentina
- Rest of South America
- Middle East & Africa
- Saudi Arabia
- UAE
- Egypt
- South Africa
- Rest of Middle East & Africa
| Parameters | Indicators |
|---|---|
| Market Size | 2033: $131.65 Billion |
| CAGR | 58.35% CAGR (2023-2033) |
| Base year | 2022 |
| Forecast Period | 2023-2033 |
| Historical Data | 2021 |
| Report Coverage | Revenue Forecast, Competitive Landscape, Growth Factors, and Trends |
| Key Segmentations | Fuel Type, Manufacturing Fuel Type, Blending Capacity |
| Geographies Covered | North America, Europe, Asia-Pacific, Latin America, Middle East, Africa |
| Key Vendors | Neste, Gevo, Eni, World Energy, SkyNRG, Fulcrum BioEnergy, Velocys, Aemetis, Honeywell and Sasol |
| Key Market Opportunities | • Corporate Sustainability Commitments • Public Awareness and Consumer Demand |
| Key Market Drivers | • Technological Advancements • Public and Consumer Awareness |
REPORT CONTENT BRIEF:
- High-level analysis of the current and future Sustainable Aviation Fuel Market trends and opportunities
- Detailed analysis of current market drivers, restraining factors, and opportunities in the future
- Sustainable Aviation Fuel Market historical market size for the year 2021, and forecast from 2023 to 2033
- Sustainable Aviation Fuel Market share analysis at each product level
- Competitor analysis with detailed insight into its product segment, Government & Defense strength, and strategies adopted.
- Identifies key strategies adopted including product launches and developments, mergers and acquisitions, joint ventures, collaborations, and partnerships as well as funding taken and investment done, among others.
- To identify and understand the various factors involved in the global Sustainable Aviation Fuel Market affected by the pandemic
- To provide a detailed insight into the major companies operating in the market. The profiling will include the Government & Defense health of the company’s past 2-3 years with segmental and regional revenue breakup, product offering, recent developments, SWOT analysis, and key strategies.
Frequently Asked Questions (FAQ)
2.What is the growth rate of the global Sustainable Aviation Fuel Market?
- The global Sustainable Aviation Fuel Market is growing at a CAGR of 58.35% over the next 10 years
3.Which region has the highest growth rate in the market of Sustainable Aviation Fuel Market?
- Asia Pacific is expected to register the highest CAGR during 2023-2033
4.Which region has the largest share of the global Sustainable Aviation Fuel Market?
- North America holds the largest share in 2022
5.Who are the key players in the global Sustainable Aviation Fuel Market?
Neste, Gevo, Eni, World Energy, SkyNRG, Fulcrum BioEnergy, Velocys, Aemetis, Honeywell and Sasol. are the major companies operating in the market
6.Do you offer Post Sale Support?
- Yes, we offer 16 hours of analyst support to solve the queries
7.Do you sell particular sections of a report?
Yes, we provide regional as well as country-level reports. Other than this we also provide a sectional report. Please get in contact with our sales representatives
Press Release

Global Pharmaceutical Manufacturing Market to Reach $1.38 Trillion by 2035 with 7.35% CAGR, New Research Shows
The Global Mammography Market Is Estimated To Record a CAGR of Around 10.29% During The Forecast Period
Glue Stick Market to Reach USD 2.35 Billion by 2034
Podiatry Service Market to Reach USD 11.88 Billion by 2034
Microfluidics Technology Market to Reach USD 32.58 Billion by 2034
Ferric Chloride Market to Reach USD 10.65 Billion by 2034
Family Practice EMR Software Market to Reach USD 21.52 Billion by 2034
Electric Hairbrush Market to Reach USD 15.95 Billion by 2034
Daily Bamboo Products Market to Reach USD 143.52 Billion by 2034
Cross-border E-commerce Logistics Market to Reach USD 112.65 Billion by 2034
Table of Content
CHAPTER 1. Executive Summary CHAPTER 2. Scope of the Study 2.1. Market Definition 2.2. Market Scope & Segmentation 2.2.1. Objective of Report CHAPTER 3. Evolve BI Methodology 3.1. Data Collection & Validation Approach 3.2. Market Size Estimation and Forecast CHAPTER 4. Exclusive Analysis 4.1. Market Opportunity Score 4.1.1. Fuel Type Segement – Market Opportunity Score 4.1.2. Manufacturing Fuel Types Segment – Market Opportunity Score 4.1.3. Blending Capacity Segment – Market Opportunity Score 4.2. Key Market Influencing Indicators CHAPTER 5. Market Insights and Trends 5.1. Value Chain Analysis 5.1.1. Raw Material 5.1.2. Manufacturing Process 5.1.3. Distribution Channel 5.1.4. End User 5.2. Porter’s Five Forces Analysis 5.2.1. Bargaining Power of Buyers 5.2.2. Bargaining Power of Suppliers 5.2.3. Threat of New Entrant 5.2.4. Threat of Substitute 5.2.5. Industry Rivalry 5.3. COVID-19 Impact and Post COVID Scenario on Sustainable Aviation Fuel Market 5.3.1. Impact of COVID-19 5.3.2. Government Support and Industry Revival Policies 5.3.3. Measures Taken by Companies to Mitigate Negative Impact 5.3.4. Post COVID Trend CHAPTER 6. Market Dynamics 6.1. Introduction 6.2. Drivers 6.2.1. Driver 1 6.2.2. Driver 2 6.2.3. Driver 3 6.3. Restraints 6.3.1. Restraint 1 6.3.2. Restraint 2 6.4. Opportunity 6.4.1. Opportunity 1 CHAPTER 7. Sustainable Aviation Fuel Market, By Fuel Type 7.1. Introduction 7.1.1. Biofuel 7.1.2. Hydrogen Fuel 7.1.3. Power to Liquid Fuel CHAPTER 8 Sustainable Aviation Fuel Market, By Manufacturing Fuel Types 8.1. Introduction 8.1.1. Hydro processed Fatty Acid Esters 8.1.2. Fischer Tropsch Synthetic Paraffinic Kerosene 8.1.3. Fischer Tropsch 8.1.4. Alcohol to Jet SPK 8.1.5. Others CHAPTER 9. Sustainable Aviation Fuel Market, By Blending Capacity 9.1. Introduction 9.1.1. Below 30% 9.1.2 30% to 50% 9.1.3 Above 50% CHAPTER 10. Sustainable Aviation Fuel Market, By Region 10.1. Introduction 10.2. NORTH AMERICA 10.2.1. North America: Market Size and Forecast, By Country, 2023 – 2033 ($ Million) 10.2.2. North America: Market Size and Forecast, By Fuel Type, 2023 – 2033 ($ Million) 10.2.3. North America: Market Size and Forecast, By Manufacturing Fuel Types, 2023 – 2033 ($ Million) 10.2.4. North America: Market Size and Forecast, By Blending Capacity, 2023 – 2033 ($ Million) 10.2.5. US 10.2.5.1. US: Market Size and Forecast, By Fuel Type, 2023 – 2033 ($ Million) 10.2.5.2. US: Market Size and Forecast, By Manufacturing Fuel Types, 2023 – 2033 ($ Million) 10.2.5.3. US: Market Size and Forecast, By Blending Capacity, 2023 – 2033 ($ Million) 10.2.6. CANADA 10.2.6.1. Canada: Market Size and Forecast, By Fuel Type, 2023 – 2033 ($ Million) 10.2.6.2. Canada: Market Size and Forecast, By Manufacturing Fuel Types, 2023 – 2033 ($ Million) 10.2.6.3. Canada: Market Size and Forecast, By Blending Capacity, 2023 – 2033 ($ Million) 10.2.7. MEXICO 10.2.7.1. Mexico: Market Size and Forecast, By Fuel Type, 2023 – 2033 ($ Million) 10.2.7.2. Mexico: Market Size and Forecast, By Manufacturing Fuel Types, 2023 – 2033 ($ Million) 10.2.7.3. Mexico: Market Size and Forecast, By Blending Capacity, 2023 – 2033 ($ Million) 10.3. Europe 10.3.1. Europe: Market Size and Forecast, By Country, 2023 – 2033 ($ Million) 10.3.2. Europe: Market Size and Forecast, By Fuel Type, 2023 – 2033 ($ Million) 10.3.3. Europe: Market Size and Forecast, By Manufacturing Fuel Types, 2023 – 2033 ($ Million) 10.3.4. Europe: Market Size and Forecast, By Blending Capacity, 2023 – 2033 ($ Million) 10.3.5. U.K. 10.3.5.1. U.K.: Market Size and Forecast, By Fuel Type, 2023 – 2033 ($ Million) 10.3.5.2. U.K.: Market Size and Forecast, By Manufacturing Fuel Types, 2023 – 2033 ($ Million) 10.3.5.3. U.K.: Market Size and Forecast, By Blending Capacity, 2023 – 2033 ($ Million) 10.3.6. GERMANY 10.3.6.1. Germany: Market Size and Forecast, By Fuel Type, 2023 – 2033 ($ Million) 10.3.6.2. Germany: Market Size and Forecast, By Manufacturing Fuel Types, 2023 – 2033 ($ Million) 10.3.6.3. Germany: Market Size and Forecast, By Blending Capacity, 2023 – 2033 ($ Million) 10.3.7. FRANCE 10.3.7.1. France: Market Size and Forecast, By Fuel Type, 2023 – 2033 ($ Million) 10.3.7.2. France: Market Size and Forecast, By Manufacturing Fuel Types, 2023 – 2033 ($ Million) 10.3.7.3. France: Market Size and Forecast, By Blending Capacity, 2023 – 2033 ($ Million) 10.3.8. ITALY 10.3.8.1. Italy: Market Size and Forecast, By Fuel Type, 2023 – 2033 ($ Million) 10.3.8.2. Italy: Market Size and Forecast, By Manufacturing Fuel Types, 2023 – 2033 ($ Million) 10.3.8.3. Italy: Market Size and Forecast, By Blending Capacity, 2023 – 2033 ($ Million) 10.3.9. SPAIN 10.3.9.1. Spain: Market Size and Forecast, By Fuel Type, 2023 – 2033 ($ Million) 10.3.9.2. Spain: Market Size and Forecast, By Manufacturing Fuel Types, 2023 – 2033 ($ Million) 10.3.9.3. Spain: Market Size and Forecast, By Blending Capacity, 2023 – 2033 ($ Million) 10.3.10. BENELUX 10.3.10.1. BeNeLux: Market Size and Forecast, By Fuel Type, 2023 – 2033 ($ Million) 10.3.10.2. BeNeLux: Market Size and Forecast, By Manufacturing Fuel Types, 2023 – 2033 ($ Million) 10.3.10.3. BeNeLux: Market Size and Forecast, By Blending Capacity, 2023 – 2033 ($ Million) 10.3.11. RUSSIA 10.3.11.1. Russia: Market Size and Forecast, By Fuel Type, 2023 – 2033 ($ Million) 10.3.11.2. Russia: Market Size and Forecast, By Manufacturing Fuel Types, 2023 – 2033 ($ Million) 10.3.11.3. Russia: Market Size and Forecast, By Blending Capacity, 2023 – 2033 ($ Million) 10.3.12. REST OF EUROPE 10.3.12.1. Rest of Europe: Market Size and Forecast, By Fuel Type, 2023 – 2033 ($ Million) 10.3.12.2. Rest of Europe: Market Size and Forecast, By Manufacturing Fuel Types, 2023 – 2033 ($ Million) 10.3.12.3. Rest of Europe: Market Size and Forecast, By Blending Capacity, 2023 – 2033 ($ Million) 10.4. Asia Pacific 10.4.1. Asia Pacific: Market Size and Forecast, By Country, 2023 – 2033 ($ Million) 10.4.2. Asia Pacific: Market Size and Forecast, By Fuel Type, 2023 – 2033 ($ Million) 10.4.3. Asia Pacific: Market Size and Forecast, By Manufacturing Fuel Types, 2023 – 2033 ($ Million) 10.4.4. Asia Pacific: Market Size and Forecast, By Blending Capacity, 2023 – 2033 ($ Million) 10.4.5. CHINA 10.4.5.1. China: Market Size and Forecast, By Fuel Type, 2023 – 2033 ($ Million) 10.4.5.2. China: Market Size and Forecast, By Manufacturing Fuel Types, 2023 – 2033 ($ Million) 10.4.5.3. China: Market Size and Forecast, By Blending Capacity, 2023 – 2033 ($ Million) 10.4.6. JAPAN 10.4.6.1. Japan: Market Size and Forecast, By Fuel Type, 2023 – 2033 ($ Million) 10.4.6.2. Japan: Market Size and Forecast, By Manufacturing Fuel Types, 2023 – 2033 ($ Million) 10.4.6.3. Japan: Market Size and Forecast, By Blending Capacity, 2023 – 2033 ($ Million) 10.4.7. INDIA 10.4.7.1. India: Market Size and Forecast, By Fuel Type, 2023 – 2033 ($ Million) 10.4.7.2. India: Market Size and Forecast, By Manufacturing Fuel Types, 2023 – 2033 ($ Million) 10.4.7.3. India: Market Size and Forecast, By Blending Capacity, 2023 – 2033 ($ Million) 10.4.8. SOUTH KOREA 10.4.8.1. South Korea: Market Size and Forecast, By Fuel Type, 2023 – 2033 ($ Million) 10.4.8.2. South Korea: Market Size and Forecast, By Manufacturing Fuel Types, 2023 – 2033 ($ Million) 10.4.8.3. South Korea: Market Size and Forecast, By Blending Capacity, 2023 – 2033 ($ Million) 10.4.9. THAILAND 10.4.9.1. Thailand: Market Size and Forecast, By Fuel Type, 2023 – 2033 ($ Million) 10.4.9.2. Thailand: Market Size and Forecast, By Manufacturing Fuel Types, 2023 – 2033 ($ Million) 10.4.9.3. Thailand: Market Size and Forecast, By Blending Capacity, 2023 – 2033 ($ Million) 10.4.10. INDONESIA 10.4.10.1. Indonesia: Market Size and Forecast, By Fuel Type, 2023 – 2033 ($ Million) 10.4.10.2. Indonesia: Market Size and Forecast, By Manufacturing Fuel Types, 2023 – 2033 ($ Million) 10.4.10.3. Indonesia: Market Size and Forecast, By Blending Capacity, 2023 – 2033 ($ Million) 10.4.11. MALAYSIA 10.4.11.1. Malaysia: Market Size and Forecast, By Fuel Type, 2023 – 2033 ($ Million) 10.4.11.2. Malaysia: Market Size and Forecast, By Manufacturing Fuel Types, 2023 – 2033 ($ Million) 10.4.11.3. Malaysia: Market Size and Forecast, By Blending Capacity, 2023 – 2033 ($ Million) 10.4.12. AUSTRALIA 10.4.12.1. Australia: Market Size and Forecast, By Fuel Type, 2023 – 2033 ($ Million) 10.4.12.2. Australia: Market Size and Forecast, By Manufacturing Fuel Types, 2023 – 2033 ($ Million) 10.4.12.3. Australia: Market Size and Forecast, By Blending Capacity, 2023 – 2033 ($ Million) 10.4.13. REST FO ASIA PACIFIC 10.4.13.1. Rest fo Asia Pacific: Market Size and Forecast, By Fuel Type, 2023 – 2033 ($ Million) 10.4.13.2. Rest fo Asia Pacific: Market Size and Forecast, By Manufacturing Fuel Types, 2023 – 2033 ($ Million) 10.4.13.3. Rest fo Asia Pacific: Market Size and Forecast, By Blending Capacity, 2023 – 2033 ($ Million) 10.5. South America 10.5.1. South America: Market Size and Forecast, By Country, 2023 – 2033 ($ Million) 10.5.2. South America: Market Size and Forecast, By Fuel Type, 2023 – 2033 ($ Million) 10.5.3. South America: Market Size and Forecast, By Manufacturing Fuel Types, 2023 – 2033 ($ Million) 10.5.4. South America: Market Size and Forecast, By Blending Capacity, 2023 – 2033 ($ Million) 10.5.5. BRAZIL 10.5.5.1. Brazil: Market Size and Forecast, By Fuel Type, 2023 – 2033 ($ Million) 10.5.5.2. Brazil: Market Size and Forecast, By Manufacturing Fuel Types, 2023 – 2033 ($ Million) 10.5.5.3. Brazil: Market Size and Forecast, By Blending Capacity, 2023 – 2033 ($ Million) 10.5.6. ARGENTINA 10.5.6.1. Argentina: Market Size and Forecast, By Fuel Type, 2023 – 2033 ($ Million) 10.5.6.2. Argentina: Market Size and Forecast, By Manufacturing Fuel Types, 2023 – 2033 ($ Million) 10.5.6.3. Argentina: Market Size and Forecast, By Blending Capacity, 2023 – 2033 ($ Million) 10.5.7. REST OF SOUTH AMERICA 10.5.7.1. Rest of South America: Market Size and Forecast, By Fuel Type, 2023 – 2033 ($ Million) 10.5.7.2. Rest of South America: Market Size and Forecast, By Manufacturing Fuel Types, 2023 – 2033 ($ Million) 10.5.7.3. Rest of South America: Market Size and Forecast, By Blending Capacity, 2023 – 2033 ($ Million) 10.6. Middle East & Africa 10.6.1. Middle East & Africa: Market Size and Forecast, By Country, 2023 – 2033 ($ Million) 10.6.2. Middle East & Africa: Market Size and Forecast, By Fuel Type, 2023 – 2033 ($ Million) 10.6.3. Middle East & Africa: Market Size and Forecast, By Manufacturing Fuel Types, 2023 – 2033 ($ Million) 10.6.4. Middle East & Africa: Market Size and Forecast, By Blending Capacity, 2023 – 2033 ($ Million) 10.6.5. SAUDI ARABIA 10.6.5.1. Saudi Arabia: Market Size and Forecast, By Fuel Type, 2023 – 2033 ($ Million) 10.6.5.2. Saudi Arabia: Market Size and Forecast, By Manufacturing Fuel Types, 2023 – 2033 ($ Million) 10.6.5.3. Saudi Arabia: Market Size and Forecast, By Blending Capacity, 2023 – 2033 ($ Million) 10.6.6. UAE 10.6.6.1. UAE: Market Size and Forecast, By Fuel Type, 2023 – 2033 ($ Million) 10.6.6.2. UAE: Market Size and Forecast, By Manufacturing Fuel Types, 2023 – 2033 ($ Million) 10.6.6.3. UAE: Market Size and Forecast, By Blending Capacity, 2023 – 2033 ($ Million) 10.6.7. EGYPT 10.6.7.1. Egypt: Market Size and Forecast, By Fuel Type, 2023 – 2033 ($ Million) 10.6.7.2. Egypt: Market Size and Forecast, By Manufacturing Fuel Types, 2023 – 2033 ($ Million) 10.6.7.3. Egypt: Market Size and Forecast, By Blending Capacity, 2023 – 2033 ($ Million) 10.6.8. SOUTH AFRICA 10.6.8.1. South Africa: Market Size and Forecast, By Fuel Type, 2023 – 2033 ($ Million) 10.6.8.2. South Africa: Market Size and Forecast, By Manufacturing Fuel Types, 2023 – 2033 ($ Million) 10.6.8.3. South Africa: Market Size and Forecast, By Blending Capacity, 2023 – 2033 ($ Million) 10.6.9. REST OF MIDDLE EAST & AFRICA 10.6.9.1. Rest of Middle East & Africa: Market Size and Forecast, By Fuel Type, 2023 – 2033 ($ Million) 10.6.9.2. Rest of Middle East & Africa: Market Size and Forecast, By Manufacturing Fuel Types, 2023 – 2033 ($ Million) 10.6.9.3. Rest of Middle East & Africa: Market Size and Forecast, By Blending Capacity, 2023 – 2033 ($ Million) CHAPTER 12. Competitive Landscape 12.1. Competitior Benchmarking 2023 12.2. Market Share Analysis 12.3. Key Developments Analysis By Top 5 Companies 12.4. Market Share Acquisition Strategies: Analysis of Key Approaches Employed by Top Players CHAPTER 13. Company Profiles 13.1. Neste 13.1.1. Hanon Systems 13.1.2. Financial Analysis 13.1.2.1. Business Segment Revenue, 2020, 2021, 2022, $ Million 13.1.2.2. Geographic Revenue Mix, 2022 (% Share) 13.1.3. Product Portfolio 13.1.4. Recent Development and Strategies Adopted 13.1.5. SWOT Analysis 13.2. Gevo 13.3. Eni 13.4. World Energy 13.5. SkyNRG 13.6. Fulcrum BioEnergy 13.7. Velocys 13.8. Aemetis 13.9 Honeywell 13.10 Sasol
Connect to Analyst
Research Methodology

Our Most Viewed Report and gain instant expertise

Airport Information Systems Market Analysis and Global Forecast 2023-2033
Airport Information Systems Market Research Report: Information By System (Airport Operation Control Center, Departure Control System), By Application (Finance & Operations, Maintenance, Security, Others), By Airport (Class A Airports, Class B Airports, Class C Airports, Class D Airports), and by Region — Forecast till 2033
Page: 173 CubeSat Market Analysis and Global Forecast 2023-2033
CubeSat Market Research Report: Information By Basis of Subsystem (Payloads, Solar Panels & Antenna Systems, Propulsion Systems, Others), Application (Earth Observation & Traffic Monitoring, Science & Technology, and Education, Others), By End User (Government & Military, Commercial, Non-profit Organizations), and by Region — Forecast till 2033
Page: 169 
