Streaming Devices Market Analysis and Global Forecast 2023-2033
$ 1,390.00 – $ 5,520.00(Approx. $1,898.24 - $7,538.33)
Streaming Devices Market Research Report: By Component (Hardware, Software, Component 3), By Sales Channel (Online, Offline), By Price Range (Low, Medium, High), By Application (TV, Gaming Consoles, Others), and by Region — Forecast till 2033
Page: 154
Streaming Devices Market Overview
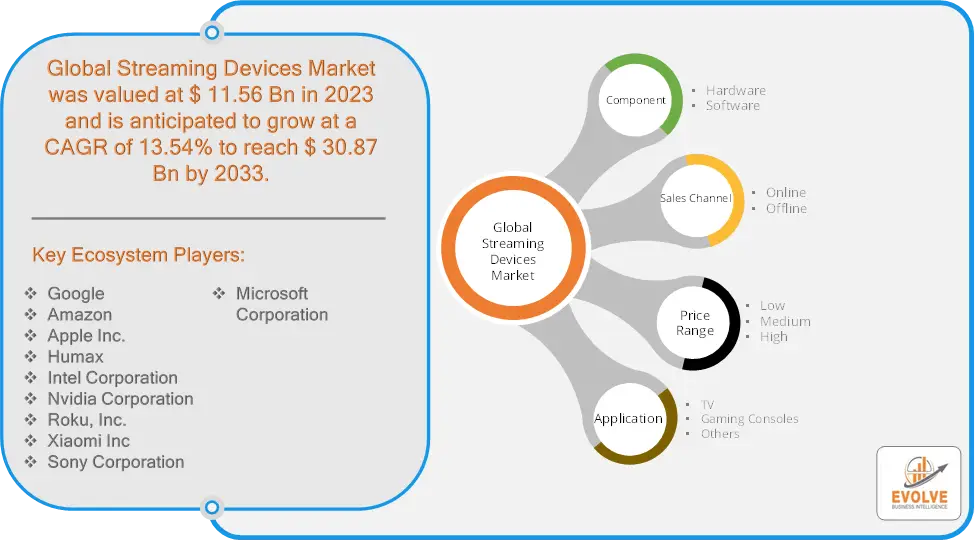
Streaming Devices Market Size is expected to reach USD 30.87 Billion by 2033. The Streaming Devices industry size accounted for USD 11.56 Billion in 2023 and is expected to expand at a compound annual growth rate (CAGR) of 13.54% from 2023 to 2033. The streaming devices market involves hardware products designed to stream digital content from the internet to televisions and other display devices. These devices include set-top boxes, streaming sticks, and integrated TVs with built-in streaming capabilities. Key players in this market include companies like Roku, Amazon, Google, and Apple. The market is driven by the increasing popularity of over-the-top (OTT) content services, advancements in streaming technology, and the growing demand for high-definition and 4K content. Consumer preferences for convenience, variety, and affordability also fuel market growth.
Global Streaming Devices Market Synopsis
Global Streaming Devices Market Dynamics
The major factors that have impacted the growth of Streaming Devices are as follows:
Drivers:
⮚ Advancements in Streaming Technology
Technological innovations such as 4K Ultra HD, High Dynamic Range (HDR), and Dolby Atmos have enhanced the viewing experience, driving consumers to upgrade their streaming devices to enjoy higher-quality content. The development of faster and more efficient streaming protocols also contributes to the market’s growth.
Restraint:
- Technical Issues and Compatibility Concerns
Compatibility issues with different TV models, operating systems, and streaming services can pose challenges for consumers. Additionally, technical problems such as connectivity issues, software bugs, and performance inconsistencies can affect the overall user experience and limit the appeal of streaming devices.
Opportunity:
⮚ Advancements in Streaming Technologies
Innovations such as 8K resolution, virtual reality (VR), and augmented reality (AR) offer new avenues for growth. Streaming devices that support these advanced technologies can attract tech-savvy consumers and early adopters. As these technologies become more mainstream, they create opportunities for new product development and differentiation.
Streaming Devices Market Segment Overview
By Component
Based on the Component, the market is segmented based on Hardware, Software, Component 3. the Hardware segment dominates, as it includes the physical devices like set-top boxes and streaming sticks that are essential for accessing and displaying digital content.
By Sales Channel
Based on Sales Channel, the market has been divided into Online, Offline. the Online sales channel dominates, driven by the convenience of e-commerce platforms, wider product availability, and the growing trend of online shopping.
By Price Range
Based on the Price Range, the market has been divided into Low, Medium, High. the Medium price range segment dominates, offering a balance between affordability and advanced features, appealing to a broad consumer base.
By Application
Based on Application, the market has been divided into TV, Gaming Consoles, Others. the TV segment dominates, as it accounts for the largest share due to the widespread use of streaming devices to access digital content on televisions.
Global Streaming Devices Market Regional Analysis
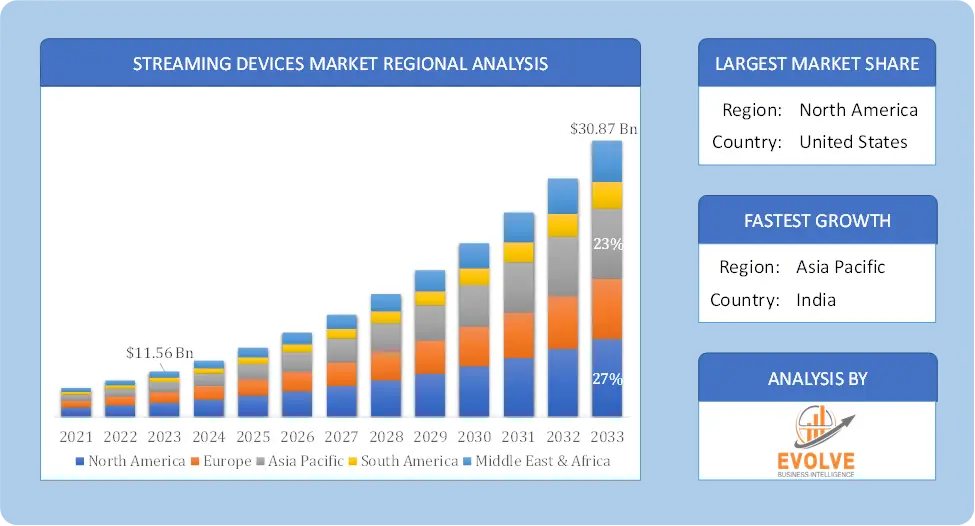
Based on region, the market has been divided into North America, Europe, Asia-Pacific, the Middle East & Africa, and Latin America. The area of North America is anticipated to dominate the market for the usage of Streaming Devices, followed by those in Asia-Pacific and Europe.
Streaming Devices North America Market
The North American region holds a dominant position in the Streaming Devices market. Due to its big population, high rate of internet penetration, and widespread use of technology, North America will lead the streaming device industry. This will result in a significant demand for streaming devices. Furthermore, the increasing quantity of fitness centers and health clubs opening will fuel market expansion in this area.
Streaming Devices Asia Pacific Market
The Asia-Pacific region is witnessing rapid growth and emerging as a significant market for the Streaming Devices industry. From 2023 to 2032, the Asia-Pacific Streaming Devices Market is anticipated to develop at the quickest compound annual growth rate (CAGR). This is a result of fast industrialization and urbanization, which have raised disposable incomes and created a middle class that is growing and has more purchasing power. In addition, China had the biggest market share for streaming devices, while India had the highest rate of growth for this category in the Asia-Pacific region.
Competitive Landscape
The competitive landscape includes key players (tier 1, tier 2, and local) having a presence across the globe. Companies such as Google, Amazon, Apple Inc., Humax, and Intel Corporation are some of the leading players in the global Streaming Devices Industry. These players have adopted partnership, acquisition, expansion, and new product development, among others as their key strategies.
Key Market Players:
- Amazon
- Apple Inc.
- Humax
- Intel Corporation
- Nvidia Corporation
- Roku, Inc.
- Xiaomi Inc
- Sony Corporation
- Microsoft Corporation
Key Development:
January 2020: Roku, Inc. introduced Roku TV Ready, a new program, to enable consumer electronics companies to collaborate with Roku. Such collaborations would help electronics companies to work seamlessly with Roku TV for an incredible home entertainment experience.
Scope of the Report
Global Streaming Devices Market, by Component
- Hardware
- Software
Global Streaming Devices Market, by Sales Channel
- Online
- Offline
Global Streaming Devices Market, by Price Range
- Low
- Medium
- High
Global Streaming Devices Market, by Application
- TV
- Gaming Consoles
- Others
Global Streaming Devices Market, by Region
- North America
- US
- Canada
- Mexico
- Europe
- UK
- Germany
- France
- Italy
- Spain
- Benelux
- Nordic
- Rest of Europe
- Asia Pacific
- China
- Japan
- South Korea
- Indonesia
- Austalia
- Malaysia
- India
- Rest of Asia Pacific
- South America
- Brazil
- Argentina
- Rest of South America
- Middle East & Africa
- Saudi Arabia
- UAE
- Egypt
- South Africa
- Rest of Middle East & Africa
Parameters | Indicators |
---|---|
Market Size | 2033: $30.87 Billion |
CAGR | 13.54% CAGR (2023-2033) |
Base year | 2022 |
Forecast Period | 2023-2033 |
Historical Data | 2021 |
Report Coverage | Revenue Forecast, Competitive Landscape, Growth Factors, and Trends |
Key Segmentations | Component, Sales Channel, Price Range, Application |
Geographies Covered | North America, Europe, Asia-Pacific, Latin America, Middle East, Africa |
Key Vendors | Google, Amazon, Apple Inc., Humax, Intel Corporation, Nvidia Corporation, Roku, Inc., Xiaomi Inc, Sony Corporation, Microsoft Corporation |
Key Market Opportunities | Increased in demand for live streamed content |
Key Market Drivers | Rise in popularity of video game streaming device |
REPORT CONTENT BRIEF:
- High-level analysis of the current and future Streaming Devices Industry trends and opportunities
- Detailed analysis of current market drivers, restraining factors, and opportunities analysis in the future
- Historical market size for the year 2021, and forecast from 2023 to 2033
- Streaming Devices market share analysis for each segment
- Competitor analysis with a comprehensive insight into its product segment, financial strength, and strategies adopted.
- Identifies key strategies adopted by the key players including new product development, mergers and acquisitions, joint ventures, collaborations, and partnerships.
- To identify and understand the various factors involved in the global Streaming Devices market affected by the pandemic
- To provide year-on-year growth from 2022 to 2033
- To provide short-term, long-term, and overall CAGR comparison from 2022 to 2033.
- Provide Total Addressable Market (TAM) for the Global Streaming Devices Market.
Press Release
Glue Stick Market to Reach USD 2.35 Billion by 2034
Podiatry Service Market to Reach USD 11.88 Billion by 2034
Microfluidics Technology Market to Reach USD 32.58 Billion by 2034
Ferric Chloride Market to Reach USD 10.65 Billion by 2034
Family Practice EMR Software Market to Reach USD 21.52 Billion by 2034
Electric Hairbrush Market to Reach USD 15.95 Billion by 2034
Daily Bamboo Products Market to Reach USD 143.52 Billion by 2034
Cross-border E-commerce Logistics Market to Reach USD 112.65 Billion by 2034
Basic Silicone Market to Reach USD 28.74 Billion by 2034
Active Insulation Market to Reach USD 5.88 Billion by 2034
Frequently Asked Questions (FAQ)
What is the study period of this market?
The study period of the global Streaming Devices market is 2022- 2033
What are the 10 Years CAGR (2023 to 2033) of the global Streaming Devices market?
The global Streaming Devices market is growing at a CAGR of ~13.54% over the next 10 years
Which region has the highest growth rate in the market of Streaming Devices?
Asia Pacific is expected to register the highest CAGR during 2023-2033
Which region accounted for the largest share of the market of Streaming Devices?
North America holds the largest share in 2022
Major Key Players in the Market of Streaming Devices?
Google, Amazon, Apple Inc., Humax, Intel Corporation, Nvidia Corporation, Roku, Inc., Xiaomi Inc, Sony Corporation, and Microsoft Corporation are the major companies operating in the Streaming Devices Industry
Do you offer Post Sale Support?
Yes, we offer 16 hours of analyst support to solve the queries
Do you deliver sections of a report?
Yes, we do provide regional as well as country-level reports. Other than this we also provide a sectional report. Please get in contact with our sales representatives
Table of Content
Chapter 1. Executive Summary Chapter 2. Scope Of The Study 2.1. Market Definition 2.2. Scope Of The Study 2.2.1. Objectives of Report Chapter 3. Evolve BI Methodology Chapter 4. Market Insights and Trends 4.1. Supply/ Value Chain Analysis 4.2. Porter’s Five Forces Analysis 4.2.1. Threat Of New Entrants 4.2.2. Bargaining Power Of Buyers 4.2.3. Bargaining Power Of Suppliers 4.2.4. Threat Of Substitutes 4.2.5. Industry Rivalry 4.3. Impact of COVID-19 on Streaming Devices Market 4.3.1. Impact on Market Size 4.3.2. Application Trend, Preferences and Budget Impact 4.3.3. Regulatory Framework/Government Policies 4.3.4. Key Players Strategy to Tackle Negative Impact 4.3.5. Opportunity Window Chapter 5. Market Dynamics 5.1. Introduction 5.2. DRO Analysis 5.2.1. Drivers 5.2.2. Restraints 5.2.3. Opportunities Chapter 6. Global Streaming Devices Market, By Component 6.1. Introduction 6.2. Hardware 6.3. Software Chapter 7. Global Streaming Devices Market, By Sales Channel 7.1. Introduction 7.2. Online 7.3. Offline Chapter 8. Global Streaming Devices Market, By Price Range 8.1. Introduction 8.2. Low 8.3. Medium 8.4. High Chapter 9. Global Streaming Devices Market, By Application 9.1. Introduction 9.2. TV 9.3. Gaming Consoles 9.4. Others Chapter 10. Global Streaming Devices Market, By Region 10.1. Introduction 10.2. North America 10.2.1. Introduction 10.2.2. Driving Factors, Opportunity Analyzed and Key Trends 10.2.3. Market Size and Forecast, By Country, 2020 - 2028 10.2.4. Market Size and Forecast, By Component, 2020 - 2028 10.2.5. Market Size and Forecast, By Sales Channel, 2020 - 2028 10.2.6. Market Size and Forecast, By Price Range, 2020 - 2028 10.2.7. Market Size and Forecast, By Application, 2020 - 2028 10.2.8. US 10.2.8.1. Introduction 10.2.8.2. Driving Factors, Opportunity Analyzed and Key Trends 10.2.8.3. Market Size and Forecast, By Component, 2020 - 2028 10.2.8.4. Market Size and Forecast, By Sales Channel, 2020 - 2028 10.2.8.5. Market Size and Forecast, By Price Range, 2020 - 2028 10.2.8.6. Market Size and Forecast, By Application, 2020 - 2028 10.2.9. Canada 10.2.9.1. Introduction 10.2.9.2. Driving Factors, Opportunity Analyzed and Key Trends 10.2.9.3. Market Size and Forecast, By Component, 2020 - 2028 10.2.9.4. Market Size and Forecast, By Sales Channel, 2020 - 2028 10.2.9.5. Market Size and Forecast, By Price Range, 2020 - 2028 10.2.9.6. Market Size and Forecast, By Application, 2020 - 2028 10.3. Europe 10.3.1. Introduction 10.3.2. Driving Factors, Opportunity Analyzed and Key Trends 10.3.3. Market Size and Forecast, By Country, 2020 - 2028 10.3.4. Market Size and Forecast, By Component, 2020 - 2028 10.3.5. Market Size and Forecast, By Sales Channel, 2020 - 2028 10.3.6. Market Size and Forecast, By Price Range, 2020 - 2028 10.3.7. Market Size and Forecast, By Application, 2020 - 2028 10.3.8. Germany 10.3.8.1. Introduction 10.3.8.2. Driving Factors, Opportunity Analyzed and Key Trends 10.3.8.3. Market Size and Forecast, By Component, 2020 - 2028 10.3.8.4. Market Size and Forecast, By Sales Channel, 2020 - 2028 10.3.8.5. Market Size and Forecast, By Price Range, 2020 - 2028 10.3.8.6. Market Size and Forecast, By Application, 2020 - 2028 10.3.9. France 10.3.9.1. Introduction 10.3.9.2. Driving Factors, Opportunity Analyzed and Key Trends 10.3.9.3. Market Size and Forecast, By Component, 2020 - 2028 10.3.9.4. Market Size and Forecast, By Sales Channel, 2020 - 2028 10.3.9.5. Market Size and Forecast, By Price Range, 2020 - 2028 10.3.9.6. Market Size and Forecast, By Application, 2020 - 2028 10.3.10. UK 10.3.10.1. Introduction 10.3.10.2. Driving Factors, Opportunity Analyzed and Key Trends 10.3.10.3. Market Size and Forecast, By Component, 2020 - 2028 10.3.10.4. Market Size and Forecast, By Sales Channel, 2020 - 2028 10.3.10.5. Market Size and Forecast, By Price Range, 2020 - 2028 10.3.10.6. Market Size and Forecast, By Application, 2020 - 2028 10.3.11. Italy 10.3.11.1. Introduction 10.3.11.2. Driving Factors, Opportunity Analyzed and Key Trends 10.3.11.3. Market Size and Forecast, By Component, 2020 - 2028 10.3.11.4. Market Size and Forecast, By Sales Channel, 2020 - 2028 10.3.11.5. Market Size and Forecast, By Price Range, 2020 - 2028 10.3.11.6. Market Size and Forecast, By Application, 2020 - 2028 10.3.12. Rest Of Europe 10.3.12.1. Introduction 10.3.12.2. Driving Factors, Opportunity Analyzed and Key Trends 10.3.12.3. Market Size and Forecast, By Component, 2020 - 2028 10.3.12.4. Market Size and Forecast, By Sales Channel, 2020 - 2028 10.3.12.5. Market Size and Forecast, By Price Range, 2020 - 2028 10.3.12.6. Market Size and Forecast, By Application, 2020 - 2028 10.4. Asia-Pacific 10.4.1. Introduction 10.4.2. Driving Factors, Opportunity Analyzed and Key Trends 10.4.3. Market Size and Forecast, By Country, 2020 - 2028 10.4.4. Market Size and Forecast, By Component, 2020 - 2028 10.4.5. Market Size and Forecast, By Sales Channel, 2020 - 2028 10.4.6. Market Size and Forecast, By Price Range, 2020 - 2028 10.4.7. Market Size and Forecast, By Application, 2020 - 2028 10.4.8. China 10.4.8.1. Introduction 10.4.8.2. Driving Factors, Opportunity Analyzed and Key Trends 10.4.8.3. Market Size and Forecast, By Component, 2020 - 2028 10.4.8.4. Market Size and Forecast, By Sales Channel, 2020 - 2028 10.4.8.5. Market Size and Forecast, By Price Range, 2020 - 2028 10.4.8.6. Market Size and Forecast, By Application, 2020 - 2028 10.4.9. India 10.4.9.1. Introduction 10.4.9.2. Driving Factors, Opportunity Analyzed and Key Trends 10.4.9.3. Market Size and Forecast, By Component, 2020 - 2028 10.4.9.4. Market Size and Forecast, By Sales Channel, 2020 - 2028 10.4.9.5. Market Size and Forecast, By Price Range, 2020 - 2028 10.4.9.6. Market Size and Forecast, By Application, 2020 - 2028 10.4.10. Japan 10.4.10.1. Introduction 10.4.10.2. Driving Factors, Opportunity Analyzed and Key Trends 10.4.10.3. Market Size and Forecast, By Component, 2020 - 2028 10.4.10.4. Market Size and Forecast, By Sales Channel, 2020 - 2028 10.4.10.5. Market Size and Forecast, By Price Range, 2020 - 2028 10.4.10.6. Market Size and Forecast, By Application, 2020 - 2028 10.4.11. South Korea 10.4.11.1. Introduction 10.4.11.2. Driving Factors, Opportunity Analyzed and Key Trends 10.4.11.3. Market Size and Forecast, By Component, 2020 - 2028 10.4.11.4. Market Size and Forecast, By Sales Channel, 2020 - 2028 10.4.11.5. Market Size and Forecast, By Price Range, 2020 - 2028 10.4.11.6. Market Size and Forecast, By Application, 2020 - 2028 10.4.12. Rest Of Asia-Pacific 10.4.12.1. Introduction 10.4.12.2. Driving Factors, Opportunity Analyzed and Key Trends 10.4.12.3. Market Size and Forecast, By Component, 2020 - 2028 10.4.12.4. Market Size and Forecast, By Sales Channel, 2020 - 2028 10.4.12.5. Market Size and Forecast, By Price Range, 2020 - 2028 10.4.12.6. Market Size and Forecast, By Application, 2020 - 2028 10.5. Rest Of The World (RoW) 10.5.1. Introduction 10.5.2. Driving Factors, Opportunity Analyzed and Key Trends 10.5.3. Market Size and Forecast, By Component, 2020 - 2028 10.5.4. Market Size and Forecast, By Sales Channel, 2020 - 2028 10.5.5. Market Size and Forecast, By Price Range, 2020 - 2028 10.5.6. Market Size and Forecast, By Application, 2020 - 2028 10.5.7. Market Size and Forecast, By Region, 2020 - 2028 10.5.8. South America 10.5.8.1. Introduction 10.5.8.2. Driving Factors, Opportunity Analyzed and Key Trends 10.5.8.3. Market Size and Forecast, By Component, 2020 - 2028 10.5.8.4. Market Size and Forecast, By Sales Channel, 2020 - 2028 10.5.8.5. Market Size and Forecast, By Price Range, 2020 - 2028 10.5.8.6. Market Size and Forecast, By Application, 2020 - 2028 10.5.9. Middle East & Afirica 10.5.9.1. Introduction 10.5.9.2. Driving Factors, Opportunity Analyzed and Key Trends 10.5.9.3. Market Size and Forecast, By Component, 2020 - 2028 10.5.9.4. Market Size and Forecast, By Sales Channel, 2020 - 2028 10.5.9.5. Market Size and Forecast, By Price Range, 2020 - 2028 10.5.9.6. Market Size and Forecast, By Application, 2020 - 2028 Chapter 11. Competitive Landscape 11.1. Introduction 11.2. Vendor Share Analysis, 2020/Key Players Positioning, 2020 Chapter 12. Company Profiles 12.1. Google 12.1.1. Business Overview 12.1.2. Financial Analysis 12.1.3. Product Portfolio 12.1.4. Recent Development and Strategies Adopted 12.1.5. SWOT Analysis 12.2. Amazon.com, Inc 12.2.1. Business Overview 12.2.2. Financial Analysis 12.2.3. Product Portfolio 12.2.4. Recent Development and Strategies Adopted 12.2.5. SWOT Analysis 12.3. Apple Inc. 12.3.1. Business Overview 12.3.2. Financial Analysis 12.3.3. Product Portfolio 12.3.4. Recent Development and Strategies Adopted 12.3.5. SWOT Analysis 12.4. Humax 12.4.1. Business Overview 12.4.2. Financial Analysis 12.4.3. Product Portfolio 12.4.4. Recent Development and Strategies Adopted 12.4.5. SWOT Analysis 12.5. Intel Corporation 12.5.1. Business Overview 12.5.2. Financial Analysis 12.5.3. Product Portfolio 12.5.4. Recent Development and Strategies Adopted 12.5.5. SWOT Analysis 12.6. Nvidia Corporation 12.6.1. Business Overview 12.6.2. Financial Analysis 12.6.3. Product Portfolio 12.6.4. Recent Development and Strategies Adopted 12.6.5. SWOT Analysis 12.7. Roku, Inc. 12.7.1. Business Overview 12.7.2. Financial Analysis 12.7.3. Product Portfolio 12.7.4. Recent Development and Strategies Adopted 12.7.5. SWOT Analysis 12.8. Xiaomi Inc 12.8.1. Business Overview 12.8.2. Financial Analysis 12.8.3. Product Portfolio 12.8.4. Recent Development and Strategies Adopted 12.8.5. SWOT Analysis 12.9. Sony Corporation 12.9.1. Business Overview 12.9.2. Financial Analysis 12.9.3. Product Portfolio 12.9.4. Recent Development and Strategies Adopted 12.9.5. SWOT Analysis 12.10. Microsoft Corporation 12.10.1. Business Overview 12.10.2. Financial Analysis 12.10.3. Product Portfolio 12.10.4. Recent Development and Strategies Adopted 12.10.5. SWOT Analysis Chapter 13. Key Takeaways