Premixed/ Low Alcoholic RTDs Market Analysis and Global Forecast 2023-2033

$ 1,390.00$ 5,520.00

Premixed/ Low Alcoholic RTDs Market Research Report: By Flavor Profile (Fruit-Flavored, Cocktail-Inspired, Wine-Based, Other Flavor), By Packaging Type (Cans, Bottles, Tetra Packs, Pouches), By End User (Millennials, Health-Conscious Individuals, Gluten-Free or Vegan Consumers), and by Region — Forecast till 2033

Report Code: EB_F&B_1302 | Page: 210 | Published Date: June 2023

Report Published on: October 15, 2024
$ 3,470.00
$ 5,520.00
$ 1,390.00
Report Code: EBI12654 Categories: ,
Description

What Does This Global Premixed/ Low Alcoholic RTDs Market Report Include?

Parameters Values
Market Size and Forecast Years 2021 to 2023
Compounded Average Growth Rate (CAGR)
  • First 5 Years CAGR (2023–2028)
  • Last 5 Years CAGR (2028–2033)
  • 10 Years CAGR (2023–2033)
Year-over-Year Growth Depiction Included
Market Opportunity Score Included
Market Dynamics or Impacting Factors Included
Market Dynamics Impact Analysis Included
PORTER’s Five Forces Analysis (in Brief) Included (Detailed Analysis Can be included on Demand)
Segments Included By Flavor Profile
Fruit-flavored
Cocktail-inspired
Wine-based
Other flavorsBy Packaging Type
Cans
Bottles
Tetra packs
PouchesBy End User
Millennials
Health-conscious individuals
Gluten-free or vegan consumers
Regions Included North America, Europe, Asia Pacific, Latin America, and Middle East & Africa
Countries Included U.S., Canada, Mexico, U.K., Germany, France, Italy, Spain, BeNeLux, Russia, China, Japan, India, South Korea, Thailand, Indonesia, Malaysia, Australia, Brazil, Argentina, Saudi Arabia, UAE, Egypt, and South Africa
Competitor Benchmarking Included
Company/Vendor Market Share Analysis Included
Key Development Analysis for top 5 Companies Included
Market Share Acquisition Key Strategies Included
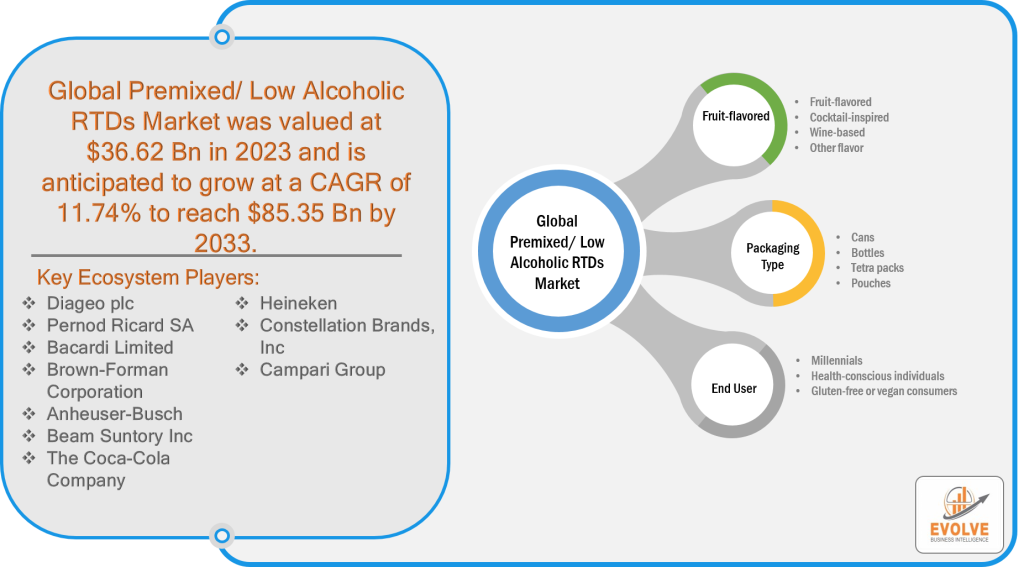
Key Market Players Diageo plc, Pernod Ricard SA, Bacardi Limited, Brown-Forman Corporation, Anheuser-Busch, Beam Suntory Inc, The Coca-Cola Company, Heineken, Constellation Brands, Inc, Campari Group

* This section is completely customizable upto 15 companies; you can share the list of companies you want us to profile and we will include them in the final report for you

Premixed/ Low Alcoholic RTDs Market Overview

Premixed/ Low Alcoholic RTDs Market Size is expected to reach USD 85.35 Billion by 2033. The Premixed/ Low Alcoholic RTDs industry size accounted for USD 36.62 Billion in 2023 and is expected to expand at a compound annual growth rate (CAGR) of 11.74% from 2023 to 2033.

“Premixed/Low Alcoholic RTDs” refers to a category of beverages that are ready-to-drink (RTD) and contain a pre-mixed combination of various ingredients, typically including alcohol and flavorings, with low alcohol content. These beverages are designed to be consumed directly from the bottle or can, without the need for any additional preparation or mixing. The term “low alcoholic” indicates that the beverages have a relatively lower alcohol content compared to traditional spirits or liqueurs. These products are often marketed as convenient and refreshing alternatives to higher-alcohol options, appealing to consumers seeking a milder alcoholic beverage experience.

Global Premixed/ Low Alcoholic RTDs Market Synopsis

Premixed Low Alcoholic RTDs Market Analysis

COVID-19 Impact Analysis

The Premixed/Low Alcoholic RTDs market experienced a significant impact as a result of the COVID-19 pandemic. With lockdowns, social distancing measures, and restrictions on gatherings, the demand for these beverages declined. The closure of bars, restaurants, and entertainment venues further reduced opportunities for consumers to enjoy RTDs in social settings. Additionally, the economic uncertainty caused by the pandemic led to reduced discretionary spending, affecting the overall sales of these products. While some consumers turned to at-home consumption, the overall market was still faced with challenges such as disrupted supply chains, limited distribution channels, and reduced promotional activities. As the pandemic continues to evolve, the Premixed/Low Alcoholic RTDs market is gradually adapting to the changing consumer behaviors and exploring new strategies to recover and regain its market position.

Global Premixed/ Low Alcoholic RTDs Market Dynamics

The major factors that have impacted the growth of Premixed/ Low Alcoholic RTDs are as follows:

Drivers:

  • Changing Consumer Preferences

Changing consumer preferences reflect an evolving landscape where health-conscious individuals are increasingly seeking healthier alternatives and lower-alcohol options. This shift can be attributed to a broader focus on well-being, as consumers prioritize physical and mental health in their lifestyles. In response to this trend, the Premixed/Low Alcoholic RTDs market has gained traction by providing a solution that meets these demands. These beverages offer a convenient and hassle-free experience, eliminating the need for consumers to mix their own drinks or visit bars for customized cocktails. With pre-mixed formats readily available, consumers can enjoy a refreshing beverage without the extra effort. Furthermore, Premixed/Low Alcoholic RTDs stand out by offering a lower alcohol content compared to traditional spirits, making them an appealing choice for health-conscious individuals who aim to moderate their alcohol consumption while still indulging in a flavorful drink. This alignment with mindful consumption and responsible drinking habits resonates with consumers who seek a balanced and enjoyable drinking experience without compromising their commitment to healthier lifestyles.

Restraint:

  • Regulatory Challenges

Many jurisdictions have stringent guidelines regarding the advertising and promotion of alcoholic beverages, aiming to prevent excessive consumption and protect vulnerable populations, particularly minors. Restrictions can encompass limitations on the time, content, and medium of advertisements, affecting the visibility and reach of RTD brands. Complying with these regulations demands careful planning and creativity develop marketing campaigns that align with legal boundaries while effectively conveying the brand’s message to the target audience. Moreover, legal drinking age restrictions add another layer of complexity. To prevent underage drinking, regulations stipulate a minimum legal drinking age, requiring rigorous age verification measures during sales and distribution. This necessitates robust identification protocols and diligent enforcement practices to ensure compliance. Failure to adhere to these regulations can result in severe penalties, including fines and potential damage to brand reputation.

Opportunity:

  • Innovation and Product Development

The Premixed/Low Alcoholic RTDs market presents a significant opportunity for innovation, allowing companies to differentiate their products and capture consumer attention. One avenue for innovation lies in the development of new flavors and ingredient combinations that cater to evolving consumer preferences. By exploring unique and enticing flavor profiles, companies can offer a diverse range of options that appeal to various tastes and preferences, attracting a broader consumer base. Additionally, experimenting with innovative ingredients, such as natural extracts, botanicals, and functional additives, can provide added health benefits or unique sensory experiences, further setting these RTDs apart from traditional beverages. Moreover, packaging formats offer another avenue for innovation. Companies can explore eco-friendly, sustainable packaging options that align with consumer values and contribute to reducing environmental impact. Novel packaging designs, such as resealable or portable formats, can enhance convenience and on-the-go consumption, resonating with consumers’ busy lifestyles.

Premixed/ Low Alcoholic RTDs Market Segment Overview

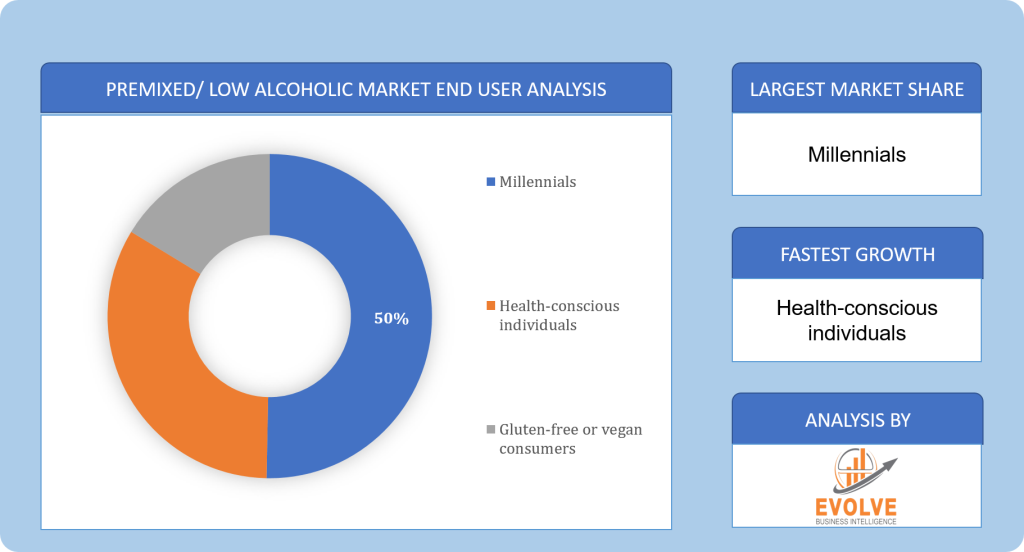
Premixed Low Alcoholic RTDs Market End User Analysis

By Flavor Profile

Based on the Flavor Profile, the market is segmented based on Fruit-Flavored, Cocktail-Inspired, Wine-Based, and Other Flavor. The Fruit-Flavored segment was projected to hold the largest market share in the Premixed/ Low Alcoholic RTDs market. Fruit-flavored RTDs offer a refreshing and vibrant taste experience, making them an enticing choice for consumers seeking a flavorful and enjoyable beverage. These products often feature a range of fruit flavors, including citrus, berries, tropical fruits, and more, catering to diverse taste preferences.

By Packaging Type

Based on the Packaging Type, the market has been divided into Cans, Bottles, Tetra Packs, and Pouches. The Bottles segment is expected to hold the largest market share in the Market. Bottles provide a convenient and portable option for consumers, allowing them to easily transport and enjoy their favorite RTDs on various occasions. The sturdy and sealable nature of bottles ensures product freshness and minimizes the risk of spills, making them suitable for on-the-go consumption.

By End User

Based on End Users, the market has been divided into Millennials, Health-conscious individuals, and Gluten-free or vegan consumers. The Millennials segment is projected to experience significant growth in the Premixed/ Low Alcoholic RTDs market. Millennials value convenience and experiential consumption, seeking products that fit into their fast-paced lifestyles. Premixed/Low Alcoholic RTDs provide a ready-to-drink solution that requires minimal preparation, making them ideal for on-the-go consumption and social gatherings. The variety of flavors and innovative packaging formats available in this market segment also appeals to Millennials’ desire for novel experiences and self-expression.

Global Premixed/ Low Alcoholic RTDs Market Regional Analysis

Premixed Low Alcoholic RTDs Market Regional Analysis

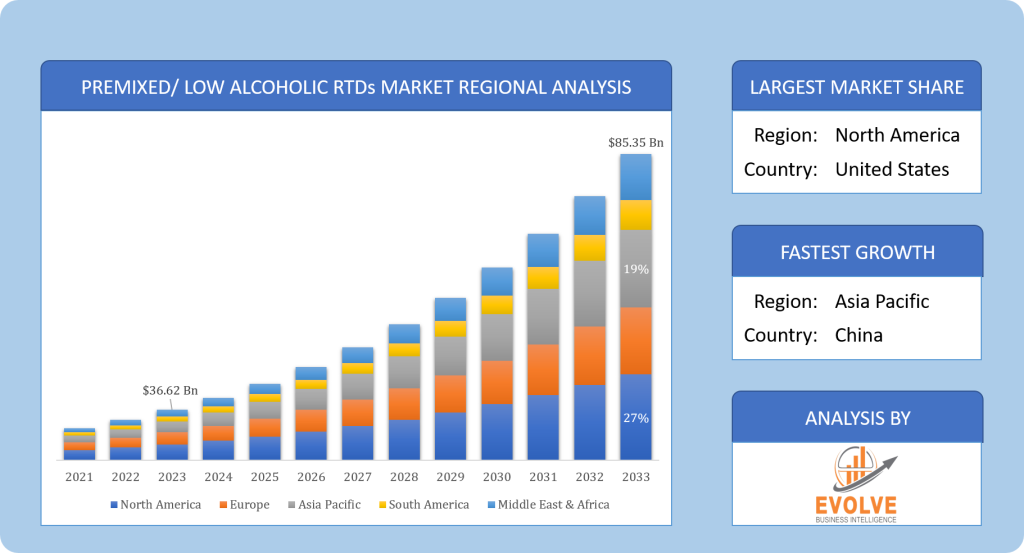
Based on region, the market has been divided into North America, Europe, Asia-Pacific, the Middle East & Africa, and Latin America. The area of North America is anticipated to dominate the market for the usage of Premixed/ Low Alcoholic RTDs, followed by those in Asia-Pacific and Europe.

North America Market

North America has consistently maintained the largest market share in the Premixed/ Low Alcoholic RTDs market. This region’s dominance is a result of several factors contributing to its strong market position. Firstly, North America has a well-established and mature alcoholic beverage market, with a culture that embraces innovation and new drinking trends. This consumer openness to trying new products and exploring diverse beverage options has provided a fertile ground for the growth of Premixed/Low Alcoholic RTDs. Additionally, North America has witnessed a significant shift in consumer preferences towards healthier and lower-alcohol alternatives, driven by factors such as wellness consciousness and responsible drinking habits. Premixed/Low Alcoholic RTDs align with these changing preferences, offering convenient, pre-mixed beverages with lower alcohol content. The region’s health-conscious population, particularly millennials and younger demographics, has readily embraced these options, fueling the demand and contributing to the larger market share.

Asia Pacific Market

The Asia-Pacific region has been experiencing a remarkable growth rate in the Premixed/Low Alcoholic RTDs industry. This surge in demand can be attributed to various factors that contribute to the region’s expanding market share. Firstly, the increasing disposable income and changing lifestyles of the population in countries like China, India, and Southeast Asian nations have led to a rise in consumer spending on leisure activities and indulgent experiences. As a result, there is a growing interest in exploring new and innovative beverage options, including Premixed/Low Alcoholic RTDs. Additionally, the Asia-Pacific region has a large population of young adults and millennials who are becoming more health-conscious and actively seeking lower-alcohol alternatives. This demographic cohort is increasingly opting for beverages that align with their wellness goals and preferences. Premixed/Low Alcoholic RTDs cater to this demand by offering a convenient and flavorful option with reduced alcohol content, making them attractive to the health-conscious consumer base in the region.

Competitive Landscape

The competitive landscape includes key players (tier 1, tier 2, and local) having a presence across the globe. Companies such as Diageo, Pernod Ricard SA, Bacardi Limited, Brown-Forman Corporation are some of the leading players in the global Premixed/ Low Alcoholic RTDs Industry. These players have adopted partnership, acquisition, expansion, and new product development, among others as their key strategies.

Key Market Players:

  • Diageo plc
  • Pernod Ricard SA
  • Bacardi Limited
  • Brown-Forman Corporation
  • Anheuser-Busch
  • Beam Suntory Inc
  • The Coca-Cola Company
  • Heineken
  • Constellation Brands, Inc
  • Campari Group

Key development:

In April 2023, The Coca-Cola brand collaborated with whiskey brand Jack Daniel’s, and their ready-to-drink (RTD) can have recently been made available in stores throughout the United Kingdom. This partnership aims to provide consumers with a convenient way to enjoy the popular combination of Coca-Cola and Jack Daniel’s whiskey.

Scope of the Report

Global Premixed/ Low Alcoholic RTDs Market, by Flavor Profile

  • Fruit-flavored
  • Cocktail-inspired
  • Wine-based
  • Other flavors

Global Premixed/ Low Alcoholic RTDs Market, by Packaging Type

  • Cans
  • Bottles
  • Tetra packs
  • Pouches

Global Premixed/ Low Alcoholic RTDs Market, by End User

  • Millennials
  • Health-conscious individuals
  • Gluten-free or vegan consumers

Global Premixed/ Low Alcoholic RTDs Market, by Region

  • North America
    • US
    • Canada
    • Mexico
  • Europe
    • UK
    • Germany
    • France
    • Italy
    • Spain
    • Benelux
    • Nordic
    • Rest of Europe
  • Asia Pacific
    • China
    • Japan
    • South Korea
    • Indonesia
    • Australia
    • Malaysia
    • India
    • Rest of Asia Pacific
  • South America
    • Brazil
    • Argentina
    • Rest of South America
  • Middle East & Africa
    • Saudi Arabia
    • UAE
    • Egypt
    • South Africa
    • Rest of Middle East & Africa
Parameters Values
Market Size 2033: USD 85.35 Billion
Compounded Average Growth Rate (CAGR) 2023 to 2033 11.74%
Base Year 2022
Forecast Period 2023 to 2033
Historical Data 2021 (2017 to 2020 On Demand)
Report Coverage Revenue Forecast, Competitive Landscape, Growth Factors, and Trends
Key Segmentations Flavor Profile, Packaging Type, End User
Key Market Opportunities Innovation in product development.
.
Key Market Drivers
  • Changing consumer preferences towards healthier and lower-alcohol alternatives.
  • Increasing demand for convenient, pre-mixed beverages.
  • Growing popularity among health-conscious individuals.
  • Rise in the Millennial and younger demographic seeking innovative drink options
Geographies Covered North America, Europe, Asia-Pacific, South America, Middle East, Africa
Key Vendors Diageo plc, Pernod Ricard SA, Bacardi Limited, Brown-Forman Corporation, Anheuser-Busch, Beam Suntory Inc, The Coca-Cola Company, Heineken, Constellation Brands, Inc, Campari Group

Report Content Brief:

  • High-level analysis of the current and future Premixed/ Low Alcoholic RTDs Industry trends and opportunities
  • Detailed analysis of current market drivers, restraining factors, and opportunities analysis in the future
  • Historical market size for the year 2021, and forecast from 2023 to 2033
  • Premixed/ Low Alcoholic RTDs market share analysis for each segment
  • Competitor analysis with a comprehensive insight into its product segment, financial strength, and strategies adopted.
  • Identifies key strategies adopted by the key players including new product development, mergers and acquisitions, joint ventures, collaborations, and partnerships.
  • To identify and understand the various factors involved in the global Premixed/ Low Alcoholic RTDs market affected by the pandemic
  • To provide year-on-year growth from 2022 to 2033
  • To provide short-term, long-term, and overall CAGR comparison from 2022 to 2033.
  • Provide Total Addressable Market (TAM) for the Global Premixed/ Low Alcoholic RTDs Market.

For more details mail us at

Ask a question / additional requirement

Table of Content

Table of Content

CHAPTER 1.               Executive Summary

CHAPTER 2.               Scope of the Study

2.1.       Market Definition

2.2.       Market Scope & Segmentation

2.2.1.        Objective of Report

CHAPTER 3.               Evolve BI Methodology

3.1.       Data Collection & Validation Approach

3.2.       Market Size Estimation and Forecast

CHAPTER 4.               Exclusive Analysis

4.1.       Market Opportunity Score

4.1.1.        Flavor Profile Segement – Market Opportunity Score

4.1.2.        Packaging Type Segment – Market Opportunity Score

4.1.3.        End User Segment – Market Opportunity Score

4.2.       Key Market Influencing Indicators

CHAPTER 5.               Market Insights and Trends

5.1.       Value Chain Analysis

5.1.1.        Raw Material

5.1.2.        Manufacturing Process

5.1.3.        Distribution Channel

5.1.4.        End User

5.2.       Porter’s Five Forces Analysis

5.2.1.        Bargaining Power of Buyers

5.2.2.        Bargaining Power of Suppliers

5.2.3.        Threat of New Entrant

5.2.4.        Threat of Substitute

5.2.5.        Industry Rivalry

5.3.       COVID-19 Impact and Post COVID Scenario on Premixed/ Low Alcoholic RTDs Market

5.3.1.        Impact of COVID-19

5.3.2.        Government Support and Industry Revival Policies

5.3.3.        Measures Taken by Companies to Mitigate Negative Impact

5.3.4.        Post COVID Trend

CHAPTER 6.               MArket Dynamics

6.1.       Introduction

6.2.       Drivers

6.2.1.        Driver 1

6.2.2.        Driver 2

6.2.3.        Driver 3

6.3.       Restraints

6.3.1.        Restraint 1

6.3.2.        Restraint 2

6.4.       Opportunity

6.4.1.        Opportunity 1

CHAPTER 7.               Global Premixed/ Low Alcoholic RTDs Market, By Flavor Profile

7.1.       Introduction

7.1.1.        Fruit-flavored

7.1.2.        Cocktail-inspired

7.1.3.        Wine-based

7.1.4.        Other flavor

CHAPTER 8.               Global Premixed/ Low Alcoholic RTDs Market, By Packaging Type

8.1.       Introduction

8.1.1.        Cans

8.1.2.        Bottles

8.1.3.        Tetra packs

8.1.4.        Pouches

CHAPTER 9.               Global Premixed/ Low Alcoholic RTDs Market, By End User

9.1.       Introduction

9.1.1.        Millennials

9.1.2.        Health-conscious individuals

9.1.3.        Gluten-free or vegan consumers

CHAPTER 10.             Global Premixed/ Low Alcoholic RTDs Market, By Region

10.1.     Introduction

10.2.     NORTH AMERICA

10.2.1.      North America: Market Size and Forecast, By Country, 2023 – 2033 ($ Million)

10.2.2.      North America: Market Size and Forecast, By Flavor Profile, 2023 – 2033 ($ Million)

10.2.3.      North America: Market Size and Forecast, By Packaging Type, 2023 – 2033 ($ Million)

10.2.4.      North America: Market Size and Forecast, By End User, 2023 – 2033 ($ Million)

10.2.5.      US

10.2.5.1.       US: Market Size and Forecast, By Flavor Profile, 2023 – 2033 ($ Million)

10.2.5.2.       US: Market Size and Forecast, By Packaging Type, 2023 – 2033 ($ Million)

10.2.5.3.       US: Market Size and Forecast, By End User, 2023 – 2033 ($ Million)

10.2.6.      CANADA

10.2.6.1.       Canada: Market Size and Forecast, By Flavor Profile, 2023 – 2033 ($ Million)

10.2.6.2.       Canada: Market Size and Forecast, By Packaging Type, 2023 – 2033 ($ Million)

10.2.6.3.       Canada: Market Size and Forecast, By End User, 2023 – 2033 ($ Million)

10.2.7.      MEXICO

10.2.7.1.       Mexico: Market Size and Forecast, By Flavor Profile, 2023 – 2033 ($ Million)

10.2.7.2.       Mexico: Market Size and Forecast, By Packaging Type, 2023 – 2033 ($ Million)

10.2.7.3.       Mexico: Market Size and Forecast, By End User, 2023 – 2033 ($ Million)

10.3.     Europe

10.3.1.      Europe: Market Size and Forecast, By Country, 2023 – 2033 ($ Million)

10.3.2.      Europe: Market Size and Forecast, By Flavor Profile, 2023 – 2033 ($ Million)

10.3.3.      Europe: Market Size and Forecast, By Packaging Type, 2023 – 2033 ($ Million)

10.3.4.      Europe: Market Size and Forecast, By End User, 2023 – 2033 ($ Million)

10.3.5.      U.K.

10.3.5.1.       U.K.: Market Size and Forecast, By Flavor Profile, 2023 – 2033 ($ Million)

10.3.5.2.       U.K.: Market Size and Forecast, By Packaging Type, 2023 – 2033 ($ Million)

10.3.5.3.       U.K.: Market Size and Forecast, By End User, 2023 – 2033 ($ Million)

10.3.6.      GERMANY

10.3.6.1.       Germany: Market Size and Forecast, By Flavor Profile, 2023 – 2033 ($ Million)

10.3.6.2.       Germany: Market Size and Forecast, By Packaging Type, 2023 – 2033 ($ Million)

10.3.6.3.       Germany: Market Size and Forecast, By End User, 2023 – 2033 ($ Million)

10.3.7.      FRANCE

10.3.7.1.       France: Market Size and Forecast, By Flavor Profile, 2023 – 2033 ($ Million)

10.3.7.2.       France: Market Size and Forecast, By Packaging Type, 2023 – 2033 ($ Million)

10.3.7.3.       France: Market Size and Forecast, By End User, 2023 – 2033 ($ Million)

10.3.8.      ITALY

10.3.8.1.       Italy: Market Size and Forecast, By Flavor Profile, 2023 – 2033 ($ Million)

10.3.8.2.       Italy: Market Size and Forecast, By Packaging Type, 2023 – 2033 ($ Million)

10.3.8.3.       Italy: Market Size and Forecast, By End User, 2023 – 2033 ($ Million)

10.3.9.          SPAIN

10.3.9.1.       Spain: Market Size and Forecast, By Flavor Profile, 2023 – 2033 ($ Million)

10.3.9.2.       Spain: Market Size and Forecast, By Packaging Type, 2023 – 2033 ($ Million)

10.3.9.3.       Spain: Market Size and Forecast, By End User, 2023 – 2033 ($ Million)

10.3.10.        BENELUX

10.3.10.1.    BeNeLux: Market Size and Forecast, By Flavor Profile, 2023 – 2033 ($ Million)

10.3.10.2.    BeNeLux: Market Size and Forecast, By Packaging Type, 2023 – 2033 ($ Million)

10.3.10.3.    BeNeLux: Market Size and Forecast, By End User, 2023 – 2033 ($ Million)

10.3.11.        RUSSIA

10.3.11.1.    Russia: Market Size and Forecast, By Flavor Profile, 2023 – 2033 ($ Million)

10.3.11.2.    Russia: Market Size and Forecast, By Packaging Type, 2023 – 2033 ($ Million)

10.3.11.3.    Russia: Market Size and Forecast, By End User, 2023 – 2033 ($ Million)

10.3.12.        REST OF EUROPE

10.3.12.1.    Rest of Europe: Market Size and Forecast, By Flavor Profile, 2023 – 2033 ($ Million)

10.3.12.2.    Rest of Europe: Market Size and Forecast, By Packaging Type, 2023 – 2033 ($ Million)

10.3.12.3.    Rest of Europe: Market Size and Forecast, By End User, 2023 – 2033 ($ Million)

10.4.     Asia Pacific

10.4.1.      Asia Pacific: Market Size and Forecast, By Country, 2023 – 2033 ($ Million)

10.4.2.      Asia Pacific: Market Size and Forecast, By Flavor Profile, 2023 – 2033 ($ Million)

10.4.3.      Asia Pacific: Market Size and Forecast, By Packaging Type, 2023 – 2033 ($ Million)

10.4.4.      Asia Pacific: Market Size and Forecast, By End User, 2023 – 2033 ($ Million)

10.4.5.      CHINA

10.4.5.1.       China: Market Size and Forecast, By Flavor Profile, 2023 – 2033 ($ Million)

10.4.5.2.       China: Market Size and Forecast, By Packaging Type, 2023 – 2033 ($ Million)

10.4.5.3.       China: Market Size and Forecast, By End User, 2023 – 2033 ($ Million)

10.4.6.      JAPAN

10.4.6.1.       Japan: Market Size and Forecast, By Flavor Profile, 2023 – 2033 ($ Million)

10.4.6.2.       Japan: Market Size and Forecast, By Packaging Type, 2023 – 2033 ($ Million)

10.4.6.3.       Japan: Market Size and Forecast, By End User, 2023 – 2033 ($ Million)

10.4.7.      INDIA

10.4.7.1.       India: Market Size and Forecast, By Flavor Profile, 2023 – 2033 ($ Million)

10.4.7.2.       India: Market Size and Forecast, By Packaging Type, 2023 – 2033 ($ Million)

10.4.7.3.       India: Market Size and Forecast, By End User, 2023 – 2033 ($ Million)

10.4.8.      SOUTH KOREA

10.4.8.1.       South Korea: Market Size and Forecast, By Flavor Profile, 2023 – 2033 ($ Million)

10.4.8.2.       South Korea: Market Size and Forecast, By Packaging Type, 2023 – 2033 ($ Million)

10.4.8.3.       South Korea: Market Size and Forecast, By End User, 2023 – 2033 ($ Million)

10.4.9.          THAILAND

10.4.9.1.       Thailand: Market Size and Forecast, By Flavor Profile, 2023 – 2033 ($ Million)

10.4.9.2.       Thailand: Market Size and Forecast, By Packaging Type, 2023 – 2033 ($ Million)

10.4.9.3.       Thailand: Market Size and Forecast, By End User, 2023 – 2033 ($ Million)

10.4.10.        INDONESIA

10.4.10.1.    Indonesia: Market Size and Forecast, By Flavor Profile, 2023 – 2033 ($ Million)

10.4.10.2.    Indonesia: Market Size and Forecast, By Packaging Type, 2023 – 2033 ($ Million)

10.4.10.3.    Indonesia: Market Size and Forecast, By End User, 2023 – 2033 ($ Million)

10.4.11.        MALAYSIA

10.4.11.1.    Malaysia: Market Size and Forecast, By Flavor Profile, 2023 – 2033 ($ Million)

10.4.11.2.    Malaysia: Market Size and Forecast, By Packaging Type, 2023 – 2033 ($ Million)

10.4.11.3.    Malaysia: Market Size and Forecast, By End User, 2023 – 2033 ($ Million)

10.4.12.        AUSTRALIA

10.4.12.1.    Australia: Market Size and Forecast, By Flavor Profile, 2023 – 2033 ($ Million)

10.4.12.2.    Australia: Market Size and Forecast, By Packaging Type, 2023 – 2033 ($ Million)

10.4.12.3.    Australia: Market Size and Forecast, By End User, 2023 – 2033 ($ Million)

10.4.13.        REST FO ASIA PACIFIC

10.4.13.1.    Rest fo Asia Pacific: Market Size and Forecast, By Flavor Profile, 2023 – 2033 ($ Million)

10.4.13.2.    Rest fo Asia Pacific: Market Size and Forecast, By Packaging Type, 2023 – 2033 ($ Million)

10.4.13.3.    Rest fo Asia Pacific: Market Size and Forecast, By End User, 2023 – 2033 ($ Million)

10.5.     South America

10.5.1.      South America: Market Size and Forecast, By Country, 2023 – 2033 ($ Million)

10.5.2.      South America: Market Size and Forecast, By Flavor Profile, 2023 – 2033 ($ Million)

10.5.3.      South America: Market Size and Forecast, By Packaging Type, 2023 – 2033 ($ Million)

10.5.4.      South America: Market Size and Forecast, By End User, 2023 – 2033 ($ Million)

10.5.5.      BRAZIL

10.5.5.1.       Brazil: Market Size and Forecast, By Flavor Profile, 2023 – 2033 ($ Million)

10.5.5.2.       Brazil: Market Size and Forecast, By Packaging Type, 2023 – 2033 ($ Million)

10.5.5.3.       Brazil: Market Size and Forecast, By End User, 2023 – 2033 ($ Million)

10.5.6.      ARGENTINA

10.5.6.1.       Argentina: Market Size and Forecast, By Flavor Profile, 2023 – 2033 ($ Million)

10.5.6.2.       Argentina: Market Size and Forecast, By Packaging Type, 2023 – 2033 ($ Million)

10.5.6.3.       Argentina: Market Size and Forecast, By End User, 2023 – 2033 ($ Million)

10.5.7.      REST OF SOUTH AMERICA

10.5.7.1.       Rest of South America: Market Size and Forecast, By Flavor Profile, 2023 – 2033 ($ Million)

10.5.7.2.       Rest of South America: Market Size and Forecast, By Packaging Type, 2023 – 2033 ($ Million)

10.5.7.3.       Rest of South America: Market Size and Forecast, By End User, 2023 – 2033 ($ Million)

10.6.     Middle East & Africa

10.6.1.      Middle East & Africa: Market Size and Forecast, By Country, 2023 – 2033 ($ Million)

10.6.2.      Middle East & Africa: Market Size and Forecast, By Flavor Profile, 2023 – 2033 ($ Million)

10.6.3.      Middle East & Africa: Market Size and Forecast, By Packaging Type, 2023 – 2033 ($ Million)

10.6.4.      Middle East & Africa: Market Size and Forecast, By End User, 2023 – 2033 ($ Million)

10.6.5.      SAUDI ARABIA

10.6.5.1.       Saudi Arabia: Market Size and Forecast, By Flavor Profile, 2023 – 2033 ($ Million)

10.6.5.2.       Saudi Arabia: Market Size and Forecast, By Packaging Type, 2023 – 2033 ($ Million)

10.6.5.3.       Saudi Arabia: Market Size and Forecast, By End User, 2023 – 2033 ($ Million)

10.6.6.      UAE

10.6.6.1.       UAE: Market Size and Forecast, By Flavor Profile, 2023 – 2033 ($ Million)

10.6.6.2.       UAE: Market Size and Forecast, By Packaging Type, 2023 – 2033 ($ Million)

10.6.6.3.       UAE: Market Size and Forecast, By End User, 2023 – 2033 ($ Million)

10.6.7.      EGYPT

10.6.7.1.       Egypt: Market Size and Forecast, By Flavor Profile, 2023 – 2033 ($ Million)

10.6.7.2.       Egypt: Market Size and Forecast, By Packaging Type, 2023 – 2033 ($ Million)

10.6.7.3.       Egypt: Market Size and Forecast, By End User, 2023 – 2033 ($ Million)

10.6.8.      SOUTH AFRICA

10.6.8.1.       South Africa: Market Size and Forecast, By Flavor Profile, 2023 – 2033 ($ Million)

10.6.8.2.       South Africa: Market Size and Forecast, By Packaging Type, 2023 – 2033 ($ Million)

10.6.8.3.       South Africa: Market Size and Forecast, By End User, 2023 – 2033 ($ Million)

10.6.9.          REST OF MIDDLE EAST & AFRICA

10.6.9.1.       Rest of Middle East & Africa: Market Size and Forecast, By Flavor Profile, 2023 – 2033 ($ Million)

10.6.9.2.       Rest of Middle East & Africa: Market Size and Forecast, By Packaging Type, 2023 – 2033 ($ Million)

10.6.9.3.       Rest of Middle East & Africa: Market Size and Forecast, By End User, 2023 – 2033 ($ Million)

CHAPTER 12.             Competitive Landscape

12.1.     Competitior Benchmarking 2023

12.2.     Market Share Analysis

12.3.     Key Developments Analysis By Top 5 Companies

12.4.     Market Share Acquisition Strategies: Analysis of Key Approaches Employed by Top Players

CHAPTER 13.             Company Profiles

13.1.     Diageo plc

13.1.1.      Business Overview

13.1.2.      Financial Analysis

13.1.2.1.       Business Segment Revenue, 2020, 2021, 2022, $ Million

13.1.2.2.       Geographic Revenue Mix, 2022 (% Share)

13.1.3.      Product Portfolio

13.1.4.      Recent Development and Strategies Adopted

13.1.5.      SWOT Analysis

13.2.     Pernod Ricard SA

13.3.     Bacardi Limited

13.4.     Brown-Forman Corporation

13.5.     Anheuser-Busch

13.6.     Beam Suntory Inc

13.7.     The Coca-Cola Company

13.8.     Heineken

13.9.     Constellation Brands, Inc

13.10. Campari Group

Connect to Analyst

Connect to Analyst

Pricing

Pricing

Report Type Description Price How to Purchase
Full Report (200+ Pages PDF Report) This report gives a detailed analysis of the industry which includes Market Dynamics, Industry Trends, Segmental, Regional and Country level market estimation & forecast to 2033, competitive landscape, and company profiles.
(Customization Possible as per your need)
$3,475 Click on Buy Now
Market Overview Report
(10-15 Page PDF Summary Report)
This report gives a brief idea about the industry, without being too heavy on your budget. It gives you an understanding of current and future market scenarios (long-term and short-term), major dynamics and their impact analysis, top-level regional analysis, and competitive benchmarking of 10 key competitors in the market.
(Customization Possible as per your need)
$250 Connect with our Sales Representative by Email or Filling Form on the side
Competitive Intelligence Report
(35-45 Pages PDF Report)
This report gives you a detailed understanding of key competitors in the market. This report includes competitive benchmarking of 15 key competitors, market share of the top 5 competitors, key strategies adopted by the top 5 players, and key market share acquisition strategies adopted in the market.
(Customization Possible as per your need)
$750 Connect with our Sales Representative by Email or Filling Form on the side
Excel Data Pack
(Excel Report)
This report includes market Segmental, Regional, and Country level market estimation & forecast to 2033 in Excel format.
(Customization Possible as per your need)
$2,499 Connect with our Sales Representative by Email or Filling Form on the side


Research Methodology

Research Methodology