Prebiotic Ingredient Market Analysis and Global Forecast 2024-2034

$ 1,390.00$ 5,520.00

Prebiotic Ingredient Market Research Report: Information By Type (Oligosaccharides, Inulin, Polydextrose, Others), By Function (Gut Health, Bone Health, Immunity, Heart Health, Weight Management), By Application (Bakery and Confectionery, Dairy and Frozen Desserts, Dietary Supplements, Sweet and Savory Snacks, Oil And Fats, Beverages and Others), and by Region — Forecast till 2034

Page: 129

Report Published on: March 23, 2025
$ 3,470.00
$ 5,520.00
$ 1,390.00
Report Code: EBI16559 Category:
Description

Prebiotic Ingredient Market Overview

The Prebiotic Ingredient Market size accounted for USD 6.51 Billion in 2023 and is estimated to account for 7.21 Billion in 2024. The Market is expected to reach USD 13.85 Billion by 2034 growing at a compound annual growth rate (CAGR) of 10.25% from 2024 to 2034. The Prebiotic Ingredient Market is experiencing significant growth due to increasing consumer awareness about gut health and the rising demand for functional foods. Prebiotics are non-digestible fibers that promote the growth of beneficial gut bacteria, aiding digestion and overall health. Prebiotics are being incorporated into a wide range of food and beverage products to enhance their nutritional value.

The prebiotic ingredient market is poised for continued growth as consumers prioritize gut health and seek out functional food and beverage products. The Prebiotic Ingredient Market is driven by the growing understanding of the importance of gut health and the desire for products that support a healthy microbiome.

Global Prebiotic Ingredient Market Synopsis
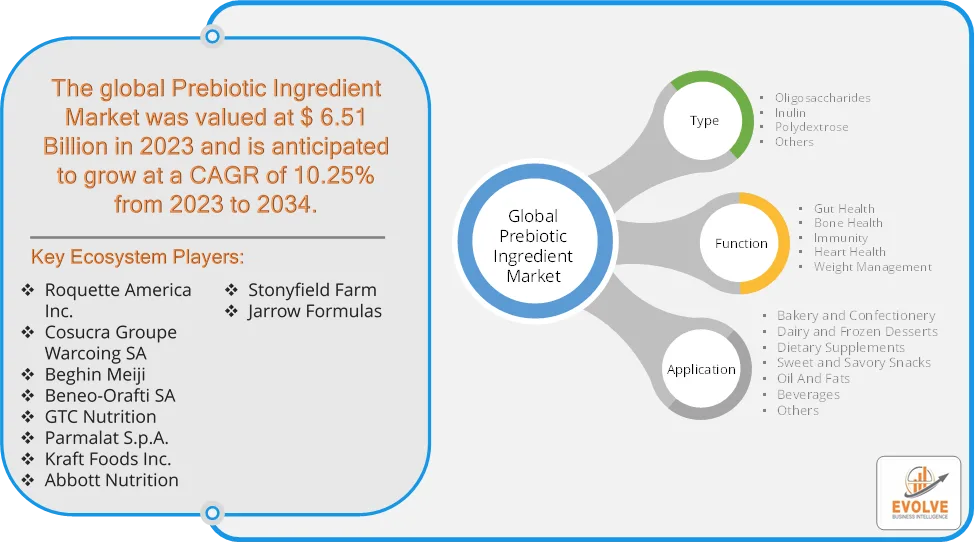
Prebiotic Ingredient Market AnalysisPrebiotic Ingredient Market Dynamics

The major factors that have impacted the growth of Prebiotic Ingredient Market are as follows:

Drivers:

Ø  Increasing Demand for Functional Foods & Beverages

Prebiotic ingredients are widely used in yogurt, dairy products, cereals, and beverages to enhance their nutritional profile. Growing preference for natural and clean-label products is boosting demand. Plant-based prebiotic sources like chicory root, Jerusalem artichoke, and bananas are gaining traction as consumers seek natural alternatives to synthetic ingredients. The increasing incidence of obesity, diabetes, and gastrointestinal disorders is driving demand for prebiotic ingredients that support weight management, metabolic health, and immune function.

Restraint:

  • High Production & Processing Costs

Extracting and purifying prebiotic ingredients (e.g., inulin, GOS, FOS) can be expensive, increasing product prices. High raw material costs, especially for plant-based sources like chicory root and Jerusalem artichoke, impact affordability. Some consumers experience bloating, gas, or digestive discomfort when consuming prebiotic-rich foods, leading to reluctance and misinformation about prebiotics and their effects may limit adoption.

Opportunity:

⮚     Rising Demand for Personalized Nutrition & Microbiome-Based Products

Increasing interest in gut microbiome research is leading to customized prebiotic formulations for targeted health benefits. Companies can develop personalized prebiotic supplements based on individual gut health needs. Athletes and fitness enthusiasts are turning to prebiotic-enriched products for enhanced digestion, metabolism, and energy balance and Prebiotic fiber-based weight management supplements are gaining popularity in the wellness industry.

Prebiotic Ingredient Market Segment Overview

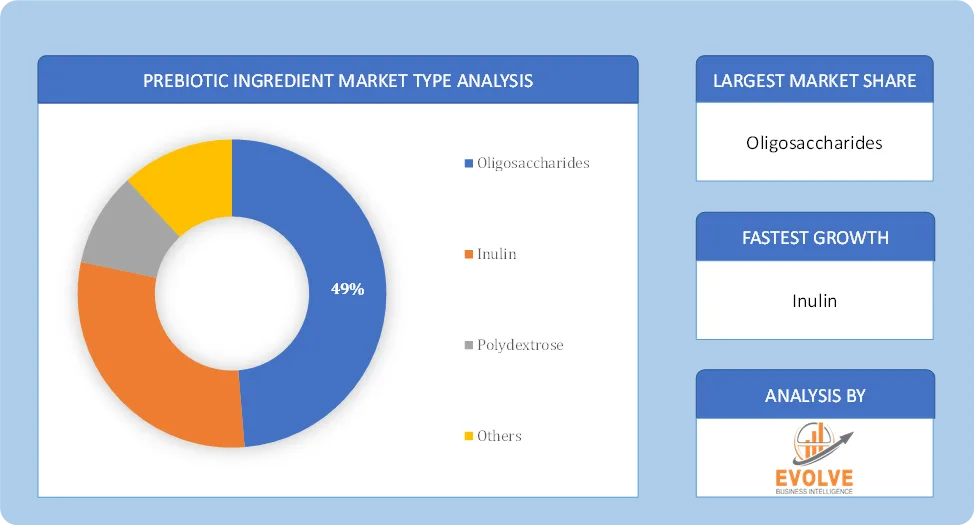
Prebiotic Ingredient Market Type AnalysisBy Type

Based on Type, the market is segmented based on Oligosaccharides, Inulin, Polydextrose, Others. The inulin segment dominant the market. Inulin is a rich source of fructans, a type of dietary fiber. These are naturally occurring polysaccharides that are produced by a variety of plants, but they are most commonly isolated from chicory. The inulin segment is expected to grow significantly during the forecast years due to the increasing use of prebiotic ingredients in the dairy processing industry and the manufacturing of various foods and drinks.

By Function

Based on Function, the market segment has been divided into Gut Health, Bone Health, Immunity, Heart Health, Weight Management. The Gut Health segment dominant the market. Increased awareness of gut microbiome’s role in overall health. The prebiotics primarily support digestive health by feeding beneficial gut bacteria.

By Application

Based on Application, the market segment has been divided into Bakery and Confectionery, Dairy and Frozen Desserts, Dietary Supplements, Sweet and Savory Snacks, Oil And Fats, Beverages and Others. The Beverages segment dominant the market. Lifestyle changes, shifting consumer food preferences, and rising demand for beverages are factors driving the expansion of this market sector. The increasing demand for specialty foods such as lactose-free foods is accelerating the expansion of this market sector.

Global Prebiotic Ingredient Market Regional Analysis

Based on region, the global Prebiotic Ingredient Market has been divided into North America, Europe, Asia-Pacific, the Middle East & Africa, and Latin America. North America is projected to dominate the use of the Prebiotic Ingredient Market followed by the Asia-Pacific and Europe regions.
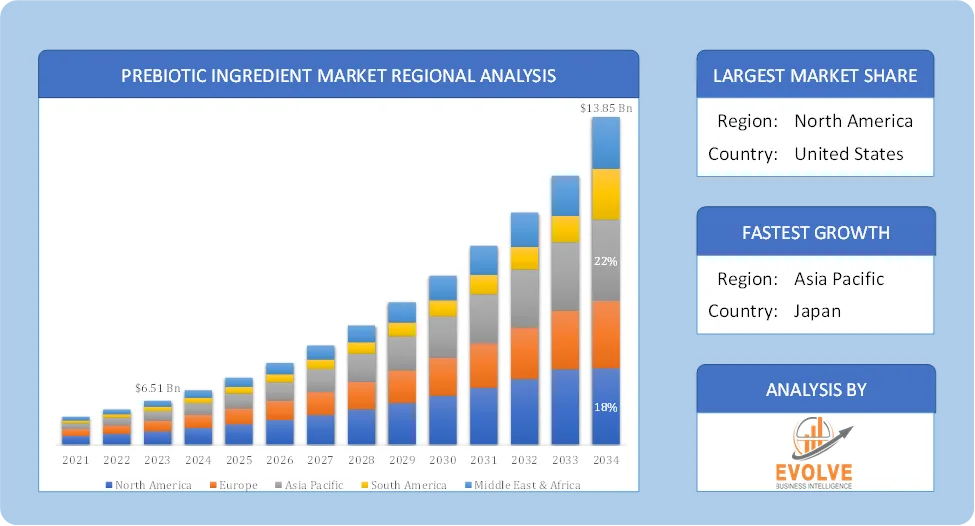
Global Prebiotic Ingredient Market Regional AnalysisNorth America Prebiotic Ingredient Market

North America holds a dominant position in the Prebiotic Ingredient Market. North America has historically held a significant share of the prebiotic ingredient market. This is largely attributed to high consumer awareness of gut health, a well-established dietary supplement industry, and strong purchasing power. Rising consumer preference for clean-label and plant-based ingredients and Increasing adoption of prebiotics in pet food and animal feed.

Asia-Pacific Prebiotic Ingredient Market

The Asia-Pacific region has indeed emerged as the fastest-growing market for the Prebiotic Ingredient Market industry. This growth is driven by rising disposable incomes, increasing health consciousness, and a rapidly expanding food and beverage industry. Increasing awareness of traditional medicine and gut health and rising demand for infant formula and dietary supplements.

Competitive Landscape

The global Prebiotic Ingredient Market is highly competitive, with numerous players offering a wide range of software solutions. The competitive landscape is characterized by the presence of established companies, as well as emerging startups and niche players. To increase their market position and attract a wide consumer base, the businesses are employing various strategies, such as product launches, and strategic alliances.

Prominent Players:

  • Roquette America Inc.
  • Cosucra Groupe Warcoing SA
  • Beghin Meiji
  • Beneo-Orafti SA
  • GTC Nutrition
  • Parmalat S.p.A.
  • Kraft Foods Inc.
  • Abbott Nutrition
  • Stonyfield Farm
  • Jarrow Formulas.

Scope of the Report

Global Prebiotic Ingredient Market, by Type
  • Oligosaccharides
  • Inulin
  • Polydextrose
  • Others
Global Prebiotic Ingredient Market, by Function
  • Gut Health
  • Bone Health
  • Immunity
  • Heart Health
  • Weight Management
Global Prebiotic Ingredient Market, by Application
  • Bakery and Confectionery
  • Dairy and Frozen Desserts
  • Dietary Supplements
  • Sweet and Savory Snacks
  • Oil And Fats
  • Beverages
  • Others
Global Prebiotic Ingredient Market, by Region
  • North America
    • US
    • Canada
    • Mexico
  • Europe
    • UK
    • Germany
    • France
    • Italy
    • Spain
    • Benelux
    • Nordic
    • Rest of Europe
  • Asia Pacific
    • China
    • Japan
    • South Korea
    • Indonesia
    • Austalia
    • Malaysia
    • India
    • Rest of Asia Pacific
  • South America
    • Brazil
    • Argentina
    • Rest of South America
  • Middle East & Africa
    • Saudi Arabia
    • UAE
    • Egypt
    • South Africa
    • Rest of Middle East & Africa


Parameters Indicators
Market Size 2034: USD 10.25 Billion
CAGR (2024-2034) 13.85%
Base year 2022
Forecast Period 2024-2034
Historical Data 2021 (2017 to 2020 On Demand)
Report Coverage Revenue Forecast, Competitive Landscape, Growth Factors, and Trends
Key Segmentations Type, Application, Function
Geographies Covered North America, Europe, Asia-Pacific, South America, Middle East, Africa
Key Vendors Roquette America Inc., Cosucra Groupe Warcoing SA, Beghin Meiji, Beneo-Orafti SA, GTC Nutrition, Parmalat S.p.A., Kraft Foods Inc., Abbott Nutrition, Stonyfield Farm and Jarrow Formulas.
Key Market Opportunities ·       Rising Demand for Personalized Nutrition & Microbiome-Based Products

·       Growing Popularity of Prebiotics in Sports Nutrition & Weight Management

Key Market Drivers ·       Increasing Demand for Functional Foods & Beverages

·       Growing Popularity of Plant-Based & Vegan Diets


REPORT CONTENT BRIEF:

  • High-level analysis of the current and future Prebiotic Ingredient Market trends and opportunities
  • Detailed analysis of current market drivers, restraining factors, and opportunities in the future
  • Prebiotic Ingredient Market historical market size for the year 2021, and forecast from 2023 to 2033
  • Prebiotic Ingredient Market share analysis at each product level
  • Competitor analysis with detailed insight into its product segment, Government & Defense strength, and strategies adopted.
  • Identifies key strategies adopted including product launches and developments, mergers and acquisitions, joint ventures, collaborations, and partnerships as well as funding taken and investment done, among others.
  • To identify and understand the various factors involved in the global Prebiotic Ingredient Market affected by the pandemic
  • To provide a detailed insight into the major companies operating in the market. The profiling will include the Government & Defense health of the company’s past 2-3 years with segmental and regional revenue breakup, product offering, recent developments, SWOT analysis, and key strategies.

Frequently Asked Questions (FAQ)

The global Prebiotic Ingredient Market is growing at a CAGR of 6.13% over the next 10 years

Asia Pacific is expected to register the highest CAGR during 2024-2034

Roquette America Inc., Cosucra Groupe Warcoing SA, Beghin Meiji, Beneo-Orafti SA, GTC Nutrition, Parmalat S.p.A., Kraft Foods Inc., Abbott Nutrition, Stonyfield Farm and Jarrow Formulas. are the major companies operating in the market.

Yes, we offer 16 hours of analyst support to solve the queries

Yes, we provide regional as well as country-level reports. Other than this we also provide a sectional report. Please get in contact with our sales representatives.

For more details mail us at

Ask a question / additional requirement

Table of Contents

Table of Contents

CHAPTER 1.      Executive Summary

CHAPTER 2.      Scope of the Study

2.1.       Market Definition

2.2.       Market Scope & Segmentation

2.2.1.    Objective of Report

CHAPTER 3.         Evolve BI Methodology

3.1.       Data Collection & Validation Approach

3.2.       Market Size Estimation and Forecast

CHAPTER 4.         Exclusive Analysis

4.1.       Market Opportunity Score

4.1.1.    Source Segement – Market Opportunity Score

4.1.2.    Production Technology Segment – Market Opportunity Score

4.1.3.    End Use Segment – Market Opportunity Score

4.2.       Key Market Influencing Indicators

CHAPTER 5.         Market Insights and Trends

5.1.       Value Chain Analysis

5.1.1.    Raw Material

5.1.2.    Manufacturing Process

5.1.3.    Distribution Channel

5.1.4.    End User

5.2.       Porter’s Five Forces Analysis

5.2.1.    Bargaining Power of Buyers

5.2.2.    Bargaining Power of Suppliers

5.2.3.    Threat of New Entrant

5.2.4.    Threat of Substitute

5.2.5.    Industry Rivalry

5.3.       COVID-19 Impact and Post COVID Scenario on Cultured Meat Market

5.3.1.    Impact of COVID-19

5.3.2.    Government Support and Industry Revival Policies

5.3.3.    Measures Taken by Companies to Mitigate Negative Impact

5.3.4.    Post COVID Trend

CHAPTER 6.             Market Dynamics

6.1.       Introduction

6.2.       Drivers

6.2.1.    Driver 1

6.2.2.    Driver 2

6.2.3.    Driver 3

6.3.       Restraints

6.3.1.    Restraint 1

6.3.2.    Restraint 2

6.4.       Opportunity

6.4.1.    Opportunity 1

CHAPTER 7.          Cultured Meat Market, By Source

7.1.       Introduction

7.1.1.    Poultry

7.1.2    Beef

7.1.3    Seafood

7.1.4   Pork

7.1.5   Duck

CHAPTER 8             Cultured Meat Market, By Production Technology

8.1.       Introduction

8.1.1.    Scaffold-Based Technology

8.1.2.   Scaffold-Free Technology

8.1.3.   Others

CHAPTER 9.     Cultured Meat Market, By End Use

9.1.       Introduction

9.1.1.    Nuggets

9.1.2.    Burgers

9.1.3.     Meatballs

 9.1.4.     Sausage

9.1.5.      Hot dogs

9.1.6.    Beverages

9.1.7.    Others

CHAPTER 10.     Cultured Meat Market, By Region

10.1.     Introduction

10.2.     NORTH AMERICA

10.2.1. North America: Market Size and Forecast, By Country, 2024 – 2034($ Million)

10.2.2. North America: Market Size and Forecast, By Source, 2024 – 2034($ Million)

10.2.3. North America: Market Size and Forecast, By Production Technology, 2024 – 2034($ Million)

10.2.4. North America: Market Size and Forecast, By End Use, 2024 – 2034($ Million)

10.2.5. US

10.2.5.1. US: Market Size and Forecast, By Source, 2024 – 2034($ Million)

10.2.5.2. US: Market Size and Forecast, By Production Technology, 2024 – 2034($ Million)

10.2.5.3. US: Market Size and Forecast, By End Use, 2024 – 2034($ Million)

10.2.6. CANADA

10.2.6.1. Canada: Market Size and Forecast, By Source, 2024 – 2034($ Million)

10.2.6.2. Canada: Market Size and Forecast, By Production Technology, 2024 – 2034($ Million)

10.2.6.3. Canada: Market Size and Forecast, By End Use, 2024 – 2034($ Million)

10.2.7. MEXICO

10.2.7.1. Mexico: Market Size and Forecast, By Source, 2024 – 2034($ Million)

10.2.7.2. Mexico: Market Size and Forecast, By Production Technology, 2024 – 2034($ Million)

10.2.7.3. Mexico: Market Size and Forecast, By End Use, 2024 – 2034($ Million)

10.3.     Europe

10.3.1. Europe: Market Size and Forecast, By Country, 2024 – 2034($ Million)

10.3.2. Europe: Market Size and Forecast, By Source, 2024 – 2034($ Million)

10.3.3. Europe: Market Size and Forecast, By Production Technology, 2024 – 2034($ Million)

10.3.4. Europe: Market Size and Forecast, By End Use, 2024 – 2034($ Million)

10.3.5. U.K.

10.3.5.1. U.K.: Market Size and Forecast, By Source, 2024 – 2034($ Million)

10.3.5.2. U.K.: Market Size and Forecast, By Production Technology, 2024 – 2034($ Million)

10.3.5.3. U.K.: Market Size and Forecast, By End Use, 2024 – 2034($ Million)

10.3.6. GERMANY

10.3.6.1. Germany: Market Size and Forecast, By Source, 2024 – 2034($ Million)

10.3.6.2. Germany: Market Size and Forecast, By Production Technology, 2024 – 2034($ Million)

10.3.6.3. Germany: Market Size and Forecast, By End Use, 2024 – 2034($ Million)

10.3.7. FRANCE

10.3.7.1. France: Market Size and Forecast, By Source, 2024 – 2034($ Million)

10.3.7.2. France: Market Size and Forecast, By Production Technology, 2024 – 2034($ Million)

10.3.7.3. France: Market Size and Forecast, By End Use, 2024 – 2034($ Million)

10.3.8. ITALY

10.3.8.1. Italy: Market Size and Forecast, By Source, 2024 – 2034($ Million)

10.3.8.2. Italy: Market Size and Forecast, By Production Technology, 2024 – 2034($ Million)

10.3.8.3. Italy: Market Size and Forecast, By End Use, 2024 – 2034($ Million)

10.3.9. SPAIN

10.3.9.1. Spain: Market Size and Forecast, By Source, 2024 – 2034($ Million)

10.3.9.2. Spain: Market Size and Forecast, By Production Technology, 2024 – 2034($ Million)

10.3.9.3. Spain: Market Size and Forecast, By End Use, 2024 – 2034($ Million)

10.3.10. BENELUX

10.3.10.1. BeNeLux: Market Size and Forecast, By Source, 2024 – 2034($ Million)

10.3.10.2. BeNeLux: Market Size and Forecast, By Production Technology, 2024 – 2034($ Million)

10.3.10.3. BeNeLux: Market Size and Forecast, By End Use, 2024 – 2034($ Million)

10.3.11. RUSSIA

10.3.11.1. Russia: Market Size and Forecast, By Source, 2024 – 2034($ Million)

10.3.11.2. Russia: Market Size and Forecast, By Production Technology, 2024 – 2034($ Million)

10.3.11.3. Russia: Market Size and Forecast, By End Use, 2024 – 2034($ Million)

10.3.12. REST OF EUROPE

10.3.12.1. Rest of Europe: Market Size and Forecast, By Source, 2024 – 2034($ Million)

10.3.12.2. Rest of Europe: Market Size and Forecast, By Production Technology, 2024 – 2034($ Million)

10.3.12.3. Rest of Europe: Market Size and Forecast, By End Use, 2024 – 2034($ Million)

10.4.     Asia Pacific

10.4.1. Asia Pacific: Market Size and Forecast, By Country, 2024 – 2034($ Million)

10.4.2. Asia Pacific: Market Size and Forecast, By Source, 2024 – 2034($ Million)

10.4.3. Asia Pacific: Market Size and Forecast, By Production Technology, 2024 – 2034($ Million)

10.4.4. Asia Pacific: Market Size and Forecast, By End Use, 2024 – 2034($ Million)

10.4.5. CHINA

10.4.5.1. China: Market Size and Forecast, By Source, 2024 – 2034($ Million)

10.4.5.2. China: Market Size and Forecast, By Production Technology, 2024 – 2034($ Million)

10.4.5.3. China: Market Size and Forecast, By End Use, 2024 – 2034($ Million)

10.4.6. JAPAN

10.4.6.1. Japan: Market Size and Forecast, By Source, 2024 – 2034($ Million)

10.4.6.2. Japan: Market Size and Forecast, By Production Technology, 2024 – 2034($ Million)

10.4.6.3. Japan: Market Size and Forecast, By End Use, 2024 – 2034($ Million)

10.4.7. INDIA

10.4.7.1. India: Market Size and Forecast, By Source, 2024 – 2034($ Million)

10.4.7.2. India: Market Size and Forecast, By Production Technology, 2024 – 2034($ Million)

10.4.7.3. India: Market Size and Forecast, By End Use, 2024 – 2034($ Million)

10.4.8. SOUTH KOREA

10.4.8.1. South Korea: Market Size and Forecast, By Source, 2024 – 2034($ Million)

10.4.8.2. South Korea: Market Size and Forecast, By Production Technology, 2024 – 2034($ Million)

10.4.8.3. South Korea: Market Size and Forecast, By End Use, 2024 – 2034($ Million)

10.4.9. THAILAND

10.4.9.1. Thailand: Market Size and Forecast, By Source, 2024 – 2034($ Million)

10.4.9.2. Thailand: Market Size and Forecast, By Production Technology, 2024 – 2034($ Million)

10.4.9.3. Thailand: Market Size and Forecast, By End Use, 2024 – 2034($ Million)

10.4.10. INDONESIA

10.4.10.1. Indonesia: Market Size and Forecast, By Source, 2024 – 2034($ Million)

10.4.10.2. Indonesia: Market Size and Forecast, By Production Technology, 2024 – 2034($ Million)

10.4.10.3. Indonesia: Market Size and Forecast, By End Use, 2024 – 2034($ Million)

10.4.11. MALAYSIA

10.4.11.1. Malaysia: Market Size and Forecast, By Source, 2024 – 2034($ Million)

10.4.11.2. Malaysia: Market Size and Forecast, By Production Technology, 2024 – 2034($ Million)

10.4.11.3. Malaysia: Market Size and Forecast, By End Use, 2024 – 2034($ Million)

10.4.12. AUSTRALIA

10.4.12.1. Australia: Market Size and Forecast, By Source, 2024 – 2034($ Million)

10.4.12.2. Australia: Market Size and Forecast, By Production Technology, 2024 – 2034($ Million)

10.4.12.3. Australia: Market Size and Forecast, By End Use, 2024 – 2034($ Million)

10.4.13. REST FO ASIA PACIFIC

10.4.13.1. Rest fo Asia Pacific: Market Size and Forecast, By Source, 2024 – 2034($ Million)

10.4.13.2. Rest fo Asia Pacific: Market Size and Forecast, By Production Technology, 2024 – 2034($ Million)

10.4.13.3. Rest fo Asia Pacific: Market Size and Forecast, By End Use, 2024 – 2034($ Million)

10.5.     South America

10.5.1. South America: Market Size and Forecast, By Country, 2024 – 2034($ Million)

10.5.2. South America: Market Size and Forecast, By Source, 2024 – 2034($ Million)

10.5.3. South America: Market Size and Forecast, By System, 2024 – 2034($ Million)

10.5.4. South America: Market Size and Forecast, By End Use, 2024 – 2034($ Million)

10.5.5. BRAZIL

10.5.5.1. Brazil: Market Size and Forecast, By Source, 2024 – 2034($ Million)

10.5.5.2. Brazil: Market Size and Forecast, By Production Technology, 2024 – 2034($ Million)

10.5.5.3. Brazil: Market Size and Forecast, By End Use, 2024 – 2034($ Million)

10.5.6. ARGENTINA

10.5.6.1. Argentina: Market Size and Forecast, By Source, 2024 – 2034($ Million)

10.5.6.2. Argentina: Market Size and Forecast, By Production Technology, 2024 – 2034($ Million)

10.5.6.3. Argentina: Market Size and Forecast, By End Use, 2024 – 2034($ Million)

10.5.7. REST OF SOUTH AMERICA

10.5.7.1. Rest of South America: Market Size and Forecast, By Source, 2024 – 2034($ Million)

10.5.7.2. Rest of South America: Market Size and Forecast, By Production Technology, 2024 – 2034($ Million)

10.5.7.3. Rest of South America: Market Size and Forecast, By End Use, 2024 – 2034($ Million)

10.6.     Middle East & Africa

10.6.1. Middle East & Africa: Market Size and Forecast, By Country, 2024 – 2034($ Million)

10.6.2. Middle East & Africa: Market Size and Forecast, By Source, 2024 – 2034($ Million)

10.6.3. Middle East & Africa: Market Size and Forecast, By Production Technology, 2024 – 2034($ Million)

10.6.4. Middle East & Africa: Market Size and Forecast, By End Use, 2024 – 2034($ Million)

10.6.5. SAUDI ARABIA

10.6.5.1. Saudi Arabia: Market Size and Forecast, By Source, 2024 – 2034($ Million)

10.6.5.2. Saudi Arabia: Market Size and Forecast, By Production Technology, 2024 – 2034($ Million)

10.6.5.3. Saudi Arabia: Market Size and Forecast, By End Use, 2024 – 2034($ Million)

10.6.6. UAE

10.6.6.1. UAE: Market Size and Forecast, By Source, 2024 – 2034($ Million)

10.6.6.2. UAE: Market Size and Forecast, By Production Technology, 2024 – 2034($ Million)

10.6.6.3. UAE: Market Size and Forecast, By End Use, 2024 – 2034($ Million)

10.6.7. EGYPT

10.6.7.1. Egypt: Market Size and Forecast, By Source, 2024 – 2034($ Million)

10.6.7.2. Egypt: Market Size and Forecast, By Production Technology, 2024 – 2034($ Million)

10.6.7.3. Egypt: Market Size and Forecast, By End Use, 2024 – 2034($ Million)

10.6.8. SOUTH AFRICA

10.6.8.1. South Africa: Market Size and Forecast, By Source, 2024 – 2034($ Million)

10.6.8.2. South Africa: Market Size and Forecast, By Production Technology, 2024 – 2034($ Million)

10.6.8.3. South Africa: Market Size and Forecast, By End Use, 2024 – 2034($ Million)

10.6.9. REST OF MIDDLE EAST & AFRICA

10.6.9.1. Rest of Middle East & Africa: Market Size and Forecast, By Source, 2024 – 2034($ Million)

10.6.9.2. Rest of Middle East & Africa: Market Size and Forecast, By Production Technology, 2024 – 2034($ Million)

10.6.9.3.Rest of Middle East & Africa: Market Size and Forecast, By End Use, 2024 – 2034($ Million)

CHAPTER 12. Competitive Landscape

12.1.     Competitior Benchmarking 2023-

12.2.     Market Share Analysis

12.3.     Key Developments Analysis By Top 5 Companies

12.4.     Market Share Acquisition Strategies: Analysis of Key Approaches Employed by Top Players

CHAPTER 13. Company Profiles

13.1.     Avant Meats Company Limited

13.1.1. Hanon Systems

13.1.2. Financial Analysis

13.1.2.1. Business Segment Revenue, 2020, 2021, 2022, $ Million

13.1.2.2. Geographic Revenue Mix, 2022 (% Share)

13.1.3. Product Portfolio

13.1.4. Recent Development and Strategies Adopted

13.1.5. SWOT Analysis

13.2.     Biftek INC

13.3.     Mosa Meat

13.4.     BioFood Systems Ltd

13.5.     Shiok Meats Pte Ltd

13.6.     SuperMeat

13.7.     Meatable

13.8.    Finless Foods Inc.

13.9     Future Meat Technologies Ltd

13.10   UPSIDE Foods.


Connect To Analyst

Connect To Analyst

Research Methodology

Research Methodology