Plant-based Protein Market Analysis and Global Forecast 2023-2033
$ 1,390.00 – $ 5,520.00Price range: $ 1,390.00 through $ 5,520.00
Plant-based Protein Market Research Report: Information By Type (Concentrates, Isolates, Others), By Livestock (Pets, Swine, Ruminants, Others), By Source (Soy, Wheat, Pea, Others), and by Region — Forecast till 2033
Page: 164
Plant-based Protein Market Overview
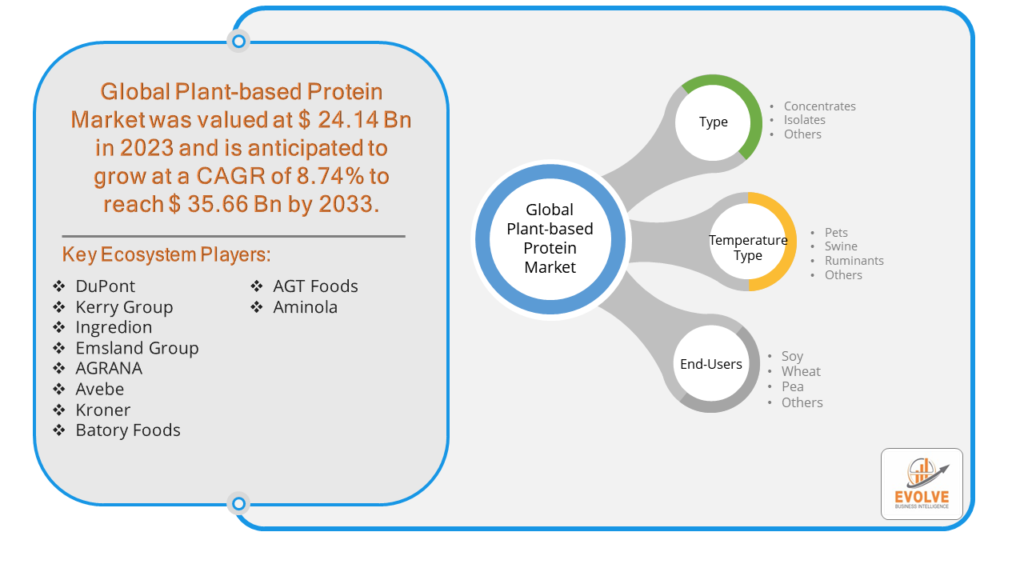
The Plant-based Protein Market Size is expected to reach USD 35.66 Billion by 2033. The Plant-based Protein Market industry size accounted for USD 24.14 Billion in 2023 and is expected to expand at a compound annual growth rate (CAGR) of 8.74% from 2023 to 2033. The plant-based protein market is the market for products that derive their protein content from plants. This includes a wide range of products, such as tofu, tempeh, lentils, beans, nuts, seeds, and grains. The plant-based protein market is growing rapidly, driven by a Increasing consumer interest in health and wellness and Growing awareness of the environmental impact of animal agriculture
The plant-based protein market is a rapidly growing market with a bright future. As consumers become more aware of the benefits of plant-based protein, the demand for these products is expected to continue to rise. Increasing investment in plant-based protein research and development of new and innovative plant-based protein products
Global Plant-based Protein Market Synopsis
The COVID-19 pandemic has significantly impacted the Plant-based Protein Market. The pandemic has heightened consumer awareness about health and immunity, driving demand for healthier food options, including plant-based proteins. People are more conscious of their diet and its impact on overall health. With lockdowns and restrictions on dining out, more people turned to home cooking. This led to increased experimentation with plant-based recipes and products, boosting sales of plant-based protein ingredients and packaged foods. Plant-based protein producers experienced fewer disruptions compared to the meat industry, which faced significant challenges due to COVID-19 outbreaks in processing plants. This resilience in supply chains contributed to the growth of the plant-based protein market. The shift towards online shopping during the pandemic benefited plant-based protein brands that leveraged e-commerce platforms to reach consumers directly. Many companies saw increased online sales and broadened their customer base.
Plant-based Protein Market Dynamics
The major factors that have impacted the growth of Plant-based Protein Market are as follows:
Drivers:
Ø Health and Wellness Trends
Consumers are becoming more health-conscious, seeking foods that offer nutritional benefits and support overall well-being. Plant-based proteins are often perceived as healthier alternatives to animal proteins due to their lower saturated fat and cholesterol content. There is a growing interest in plant-based diets such as vegetarianism, veganism, and flexitarianism, which emphasize the consumption of plant-derived foods for their health benefits. Younger generations are more open to trying new and alternative food products. They are also more likely to adopt plant-based diets due to their environmental and ethical considerations. The availability of plant-based protein products in mainstream grocery stores, restaurants, and fast-food chains makes it convenient for consumers to access and try these products.
Restraint:
- Perception of Price and Accessibility
Plant-based protein products are often more expensive than their animal-based counterparts due to the costs associated with sourcing raw materials, production processes, and smaller economies of scale. This price difference can be a barrier for cost-conscious consumers. plant-based protein products may not be as widely available, especially in rural or less developed areas. This limits consumer access and adoption. Some consumers may have concerns about the nutritional completeness of plant-based proteins, particularly regarding essential amino acids, vitamins, and minerals that are readily available in animal-based proteins.
Opportunity:
⮚ Technological Advancements
Continued advancements in food technology can improve the taste, texture, and nutritional profile of plant-based proteins, making them more appealing to consumers. Techniques like fermentation, extrusion, and the use of novel ingredients can enhance product quality. Leveraging biotechnology to develop new sources of plant-based proteins, such as algae, fungi, and cultured plant cells, can create unique products that address specific consumer needs. Emphasizing sustainable sourcing practices, such as using non-GMO ingredients and reducing environmental impact, can attract environmentally conscious consumers. Providing transparency about ingredient sourcing, production processes, and environmental impact can build trust and loyalty among consumers who prioritize ethical consumption.
Plant-based Protein Market Segment Overview
By Type
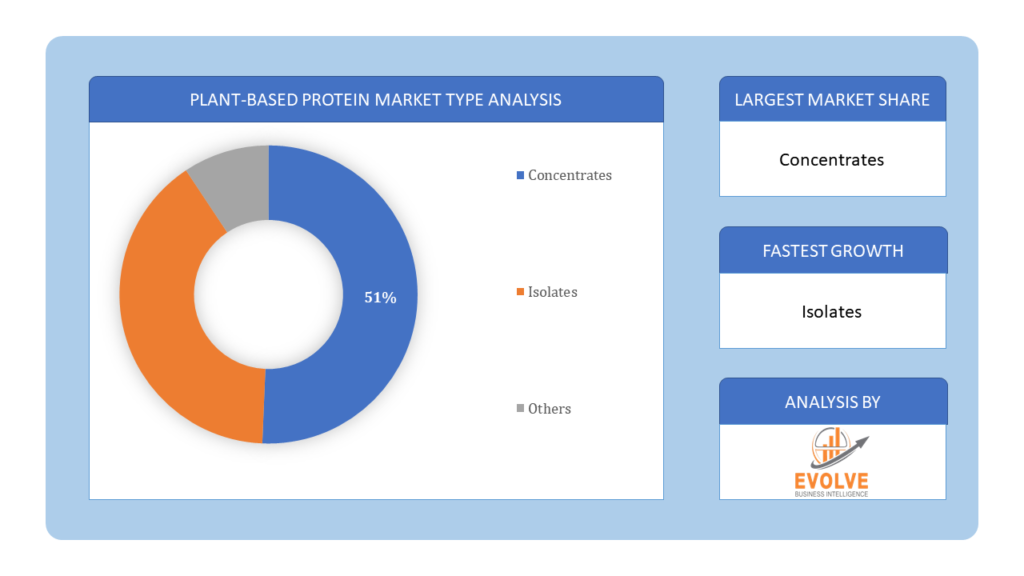
 Based on Type, the market is segmented based on Concentrates, Isolates and Others. The isolate segment holds the largest share of plant-based protein market. Their functional properties that include high concentration of proteins and easily digestible nature boost the market growth. Isolates are produced through various extraction and purification methods designed to separate protein from other components of the plant material, such as carbohydrates, fats, fiber, and minerals.
By Livestock
Based on Livestock, the market segment has been divided into the Pets, Swine, Ruminants and Others. Swine diets traditionally rely on protein sources derived from animal products such as soybean meal and fishmeal. However, there is growing interest in incorporating plant-based protein ingredients to reduce reliance on animal-derived feed ingredients.
By Source
Based on Source, the market segment has been divided into the Soy, Wheat, Pea and Others. Soy is the most dominating segment in plant-based protein market. Soy are highly rich in protein, fiber and are beneficial to digestive health. Soybean meal is a primary protein source in swine diets, providing essential amino acids and nutrients required for growth and production. It is rich in essential amino acids, particularly lysine, methionine, and threonine, which are crucial for animal growth, reproduction, and overall health.
Global Plant-based Protein Market Regional Analysis
Based on region, the global Plant-based Protein Market has been divided into North America, Europe, Asia-Pacific, the Middle East & Africa, and Latin America. North America is projected to dominate the use of the Plant-based Protein Market followed by the Asia-Pacific and Europe regions.
Plant-based Protein North America Market
North America holds a dominant position in the Plant-based Protein Market. North America is one of the largest markets for plant-based proteins, with the United States and Canada leading the way. The region is home to several prominent plant-based protein companies, including Beyond Meat, Impossible Foods, and Oatly. High health awareness, environmental concerns, and a strong vegan and vegetarian culture drive demand. There is a significant market for meat substitutes, dairy alternatives, and protein powders. Wide availability of plant-based products in major retailers, supermarkets, and foodservice establishments.
Plant-based Protein Asia-Pacific Market
The Asia-Pacific region has indeed emerged as the fastest-growing market for the Plant-based Protein Market industry. China, Japan, India, and Australia are leading markets in the Asia-Pacific region. The market is expanding rapidly due to increasing urbanization, disposable incomes, and health awareness. Traditional plant-based diets in countries like India and Japan support market growth. Rising health concerns and the influence of Western dietary habits contribute to increasing demand. Growth of local brands alongside the entry of international companies. Companies like Nestlé and Impossible Foods are expanding their presence in the region.
Competitive Landscape
The global Plant-based Protein Market is highly competitive, with numerous players offering a wide range of software solutions. The competitive landscape is characterized by the presence of established companies, as well as emerging startups and niche players. To increase their market position and attract a wide consumer base, the businesses are employing various strategies, such as product launches, and strategic alliances.
Prominent Players:
- DuPont
- Kerry Group
- Ingredion
- Emsland Group
- AGRANA
- Avebe
- Kroner
- Batory Foods
- AGT Foods
- Aminola
Key Development
In July 2021, Israel-based ChickP Ltd. Declared that its protein isolates can work as 1:1 plant-based substitutes for egg yolk in mayonnaise and salad dressings.
In February 2022, ADM, a global supplier of nutrition that powers many of the world’s top health and wellness and food & beverages brands, released its alternative protein outlook.
Scope of the Report
Global Plant-based Protein Market, by Type
- Concentrates
- Isolates
- Others
Global Plant-based Protein Market, by Livestock
- Pets
- Swine
- Ruminants
- Others
Global Plant-based Protein Market, by Source
- Soy
- Wheat
- Pea
- Others
Global Plant-based Protein Market, by Region
- North America
- US
- Canada
- Mexico
- Europe
- UK
- Germany
- France
- Italy
- Spain
- Benelux
- Nordic
- Rest of Europe
- Asia Pacific
- China
- Japan
- South Korea
- Indonesia
- Austalia
- Malaysia
- India
- Rest of Asia Pacific
- South America
- Brazil
- Argentina
- Rest of South America
- Middle East & Africa
- Saudi Arabia
- UAE
- Egypt
- South Africa
- Rest of Middle East & Africa
| Parameters | Indicators |
|---|---|
| Market Size | 2033: $35.66 Billion |
| CAGR | 8.74% CAGR (2023-2033) |
| Base year | 2022 |
| Forecast Period | 2023-2033 |
| Historical Data | 2021 |
| Report Coverage | Revenue Forecast, Competitive Landscape, Growth Factors, and Trends |
| Key Segmentations | Type, Livestock, Source |
| Geographies Covered | North America, Europe, Asia-Pacific, Latin America, Middle East, Africa |
| Key Vendors | DuPont, Kerry Group, Ingredion, Emsland Group, AGRANA, Avebe, Kroner, Batory Foods, AGT Foods and Aminola. |
| Key Market Opportunities | • Technological Advancements • Sustainable Sourcing |
| Key Market Drivers | • Health and Wellness Trends • Changing Consumer Preferences |
REPORT CONTENT BRIEF:
- High-level analysis of the current and future Plant-based Protein Market trends and opportunities
- Detailed analysis of current market drivers, restraining factors, and opportunities in the future
- Plant-based Protein Market historical market size for the year 2021, and forecast from 2023 to 2033
- Plant-based Protein Market share analysis at each product level
- Competitor analysis with detailed insight into its product segment, Government & Defense strength, and strategies adopted.
- Identifies key strategies adopted including product launches and developments, mergers and acquisitions, joint ventures, collaborations, and partnerships as well as funding taken and investment done, among others.
- To identify and understand the various factors involved in the global Plant-based Protein Market affected by the pandemic
- To provide a detailed insight into the major companies operating in the market. The profiling will include the Government & Defense health of the company’s past 2-3 years with segmental and regional revenue breakup, product offering, recent developments, SWOT analysis, and key strategies.
Press Release

Global Pharmaceutical Manufacturing Market to Reach $1.38 Trillion by 2035 with 7.35% CAGR, New Research Shows

The Global Mammography Market Is Estimated To Record a CAGR of Around 10.29% During The Forecast Period

Glue Stick Market to Reach USD 2.35 Billion by 2034

Podiatry Service Market to Reach USD 11.88 Billion by 2034

Microfluidics Technology Market to Reach USD 32.58 Billion by 2034

Ferric Chloride Market to Reach USD 10.65 Billion by 2034

Family Practice EMR Software Market to Reach USD 21.52 Billion by 2034

Electric Hairbrush Market to Reach USD 15.95 Billion by 2034

Daily Bamboo Products Market to Reach USD 143.52 Billion by 2034

Cross-border E-commerce Logistics Market to Reach USD 112.65 Billion by 2034
Frequently Asked Questions (FAQ)
What is the study period of the Plant-based Protein Market?
The study period for the Plant-based Protein Market spans from 2023 to 2033.
What is the growth rate of the Plant-based Protein Market?
The Plant-based Protein Market is expected to grow at a compound annual growth rate (CAGR) of 8.74% from 2023 to 2033.
Which region has the highest growth rate in the Plant-based Protein Market?
The Asia-Pacific region has the highest growth rate in the Plant-based Protein Market.
Which region has the largest share of the Plant-based Protein Market?
North America holds the largest share of the Plant-based Protein Market.
Who are the key players in the Plant-based Protein Market?
Key players in the Plant-based Protein Market include DuPont, Kerry Group, Ingredion, Emsland Group, and AGRANA.
Do you offer Post sales support?
Yes, we offer 16 hours of analyst support to solve the queries
Do you sell particular sections of a report?
Yes, we provide regional as well as country-level reports. Other than this we also provide a sectional report. Please get in contact with our sales representatives.
Table of Content
CHAPTER 1. Executive Summary CHAPTER 2. Scope of the Study 2.1. Market Definition 2.2. Market Scope & Segmentation 2.2.1. Objective of Report CHAPTER 3. Evolve BI Methodology 3.1. Data Collection & Validation Approach 3.2. Market Size Estimation and Forecast CHAPTER 4. Exclusive Analysis 4.1. Market Opportunity Score 4.1.1. Type Segement – Market Opportunity Score 4.1.2. Livestock Segment – Market Opportunity Score 4.1.3. Source Segment – Market Opportunity Score 4.2. Key Market Influencing Indicators CHAPTER 5. Market Insights and Trends 5.1. Value Chain Analysis 5.1.1. Raw Material 5.1.2. Manufacturing Process 5.1.3. Distribution Channel 5.1.4. End User 5.2. Porter’s Five Forces Analysis 5.2.1. Bargaining Power of Buyers 5.2.2. Bargaining Power of Suppliers 5.2.3. Threat of New Entrant 5.2.4. Threat of Substitute 5.2.5. Industry Rivalry 5.3. COVID-19 Impact and Post COVID Scenario on Plant-based Protein Market 5.3.1. Impact of COVID-19 5.3.2. Government Support and Industry Revival Policies 5.3.3. Measures Taken by Companies to Mitigate Negative Impact 5.3.4. Post COVID Trend CHAPTER 6. MArket Dynamics 6.1. Introduction 6.2. Drivers 6.2.1. Driver 1 6.2.2. Driver 2 6.2.3. Driver 3 6.3. Restraints 6.3.1. Restraint 1 6.3.2. Restraint 2 6.4. Opportunity 6.4.1. Opportunity 1 CHAPTER 7. Plant-based Protein Market, By Type 7.1. Introduction 7.1.1. Concentrates 7.1.2. Isolates 7.1.3 Others CHAPTER 8. Plant-based Protein Market, By Livestock 8.1. Introduction 8.1.1. Pets 8.1.2. Swine 8.1.3 Ruminants 8.1.4 Others CHAPTER 9. Plant-based Protein Market, By Source 9.1. Introduction 9.1.1. Soy 9.1.2 Wheat 9.1.3 Pea 9.1.4 Others CHAPTER 10. Plant-based Protein Market, By Region 10.1. Introduction 10.2. NORTH AMERICA 10.2.1. North America: Market Size and Forecast, By Country, 2023 – 2033 ($ Million) 10.2.2. North America: Market Size and Forecast, By Type, 2023 – 2033 ($ Million) 10.2.3. North America: Market Size and Forecast, By Livestock, 2023 – 2033 ($ Million) 10.2.4. North America: Market Size and Forecast, By Source, 2023 – 2033 ($ Million) 10.2.5. US 10.2.5.1. US: Market Size and Forecast, By Type, 2023 – 2033 ($ Million) 10.2.5.2. US: Market Size and Forecast, By Livestock, 2023 – 2033 ($ Million) 10.2.5.3. US: Market Size and Forecast, By Source, 2023 – 2033 ($ Million) 10.2.6. CANADA 10.2.6.1. Canada: Market Size and Forecast, By Type, 2023 – 2033 ($ Million) 10.2.6.2. Canada: Market Size and Forecast, By Livestock, 2023 – 2033 ($ Million) 10.2.6.3. Canada: Market Size and Forecast, By Source, 2023 – 2033 ($ Million) 10.2.7. MEXICO 10.2.7.1. Mexico: Market Size and Forecast, By Type, 2023 – 2033 ($ Million) 10.2.7.2. Mexico: Market Size and Forecast, By Livestock, 2023 – 2033 ($ Million) 10.2.7.3. Mexico: Market Size and Forecast, By Source, 2023 – 2033 ($ Million) 10.3. Europe 10.3.1. Europe: Market Size and Forecast, By Country, 2023 – 2033 ($ Million) 10.3.2. Europe: Market Size and Forecast, By Type, 2023 – 2033 ($ Million) 10.3.3. Europe: Market Size and Forecast, By Livestock, 2023 – 2033 ($ Million) 10.3.4. Europe: Market Size and Forecast, By Source, 2023 – 2033 ($ Million) 10.3.5. U.K. 10.3.5.1. U.K.: Market Size and Forecast, By Type, 2023 – 2033 ($ Million) 10.3.5.2. U.K.: Market Size and Forecast, By Livestock, 2023 – 2033 ($ Million) 10.3.5.3. U.K.: Market Size and Forecast, By Source, 2023 – 2033 ($ Million) 10.3.6. GERMANY 10.3.6.1. Germany: Market Size and Forecast, By Type, 2023 – 2033 ($ Million) 10.3.6.2. Germany: Market Size and Forecast, By Livestock, 2023 – 2033 ($ Million) 10.3.6.3. Germany: Market Size and Forecast, By Source, 2023 – 2033 ($ Million) 10.3.7. FRANCE 10.3.7.1. France: Market Size and Forecast, By Type, 2023 – 2033 ($ Million) 10.3.7.2. France: Market Size and Forecast, By Livestock, 2023 – 2033 ($ Million) 10.3.7.3. France: Market Size and Forecast, By Source, 2023 – 2033 ($ Million) 10.3.8. ITALY 10.3.8.1. Italy: Market Size and Forecast, By Type, 2023 – 2033 ($ Million) 10.3.8.2. Italy: Market Size and Forecast, By Livestock, 2023 – 2033 ($ Million) 10.3.8.3. Italy: Market Size and Forecast, By Source, 2023 – 2033 ($ Million) 10.3.9. SPAIN 10.3.9.1. Spain: Market Size and Forecast, By Type, 2023 – 2033 ($ Million) 10.3.9.2. Spain: Market Size and Forecast, By Livestock, 2023 – 2033 ($ Million) 10.3.9.3. Spain: Market Size and Forecast, By Source, 2023 – 2033 ($ Million) 10.3.10. BENELUX 10.3.10.1. BeNeLux: Market Size and Forecast, By Type, 2023 – 2033 ($ Million) 10.3.10.2. BeNeLux: Market Size and Forecast, By Livestock, 2023 – 2033 ($ Million) 10.3.10.3. BeNeLux: Market Size and Forecast, By Source, 2023 – 2033 ($ Million) 10.3.11. RUSSIA 10.3.11.1. Russia: Market Size and Forecast, By Type, 2023 – 2033 ($ Million) 10.3.11.2. Russia: Market Size and Forecast, By Livestock, 2023 – 2033 ($ Million) 10.3.11.3. Russia: Market Size and Forecast, By Source, 2023 – 2033 ($ Million) 10.3.12. REST OF EUROPE 10.3.12.1. Rest of Europe: Market Size and Forecast, By Type, 2023 – 2033 ($ Million) 10.3.12.2. Rest of Europe: Market Size and Forecast, By Livestock, 2023 – 2033 ($ Million) 10.3.12.3. Rest of Europe: Market Size and Forecast, By Source, 2023 – 2033 ($ Million) 10.4. Asia Pacific 10.4.1. Asia Pacific: Market Size and Forecast, By Country, 2023 – 2033 ($ Million) 10.4.2. Asia Pacific: Market Size and Forecast, By Type, 2023 – 2033 ($ Million) 10.4.3. Asia Pacific: Market Size and Forecast, By Livestock, 2023 – 2033 ($ Million) 10.4.4. Asia Pacific: Market Size and Forecast, By Source, 2023 – 2033 ($ Million) 10.4.5. CHINA 10.4.5.1. China: Market Size and Forecast, By Type, 2023 – 2033 ($ Million) 10.4.5.2. China: Market Size and Forecast, By Livestock, 2023 – 2033 ($ Million) 10.4.5.3. China: Market Size and Forecast, By Source, 2023 – 2033 ($ Million) 10.4.6. JAPAN 10.4.6.1. Japan: Market Size and Forecast, By Type, 2023 – 2033 ($ Million) 10.4.6.2. Japan: Market Size and Forecast, By Livestock, 2023 – 2033 ($ Million) 10.4.6.3. Japan: Market Size and Forecast, By Source, 2023 – 2033 ($ Million) 10.4.7. INDIA 10.4.7.1. India: Market Size and Forecast, By Type, 2023 – 2033 ($ Million) 10.4.7.2. India: Market Size and Forecast, By Livestock, 2023 – 2033 ($ Million) 10.4.7.3. India: Market Size and Forecast, By Source, 2023 – 2033 ($ Million) 10.4.8. SOUTH KOREA 10.4.8.1. South Korea: Market Size and Forecast, By Type, 2023 – 2033 ($ Million) 10.4.8.2. South Korea: Market Size and Forecast, By Livestock, 2023 – 2033 ($ Million) 10.4.8.3. South Korea: Market Size and Forecast, By Source, 2023 – 2033 ($ Million) 10.4.9. THAILAND 10.4.9.1. Thailand: Market Size and Forecast, By Type, 2023 – 2033 ($ Million) 10.4.9.2. Thailand: Market Size and Forecast, By Livestock, 2023 – 2033 ($ Million) 10.4.9.3. Thailand: Market Size and Forecast, By Source, 2023 – 2033 ($ Million) 10.4.10. INDONESIA 10.4.10.1. Indonesia: Market Size and Forecast, By Type, 2023 – 2033 ($ Million) 10.4.10.2. Indonesia: Market Size and Forecast, By Livestock, 2023 – 2033 ($ Million) 10.4.10.3. Indonesia: Market Size and Forecast, By Source, 2023 – 2033 ($ Million) 10.4.11. MALAYSIA 10.4.11.1. Malaysia: Market Size and Forecast, By Type, 2023 – 2033 ($ Million) 10.4.11.2. Malaysia: Market Size and Forecast, By Livestock, 2023 – 2033 ($ Million) 10.4.11.3. Malaysia: Market Size and Forecast, By Source, 2023 – 2033 ($ Million) 10.4.12. AUSTRALIA 10.4.12.1. Australia: Market Size and Forecast, By Type, 2023 – 2033 ($ Million) 10.4.12.2. Australia: Market Size and Forecast, By Livestock, 2023 – 2033 ($ Million) 10.4.12.3. Australia: Market Size and Forecast, By Source, 2023 – 2033 ($ Million) 10.4.13. REST FO ASIA PACIFIC 10.4.13.1. Rest fo Asia Pacific: Market Size and Forecast, By Type, 2023 – 2033 ($ Million) 10.4.13.2. Rest fo Asia Pacific: Market Size and Forecast, By Livestock, 2023 – 2033 ($ Million) 10.4.13.3. Rest fo Asia Pacific: Market Size and Forecast, By Source, 2023 – 2033 ($ Million) 10.5. South America 10.5.1. South America: Market Size and Forecast, By Country, 2023 – 2033 ($ Million) 10.5.2. South America: Market Size and Forecast, By Type, 2023 – 2033 ($ Million) 10.5.3. South America: Market Size and Forecast, By Livestock, 2023 – 2033 ($ Million) 10.5.4. South America: Market Size and Forecast, By Source, 2023 – 2033 ($ Million) 10.5.5. BRAZIL 10.5.5.1. Brazil: Market Size and Forecast, By Type, 2023 – 2033 ($ Million) 10.5.5.2. Brazil: Market Size and Forecast, By Livestock, 2023 – 2033 ($ Million) 10.5.5.3. Brazil: Market Size and Forecast, By Source, 2023 – 2033 ($ Million) 10.5.6. ARGENTINA 10.5.6.1. Argentina: Market Size and Forecast, By Type, 2023 – 2033 ($ Million) 10.5.6.2. Argentina: Market Size and Forecast, By Livestock, 2023 – 2033 ($ Million) 10.5.6.3. Argentina: Market Size and Forecast, By Source, 2023 – 2033 ($ Million) 10.5.7. REST OF SOUTH AMERICA 10.5.7.1. Rest of South America: Market Size and Forecast, By Type, 2023 – 2033 ($ Million) 10.5.7.2. Rest of South America: Market Size and Forecast, By Livestock, 2023 – 2033 ($ Million) 10.5.7.3. Rest of South America: Market Size and Forecast, By Source, 2023 – 2033 ($ Million) 10.6. Middle East & Africa 10.6.1. Middle East & Africa: Market Size and Forecast, By Country, 2023 – 2033 ($ Million) 10.6.2. Middle East & Africa: Market Size and Forecast, By Type, 2023 – 2033 ($ Million) 10.6.3. Middle East & Africa: Market Size and Forecast, By Livestock, 2023 – 2033 ($ Million) 10.6.4. Middle East & Africa: Market Size and Forecast, By Source, 2023 – 2033 ($ Million) 10.6.5. SAUDI ARABIA 10.6.5.1. Saudi Arabia: Market Size and Forecast, By Type, 2023 – 2033 ($ Million) 10.6.5.2. Saudi Arabia: Market Size and Forecast, By Livestock, 2023 – 2033 ($ Million) 10.6.5.3. Saudi Arabia: Market Size and Forecast, By Source, 2023 – 2033 ($ Million) 10.6.6. UAE 10.6.6.1. UAE: Market Size and Forecast, By Type, 2023 – 2033 ($ Million) 10.6.6.2. UAE: Market Size and Forecast, By Livestock, 2023 – 2033 ($ Million) 10.6.6.3. UAE: Market Size and Forecast, By Source, 2023 – 2033 ($ Million) 10.6.7. EGYPT 10.6.7.1. Egypt: Market Size and Forecast, By Type, 2023 – 2033 ($ Million) 10.6.7.2. Egypt: Market Size and Forecast, By Livestock, 2023 – 2033 ($ Million) 10.6.7.3. Egypt: Market Size and Forecast, By Source, 2023 – 2033 ($ Million) 10.6.8. SOUTH AFRICA 10.6.8.1. South Africa: Market Size and Forecast, By Type, 2023 – 2033 ($ Million) 10.6.8.2. South Africa: Market Size and Forecast, By Livestock, 2023 – 2033 ($ Million) 10.6.8.3. South Africa: Market Size and Forecast, By Source, 2023 – 2033 ($ Million) 10.6.9. REST OF MIDDLE EAST & AFRICA 10.6.9.1. Rest of Middle East & Africa: Market Size and Forecast, By Type, 2023 – 2033 ($ Million) 10.6.9.2. Rest of Middle East & Africa: Market Size and Forecast, By Livestock, 2023 – 2033 ($ Million) 10.6.9.3. Rest of Middle East & Africa: Market Size and Forecast, By Source, 2023 – 2033 ($ Million) CHAPTER 12. Competitive Landscape 12.1. Competitior Benchmarking 2023 12.2. Market Share Analysis 12.3. Key Developments Analysis By Top 5 Companies 12.4. Market Share Acquisition Strategies: Analysis of Key Approaches Employed by Top Players CHAPTER 13. Company Profiles 13.1. DuPont 13.1.1. Hanon Systems 13.1.2. Financial Analysis 13.1.2.1. Business Segment Revenue, 2020, 2021, 2022, $ Million 13.1.2.2. Geographic Revenue Mix, 2022 (% Share) 13.1.3. Product Portfolio 13.1.4. Recent Development and Strategies Adopted 13.1.5. SWOT Analysis 13.2. Kerry Group 13.3. Ingredion 13.4. Emsland Group 13.5. AGRANA 13.6. Avebe 13.7. Kroner 13.8. Batory Foods 13.9. AGT Foods 13.10. Aminola
Connect to Analyst
Research Methodology


