Mobile Artificial Intelligence (AI) Market Analysis and Global Forecast 2023-2033

$ 1,390.00$ 5,520.00

Mobile Artificial Intelligence (AI) Market Research Report: By Technology Node (20–28nm, 10nm, 7nm, Others), By Component (Hardware, Software, Services), By Application (Smartphones, Cameras, Drones, Automotive, Robotics, AR/ VR, Others), and by Region — Forecast till 2033

Report Published on: June 30, 2023
$ 3,470.00
$ 5,520.00
$ 1,390.00
Description

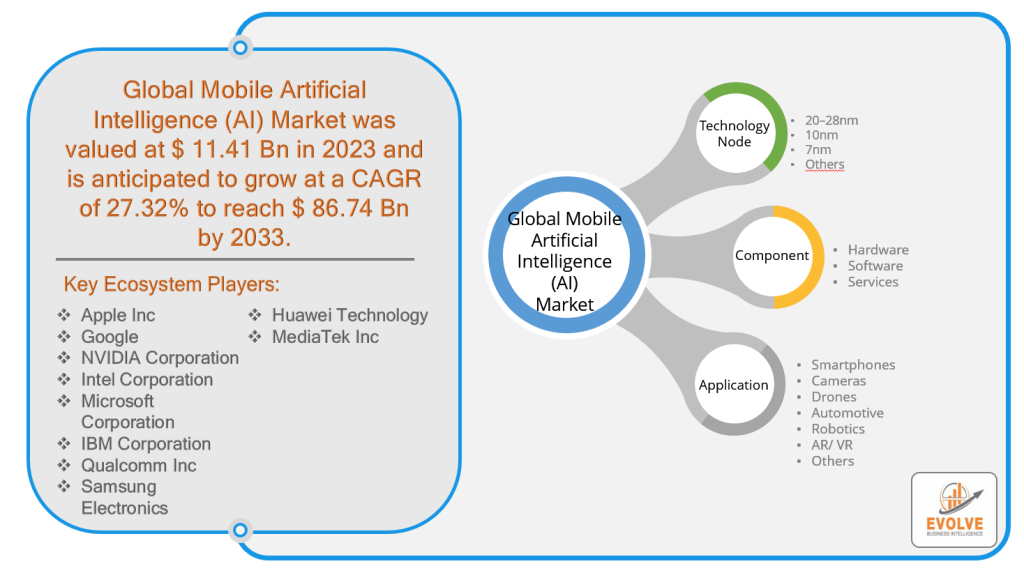
Mobile Artificial Intelligence (AI) Market Size is expected to reach USD 86.74 Billion by 2033. The Mobile Artificial Intelligence (AI) industry size accounted for USD 11.41 Billion in 2023 and is expected to expand at a compound annual growth rate (CAGR) of 27.32% from 2023 to 2033. Mobile Artificial Intelligence (AI) refers to the implementation of AI technologies and algorithms on mobile devices such as smartphones, tablets, and other portable devices. It involves the integration of AI capabilities directly into mobile applications and operating systems, enabling on-device processing and decision-making without relying heavily on cloud-based services. Mobile AI leverages machine learning, natural language processing, computer vision, and other AI techniques to enhance the functionality, intelligence, and efficiency of mobile devices. By leveraging the power of AI locally on mobile devices, tasks such as voice recognition, image recognition, language translation, personal assistants, and predictive analytics can be performed in real-time, offering users personalized and context-aware experiences. Mobile AI enables devices to adapt and learn from user behavior, optimize performance, and deliver intelligent and interactive features, all while operating within the constraints of limited processing power and resources inherent in mobile devices.

Global Mobile Artificial Intelligence (AI) Market Synopsis

COVID-19 Impact Analysis

The COVID-19 pandemic had a significant positive impact on the Mobile Artificial Intelligence (AI) market. With the outbreak of the pandemic, there has been an increased reliance on mobile devices for communication, remote work, and accessing essential services. This surge in mobile usage has accelerated the adoption of Mobile AI as organizations and individuals seek innovative ways to enhance productivity, improve user experiences, and automate tasks. Mobile AI technologies, such as voice assistants, virtual agents, and chatbots, have played a crucial role in providing remote assistance, delivering personalized information, and supporting customer interactions in various sectors like healthcare, e-commerce, and education. Additionally, Mobile AI has been instrumental in enabling contactless interactions, facilitating facial recognition for touchless authentication, and supporting AI-driven surveillance systems for social distancing and crowd management. The pandemic has further highlighted the importance and potential of Mobile AI, driving its growth and shaping the future of mobile technology.

Global Mobile Artificial Intelligence (AI) Market Dynamics

The major factors that have impacted the growth of Mobile Artificial Intelligence (AI) are as follows:

Drivers:

      Increased Mobile Computing Power

Mobile Artificial Intelligence (AI) market is a significant improvement in mobile computing power. Advancements in mobile processor technologies, coupled with higher RAM and storage capacities, enable mobile devices to handle complex AI algorithms and process large amounts of data efficiently. The increased computing power allows for real-time AI applications, such as voice recognition, image processing, and natural language processing, directly on mobile devices, enhancing user experiences and enabling new AI-driven functionalities.

Restraint:

  • Limited Resources and Battery Life

A key restraint in the Mobile AI market is the limited resources and battery life of mobile devices. Implementing resource-intensive AI algorithms on mobile devices can consume significant computational power and drain the device’s battery quickly. This limitation poses challenges in providing continuous AI functionalities without compromising the device’s performance or user experience. Balancing the need for AI capabilities while optimizing resource utilization and managing power consumption remains a constraint in the widespread adoption and scalability of Mobile AI applications.

Opportunity:

⮚      Personalized User Experiences

The Mobile AI market presents an opportunity to deliver personalized user experiences. By leveraging AI algorithms and machine learning models directly on mobile devices, organizations can analyze user behavior, preferences, and contextual data to provide tailored recommendations, content, and services. Mobile AI enables intelligent and proactive interactions, offering users personalized assistance, predictive suggestions, and customized interfaces. This opportunity enhances user engagement, satisfaction, and loyalty, ultimately driving the adoption and growth of AI-powered mobile applications in various sectors, including e-commerce, entertainment, healthcare, and digital assistants.

Mobile Artificial Intelligence (AI) Market Segment Overview

By Technology Node

Based on the Technology Node, the market is segmented based on 20–28nm, 10nm, 7nm, and Others. The largest market share is anticipated to go to the 10nm segment. The adoption of advanced semiconductor fabrication processes, such as 10nm, has been a trend in the mobile industry to enhance the performance, power efficiency, and integration capabilities of mobile AI chips.

By Component

Based on Components, the market has been divided into Hardware, Software, and Services. The Hardware segment is expected to hold the largest market share in the Market. The demand for powerful and efficient hardware solutions with high computing capabilities has increased with the growing adoption of AI on mobile devices. Advancements in semiconductor technology, such as the development of smaller process nodes (10nm, 7nm), have enabled the integration of AI-specific chips into mobile devices, providing enhanced AI performance while minimizing power consumption.

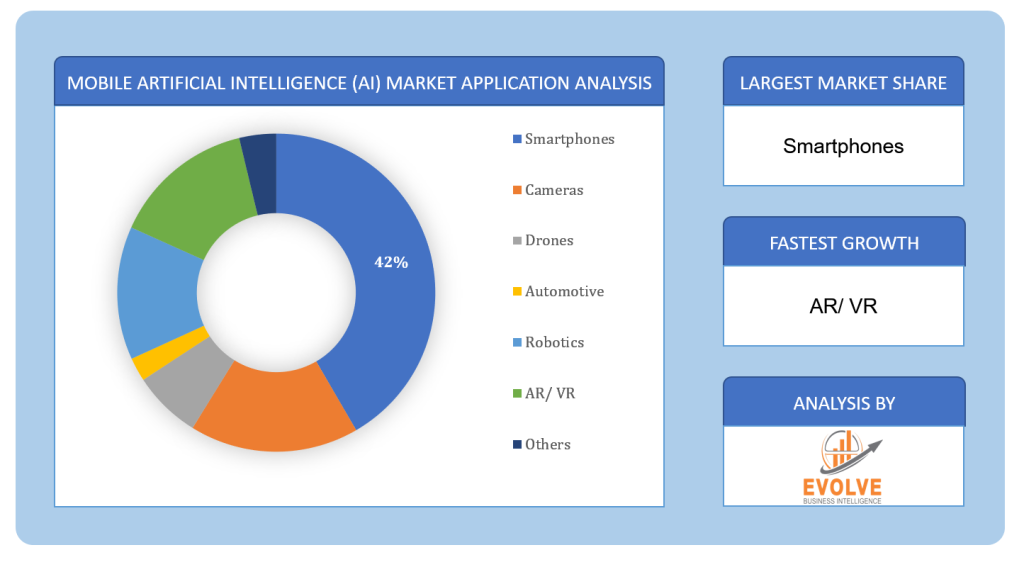
By Application

Based on Application, the market has been divided into Smartphones, Cameras, Drones, Automotive, Robotics, AR/ VR, and Others. The market is projected to see significant growth in the Smartphone segment. smartphones have become an integral part of people’s lives, serving as the primary device for communication, entertainment, and accessing various digital services. The increasing demand for smartphones, coupled with the rising adoption of AI technologies, fuels the growth of AI-enabled smartphones. These devices incorporate AI capabilities directly into the hardware and software, enabling advanced features such as voice assistants, image recognition, and augmented reality experiences.

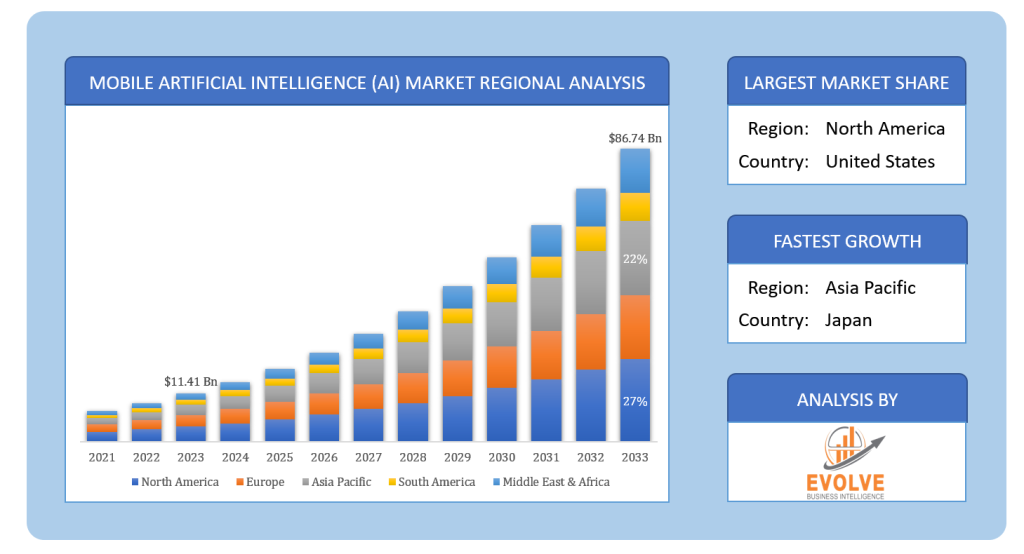
Global Mobile Artificial Intelligence (AI) Market Regional Analysis

Based on region, the market has been divided into North America, Europe, Asia-Pacific, the Middle East & Africa, and Latin America. The area of North America is anticipated to dominate the market for the usage of Mobile Artificial Intelligence (AI), followed by those in Asia-Pacific and Europe.

North America Market

North America leads the highest market share in the Mobile Artificial Intelligence (AI) market. North America is home to several prominent technology companies and research institutions at the forefront of AI advancements. This region has a robust ecosystem for innovation, investment, and development of AI technologies, including mobile AI applications. Additionally, North America has a high adoption rate of smartphones and mobile devices, creating a large user base for mobile AI applications. The region’s strong infrastructure and advanced telecommunications networks also support the seamless integration and efficient operation of AI technologies on mobile devices. Moreover, North American businesses across various industries, such as healthcare, finance, retail, and entertainment, are actively leveraging mobile AI to enhance customer experiences, optimize operations, and gain a competitive edge.

Asia Pacific Market

The Asia-Pacific region had been witnessing a growing CAGR in the Mobile Artificial Intelligence (AI) industry. The region is home to a large population, including a significant number of tech-savvy individuals who are early adopters of mobile technologies. The increasing smartphone penetration and internet connectivity in countries such as China, India, South Korea, and Japan have created a substantial user base for mobile AI applications. Additionally, the Asia-Pacific region has a thriving startup ecosystem, with many innovative companies focusing on AI development and mobile technologies. The availability of skilled talent, government initiatives supporting AI research and development, and favorable investment environments have further fueled the growth of the Mobile AI industry in the region. Furthermore, the increasing digitalization of industries such as e-commerce, healthcare, and finance in the Asia-Pacific region has created opportunities for mobile AI applications, driving the demand for AI-powered mobile solutions.

Competitive Landscape

The competitive landscape includes key players (tier 1, tier 2, and local) having a presence across the globe. Companies such as Intel Corporation, Microsoft Corporation, IBM Corporation, Qualcomm Inc, and Apple inc are some of the leading players in the global Mobile Artificial Intelligence (AI) Industry. These players have adopted partnership, acquisition, expansion, and new product development, among others as their key strategies.

Key Market Players:

  • Apple Inc
  • Google
  • NVIDIA Corporation
  • Intel Corporation
  • Microsoft Corporation
  • IBM Corporation
  • Qualcomm Inc
  • Samsung Electronics
  • Huawei Technology
  • MediaTek Inc

Key Development:

In 2021, Google has been focusing on enhancing its mobile AI capabilities with the development and improvement of its AI-powered virtual assistant, Google Assistant. The company has been investing in natural language processing, machine learning, and voice recognition technologies to provide more personalized and intuitive experiences on mobile devices.

In 2021, Apple has been emphasizing the integration of AI technologies into its mobile devices, particularly with its Neural Engine and Core ML frameworks. These frameworks enable developers to implement AI models directly on Apple devices, enhancing on-device processing and privacy while providing users with powerful AI-driven features and functionalities.

Scope of the Report

Global Mobile Artificial Intelligence (AI) Market, by Technology Node

  • 20–28nm
  • 10nm
  • 7nm
  • Others

Global Mobile Artificial Intelligence (AI) Market, by Component

  • Hardware
  • Software
  • Services

Global Mobile Artificial Intelligence (AI) Market, by Application

  • Smartphones
  • Cameras
  • Drones
  • Automotive
  • Robotics
  • AR/ VR
  • Others

Global Mobile Artificial Intelligence (AI) Market, by Region

  • North America
    • US
    • Canada
    • Mexico
  • Europe
    • UK
    • Germany
    • France
    • Italy
    • Spain
    • Benelux
    • Nordic
    • Rest of Europe
  • Asia Pacific
    • China
    • Japan
    • South Korea
    • Indonesia
    • Austalia
    • Malaysia
    • India
    • Rest of Asia Pacific
  • South America
    • Brazil
    • Argentina
    • Rest of South America
  • Middle East & Africa
    • Saudi Arabia
    • UAE
    • Egypt
    • South Africa
    • Rest of Middle East & Africa


Parameters Indicators
Market Size 2033: $86.74 Billion
CAGR 27.32% CAGR (2023-2033)
Base year 2022
Forecast Period 2023-2033
Historical Data 2021
Report Coverage Revenue Forecast, Competitive Landscape, Growth Factors, and Trends
Key Segmentations Technology Node, Component, Application
Geographies Covered North America, Europe, Asia-Pacific, Latin America, Middle East, Africa
Key Vendors Apple Inc, Google, NVIDIA Corporation, Intel Corporation, Microsoft Corporation, IBM Corporation, Qualcomm Inc, Samsung Electronics, Huawei Technology, MediaTek Inc
Key Market Opportunities Development of innovative AI-powered mobile applications and services
Integration of AI algorithms directly on mobile devices for real-time processing
Enhanced user experiences through personalized recommendations and intelligent interactions
Market growth is driven by emerging economies and increasing smartphone penetration
Key Market Drivers Increasing adoption of smartphones and mobile devices
Advancements in mobile computing power and hardware capabilities
Growing demand for personalized and intelligent mobile experiences
Expansion of AI applications in various industries, such as healthcare, e-commerce, and entertainment


REPORT CONTENT BRIEF:

  • High-level analysis of the current and future Mobile Artificial Intelligence (AI) Industry trends and opportunities
  • Detailed analysis of current market drivers, restraining factors, and opportunities analysis in the future
  • Historical market size for the year 2021, and forecast from 2023 to 2033
  • Mobile Artificial Intelligence (AI) market share analysis for each segment
  • Competitor analysis with a comprehensive insight into its product segment, financial strength, and strategies adopted.
  • Identifies key strategies adopted by the key players including new product development, mergers and acquisitions, joint ventures, collaborations, and partnerships.
  • To identify and understand the various factors involved in the global Mobile Artificial Intelligence (AI) market affected by the pandemic
  • To provide year-on-year growth from 2022 to 2033
  • To provide short-term, long-term, and overall CAGR comparison from 2022 to 2033.
  • Provide Total Addressable Market (TAM) for the Global Mobile Artificial Intelligence (AI) Market.

Frequently Asked Questions (FAQ)

For more details mail us at

Ask a question / additional requirement

1. What is the study period of this market?

  • The study period of the global Mobile Artificial Intelligence (AI) market is 2022- 2033

2. What are the 10 Years CAGR (2023 to 2033) of the global Mobile Artificial Intelligence (AI) market?

  • The global Mobile Artificial Intelligence (AI) market is growing at a CAGR of ~32% over the next 10 years

3. Which region has the highest growth rate in the market of Mobile Artificial Intelligence (AI)?

  • Asia Pacific is expected to register the highest CAGR during 2023-2033

4. Which region accounted for the largest share of the market of Mobile Artificial Intelligence (AI)?

  • North America holds the largest share in 2022

5. Major Key Players in the Market of Mobile Artificial Intelligence (AI)?

  • Apple Inc, Google, NVIDIA Corporation, Intel Corporation, Microsoft Corporation, IBM Corporation, Qualcomm Inc, Samsung Electronics, Huawei Technology, and MediaTek Inc are the major companies operating in the Mobile Artificial Intelligence (AI)

6. Do you offer Post Sale Support?

  • Yes, we offer 16 hours of analyst support to solve the queries

7. Do you deliver sections of a report?

Yes, we do provide regional as well as country-level reports. Other than this we also provide a sectional report. Please get in contact with our sales representatives.

Table of Content

Table of Content

CHAPTER 1.                 Executive Summary

CHAPTER 2.                 Scope of the Study

2.1.        Market Definition

2.2.        Market Scope & Segmentation

2.2.1.         Objective of Report

CHAPTER 3.                 Evolve BI Methodology

3.1.        Data Collection & Validation Approach

3.2.        Market Size Estimation and Forecast

CHAPTER 4.                 Exclusive Analysis

4.1.        Market Opportunity Score

4.1.1.         Technology Node Segement – Market Opportunity Score

4.1.2.         Component Segment – Market Opportunity Score

4.1.3.         Application Segment – Market Opportunity Score

4.2.        Key Market Influencing Indicators

CHAPTER 5.                 Market Insights and Trends

5.1.        Value Chain Analysis

5.1.1.         Raw Material

5.1.2.         Manufacturing Process

5.1.3.         Distribution Channel

5.1.4.         End User

5.2.        Porter’s Five Forces Analysis

5.2.1.         Bargaining Power of Buyers

5.2.2.         Bargaining Power of Suppliers

5.2.3.         Threat of New Entrant

5.2.4.         Threat of Substitute

5.2.5.         Industry Rivalry

5.3.        COVID-19 Impact and Post COVID Scenario on Mobile Artificial Intelligence (AI) Market

5.3.1.         Impact of COVID-19

5.3.2.         Government Support and Industry Revival Policies

5.3.3.         Measures Taken by Companies to Mitigate Negative Impact

5.3.4.         Post COVID Trend

CHAPTER 6.                 MArket Dynamics

6.1.        Introduction

6.2.        Drivers

6.2.1.         Driver 1

6.2.2.         Driver 2

6.2.3.         Driver 3

6.3.        Restraints

6.3.1.         Restraint 1

6.3.2.         Restraint 2

6.4.        Opportunity

6.4.1.         Opportunity 1

CHAPTER 7.                 Global Mobile Artificial Intelligence (AI) Market, By Technology Node

7.1.        Introduction

7.1.1.         20–28nm

7.1.2.         10nm

7.1.3.         7nm

7.1.4.         Others

CHAPTER 8.                 Global Mobile Artificial Intelligence (AI) Market, By Component

8.1.        Introduction

8.1.1.         Hardware

8.1.2.         Software

8.1.3.         Services

CHAPTER 9.                 Global Mobile Artificial Intelligence (AI) Market, By Application

9.1.        Introduction

9.1.1.         Smartphones

9.1.2.         Cameras

9.1.3.         Drones

9.1.4.         Automotive

9.1.5.         Robotics

9.1.6.         AR/ VR

9.1.7.         Others

CHAPTER 10.               Global Mobile Artificial Intelligence (AI) Market, By Region

10.1.     Introduction

10.2.     NORTH AMERICA

10.2.1.      North America: Market Size and Forecast, By Country, 2023 – 2033 ($ Million)

10.2.2.      North America: Market Size and Forecast, By Technology Node, 2023 – 2033 ($ Million)

10.2.3.      North America: Market Size and Forecast, By Component, 2023 – 2033 ($ Million)

10.2.4.      North America: Market Size and Forecast, By Application, 2023 – 2033 ($ Million)

10.2.5.      US

10.2.5.1.       US: Market Size and Forecast, By Technology Node, 2023 – 2033 ($ Million)

10.2.5.2.       US: Market Size and Forecast, By Component, 2023 – 2033 ($ Million)

10.2.5.3.       US: Market Size and Forecast, By Application, 2023 – 2033 ($ Million)

10.2.6.      CANADA

10.2.6.1.       Canada: Market Size and Forecast, By Technology Node, 2023 – 2033 ($ Million)

10.2.6.2.       Canada: Market Size and Forecast, By Component, 2023 – 2033 ($ Million)

10.2.6.3.       Canada: Market Size and Forecast, By Application, 2023 – 2033 ($ Million)

10.2.7.      MEXICO

10.2.7.1.       Mexico: Market Size and Forecast, By Technology Node, 2023 – 2033 ($ Million)

10.2.7.2.       Mexico: Market Size and Forecast, By Component, 2023 – 2033 ($ Million)

10.2.7.3.       Mexico: Market Size and Forecast, By Application, 2023 – 2033 ($ Million)

10.3.     Europe

10.3.1.      Europe: Market Size and Forecast, By Country, 2023 – 2033 ($ Million)

10.3.2.      Europe: Market Size and Forecast, By Technology Node, 2023 – 2033 ($ Million)

10.3.3.      Europe: Market Size and Forecast, By Component, 2023 – 2033 ($ Million)

10.3.4.      Europe: Market Size and Forecast, By Application, 2023 – 2033 ($ Million)

10.3.5.      U.K.

10.3.5.1.       U.K.: Market Size and Forecast, By Technology Node, 2023 – 2033 ($ Million)

10.3.5.2.       U.K.: Market Size and Forecast, By Component, 2023 – 2033 ($ Million)

10.3.5.3.       U.K.: Market Size and Forecast, By Application, 2023 – 2033 ($ Million)

10.3.6.      GERMANY

10.3.6.1.       Germany: Market Size and Forecast, By Technology Node, 2023 – 2033 ($ Million)

10.3.6.2.       Germany: Market Size and Forecast, By Component, 2023 – 2033 ($ Million)

10.3.6.3.       Germany: Market Size and Forecast, By Application, 2023 – 2033 ($ Million)

10.3.7.      FRANCE

10.3.7.1.       France: Market Size and Forecast, By Technology Node, 2023 – 2033 ($ Million)

10.3.7.2.       France: Market Size and Forecast, By Component, 2023 – 2033 ($ Million)

10.3.7.3.       France: Market Size and Forecast, By Application, 2023 – 2033 ($ Million)

10.3.8.      ITALY

10.3.8.1.       Italy: Market Size and Forecast, By Technology Node, 2023 – 2033 ($ Million)

10.3.8.2.       Italy: Market Size and Forecast, By Component, 2023 – 2033 ($ Million)

10.3.8.3.       Italy: Market Size and Forecast, By Application, 2023 – 2033 ($ Million)

10.3.9.           SPAIN

10.3.9.1.        Spain: Market Size and Forecast, By Technology Node, 2023 – 2033 ($ Million)

10.3.9.2.        Spain: Market Size and Forecast, By Component, 2023 – 2033 ($ Million)

10.3.9.3.        Spain: Market Size and Forecast, By Application, 2023 – 2033 ($ Million)

10.3.10.         BENELUX

10.3.10.1.     BeNeLux: Market Size and Forecast, By Technology Node, 2023 – 2033 ($ Million)

10.3.10.2.     BeNeLux: Market Size and Forecast, By Component, 2023 – 2033 ($ Million)

10.3.10.3.     BeNeLux: Market Size and Forecast, By Application, 2023 – 2033 ($ Million)

10.3.11.         RUSSIA

10.3.11.1.     Russia: Market Size and Forecast, By Technology Node, 2023 – 2033 ($ Million)

10.3.11.2.     Russia: Market Size and Forecast, By Component, 2023 – 2033 ($ Million)

10.3.11.3.     Russia: Market Size and Forecast, By Application, 2023 – 2033 ($ Million)

10.3.12.         REST OF EUROPE

10.3.12.1.     Rest of Europe: Market Size and Forecast, By Technology Node, 2023 – 2033 ($ Million)

10.3.12.2.     Rest of Europe: Market Size and Forecast, By Component, 2023 – 2033 ($ Million)

10.3.12.3.     Rest of Europe: Market Size and Forecast, By Application, 2023 – 2033 ($ Million)

10.4.     Asia Pacific

10.4.1.      Asia Pacific: Market Size and Forecast, By Country, 2023 – 2033 ($ Million)

10.4.2.      Asia Pacific: Market Size and Forecast, By Technology Node, 2023 – 2033 ($ Million)

10.4.3.      Asia Pacific: Market Size and Forecast, By Component, 2023 – 2033 ($ Million)

10.4.4.      Asia Pacific: Market Size and Forecast, By Application, 2023 – 2033 ($ Million)

10.4.5.      CHINA

10.4.5.1.       China: Market Size and Forecast, By Technology Node, 2023 – 2033 ($ Million)

10.4.5.2.       China: Market Size and Forecast, By Component, 2023 – 2033 ($ Million)

10.4.5.3.       China: Market Size and Forecast, By Application, 2023 – 2033 ($ Million)

10.4.6.      JAPAN

10.4.6.1.       Japan: Market Size and Forecast, By Technology Node, 2023 – 2033 ($ Million)

10.4.6.2.       Japan: Market Size and Forecast, By Component, 2023 – 2033 ($ Million)

10.4.6.3.       Japan: Market Size and Forecast, By Application, 2023 – 2033 ($ Million)

10.4.7.      INDIA

10.4.7.1.       India: Market Size and Forecast, By Technology Node, 2023 – 2033 ($ Million)

10.4.7.2.       India: Market Size and Forecast, By Component, 2023 – 2033 ($ Million)

10.4.7.3.       India: Market Size and Forecast, By Application, 2023 – 2033 ($ Million)

10.4.8.      SOUTH KOREA

10.4.8.1.       South Korea: Market Size and Forecast, By Technology Node, 2023 – 2033 ($ Million)

10.4.8.2.       South Korea: Market Size and Forecast, By Component, 2023 – 2033 ($ Million)

10.4.8.3.       South Korea: Market Size and Forecast, By Application, 2023 – 2033 ($ Million)

10.4.9.           THAILAND

10.4.9.1.        Thailand: Market Size and Forecast, By Technology Node, 2023 – 2033 ($ Million)

10.4.9.2.        Thailand: Market Size and Forecast, By Component, 2023 – 2033 ($ Million)

10.4.9.3.        Thailand: Market Size and Forecast, By Application, 2023 – 2033 ($ Million)

10.4.10.         INDONESIA

10.4.10.1.     Indonesia: Market Size and Forecast, By Technology Node, 2023 – 2033 ($ Million)

10.4.10.2.     Indonesia: Market Size and Forecast, By Component, 2023 – 2033 ($ Million)

10.4.10.3.     Indonesia: Market Size and Forecast, By Application, 2023 – 2033 ($ Million)

10.4.11.         MALAYSIA

10.4.11.1.     Malaysia: Market Size and Forecast, By Technology Node, 2023 – 2033 ($ Million)

10.4.11.2.     Malaysia: Market Size and Forecast, By Component, 2023 – 2033 ($ Million)

10.4.11.3.     Malaysia: Market Size and Forecast, By Application, 2023 – 2033 ($ Million)

10.4.12.         AUSTRALIA

10.4.12.1.     Australia: Market Size and Forecast, By Technology Node, 2023 – 2033 ($ Million)

10.4.12.2.     Australia: Market Size and Forecast, By Component, 2023 – 2033 ($ Million)

10.4.12.3.     Australia: Market Size and Forecast, By Application, 2023 – 2033 ($ Million)

10.4.13.         REST FO ASIA PACIFIC

10.4.13.1.     Rest fo Asia Pacific: Market Size and Forecast, By Technology Node, 2023 – 2033 ($ Million)

10.4.13.2.     Rest fo Asia Pacific: Market Size and Forecast, By Component, 2023 – 2033 ($ Million)

10.4.13.3.     Rest fo Asia Pacific: Market Size and Forecast, By Application, 2023 – 2033 ($ Million)

10.5.     South America

10.5.1.      South America: Market Size and Forecast, By Country, 2023 – 2033 ($ Million)

10.5.2.      South America: Market Size and Forecast, By Technology Node, 2023 – 2033 ($ Million)

10.5.3.      South America: Market Size and Forecast, By Component, 2023 – 2033 ($ Million)

10.5.4.      South America: Market Size and Forecast, By Application, 2023 – 2033 ($ Million)

10.5.5.      BRAZIL

10.5.5.1.       Brazil: Market Size and Forecast, By Technology Node, 2023 – 2033 ($ Million)

10.5.5.2.       Brazil: Market Size and Forecast, By Component, 2023 – 2033 ($ Million)

10.5.5.3.       Brazil: Market Size and Forecast, By Application, 2023 – 2033 ($ Million)

10.5.6.      ARGENTINA

10.5.6.1.       Argentina: Market Size and Forecast, By Technology Node, 2023 – 2033 ($ Million)

10.5.6.2.       Argentina: Market Size and Forecast, By Component, 2023 – 2033 ($ Million)

10.5.6.3.       Argentina: Market Size and Forecast, By Application, 2023 – 2033 ($ Million)

10.5.7.      REST OF SOUTH AMERICA

10.5.7.1.       Rest of South America: Market Size and Forecast, By Technology Node, 2023 – 2033 ($ Million)

10.5.7.2.       Rest of South America: Market Size and Forecast, By Component, 2023 – 2033 ($ Million)

10.5.7.3.       Rest of South America: Market Size and Forecast, By Application, 2023 – 2033 ($ Million)

10.6.     Middle East & Africa

10.6.1.      Middle East & Africa: Market Size and Forecast, By Country, 2023 – 2033 ($ Million)

10.6.2.      Middle East & Africa: Market Size and Forecast, By Technology Node, 2023 – 2033 ($ Million)

10.6.3.      Middle East & Africa: Market Size and Forecast, By Component, 2023 – 2033 ($ Million)

10.6.4.      Middle East & Africa: Market Size and Forecast, By Application, 2023 – 2033 ($ Million)

10.6.5.      SAUDI ARABIA

10.6.5.1.       Saudi Arabia: Market Size and Forecast, By Technology Node, 2023 – 2033 ($ Million)

10.6.5.2.       Saudi Arabia: Market Size and Forecast, By Component, 2023 – 2033 ($ Million)

10.6.5.3.       Saudi Arabia: Market Size and Forecast, By Application, 2023 – 2033 ($ Million)

10.6.6.      UAE

10.6.6.1.       UAE: Market Size and Forecast, By Technology Node, 2023 – 2033 ($ Million)

10.6.6.2.       UAE: Market Size and Forecast, By Component, 2023 – 2033 ($ Million)

10.6.6.3.       UAE: Market Size and Forecast, By Application, 2023 – 2033 ($ Million)

10.6.7.      EGYPT

10.6.7.1.       Egypt: Market Size and Forecast, By Technology Node, 2023 – 2033 ($ Million)

10.6.7.2.       Egypt: Market Size and Forecast, By Component, 2023 – 2033 ($ Million)

10.6.7.3.       Egypt: Market Size and Forecast, By Application, 2023 – 2033 ($ Million)

10.6.8.      SOUTH AFRICA

10.6.8.1.       South Africa: Market Size and Forecast, By Technology Node, 2023 – 2033 ($ Million)

10.6.8.2.       South Africa: Market Size and Forecast, By Component, 2023 – 2033 ($ Million)

10.6.8.3.       South Africa: Market Size and Forecast, By Application, 2023 – 2033 ($ Million)

10.6.9.           REST OF MIDDLE EAST & AFRICA

10.6.9.1.        Rest of Middle East & Africa: Market Size and Forecast, By Technology Node, 2023 – 2033 ($ Million)

10.6.9.2.        Rest of Middle East & Africa: Market Size and Forecast, By Component, 2023 – 2033 ($ Million)

10.6.9.3.        Rest of Middle East & Africa: Market Size and Forecast, By Application, 2023 – 2033 ($ Million)

CHAPTER 12.               Competitive Landscape

12.1.     Competitior Benchmarking 2023

12.2.     Market Share Analysis

12.3.     Key Developments Analysis By Top 5 Companies

12.4.     Market Share Acquisition Strategies: Analysis of Key Approaches Employed by Top Players

CHAPTER 13.               Company Profiles

13.1.     Apple Inc

13.1.1.      Business Overview

13.1.2.      Financial Analysis

13.1.2.1.       Business Segment Revenue, 2020, 2021, 2022, $ Million

13.1.2.2.       Geographic Revenue Mix, 2022 (% Share)

13.1.3.      Product Portfolio

13.1.4.      Recent Development and Strategies Adopted

13.1.5.      SWOT Analysis

13.2.     Apple Inc

13.3.     NVIDIA Corporation

13.4.     Intel Corporation

13.5.     Microsoft Corporation

13.6.     IBM Corporation

13.7.     Qualcomm Inc

13.8.     Samsung Electronics

13.9.     Huawei Technology

13.10.   MediaTek Inctt

Connect to Analyst

Connect to Analyst

Research Methodology

Research Methodology