Insulated Wire and Cable Market Analysis and Global Forecast 2023-2033
$ 1,390.00 – $ 5,520.00
Insulated Wire and Cable Market Research Report: Information By Material (Metal, Plastic, Optical Fiber), By End User (Telecommunication, Electronics, Construction, Others), By Voltage (Low Voltage, Medium Voltage, High Voltage), and by Region — Forecast till 2033
Page: 155
Insulated Wire and Cable Market Overview
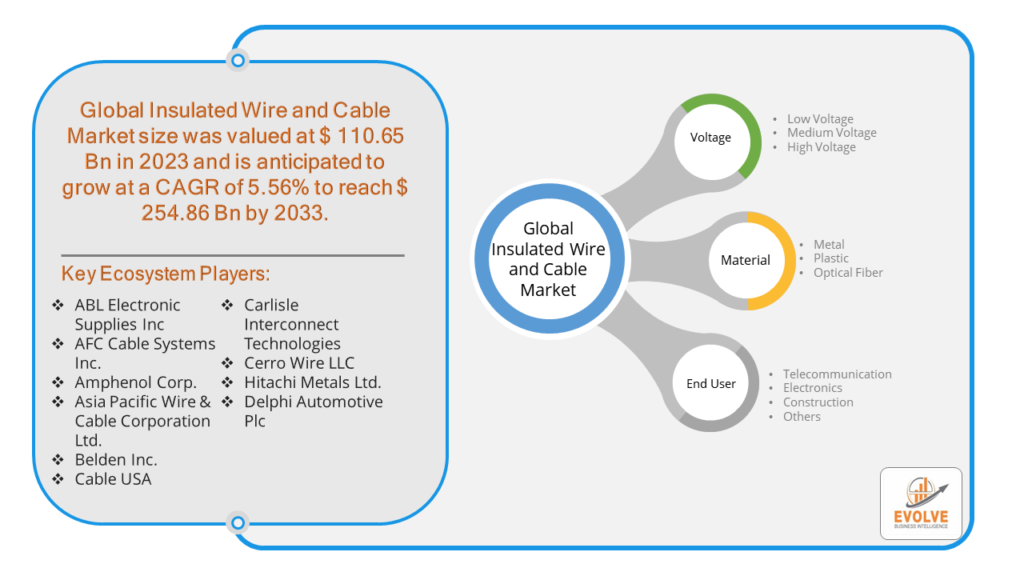
The Insulated Wire and Cable Market Size is expected to reach USD 254.86 Billion by 2033. The Insulated Wire and Cable Market industry size accounted for USD 110.65 Billion in 2023 and is expected to expand at a compound annual growth rate (CAGR) of 5.56% from 2023 to 2033. The Insulated Wire and Cable Market refers to the global market for wires and cables that are insulated to prevent electrical leakage and ensure the safe transmission of electricity. These products are essential for various applications, including power distribution, telecommunications, electronics, and construction. These insulating materials prevent the flow of electricity between the conducting wires and their surroundings, ensuring safety and proper functioning.
Overall, the Insulated Wire and Cable Market is a crucial segment of the electrical and electronics industry, driven by the need for reliable and safe electrical transmission and growing technological advancements.
Global Insulated Wire and Cable Market Synopsis
The COVID-19 pandemic had a significant impact on the Insulated Wire and Cable Market. Lockdowns and restrictions led to temporary shutdowns of manufacturing facilities, causing delays in production. Restrictions on transportation and international trade affected the timely delivery of raw materials and finished products. The pandemic led to a slowdown in construction activities, reducing the demand for insulated wires and cables in the construction sector. With the shift to remote work and online activities, there was an increased demand for telecommunications infrastructure, boosting the need for communication cables. Many companies in the insulated wire and cable market faced revenue declines due to reduced demand and operational challenges. The accelerated digital transformation and increased reliance on digital infrastructure could lead to sustained growth in the demand for communication cables. An increased focus on renewable energy and sustainable practices may drive demand for specialized cables in the energy sector.
Insulated Wire and Cable Market Dynamics
The major factors that have impacted the growth of Insulated Wire and Cable Market are as follows:
Drivers:
Ø Technological Advancements
Advancements in insulation materials, such as cross-linked polyethylene (XLPE) and ethylene propylene rubber (EPR), enhance the performance and durability of cables. The development of smart grids and the integration of the Internet of Things (IoT) in power distribution systems require advanced insulated cables for efficient data and power transmission. The growing need for high-speed internet, data transfer, and telecommunication services drives the demand for insulated communication cables, including fiber optic cables. The rollout of 5G networks increases the demand for advanced cabling solutions to support higher data rates and connectivity.
Restraint:
- Perception of Raw Material Price Volatility
The prices of raw materials like copper, aluminum, and insulation materials can be highly volatile. Price fluctuations can lead to increased production costs and affect profit margins for manufacturers. Disruptions in the supply chain for these raw materials, due to geopolitical issues, natural disasters, or other factors, can impact the availability and cost of materials. The presence of numerous players in the market leads to intense competition, which can result in pricing pressures and reduced profit margins. In some segments, wires and cables are considered commodity products, making it difficult for manufacturers to differentiate their offerings and command premium prices.
Opportunity:
⮚ Renewable Energy Integration
The increasing adoption of solar, wind, and other renewable energy sources creates opportunities for specialized cables for energy transmission and distribution. Upgrading and modernizing power grids with smart grid technologies and energy storage systems require advanced cables to enhance efficiency and reliability. Increasing focus on energy efficiency and reducing transmission losses drives demand for high-efficiency cables and insulation materials. Demand for cables compliant with green building certifications and sustainable construction practices presents growth opportunities.
Insulated Wire and Cable Market Segment Overview
By Voltage
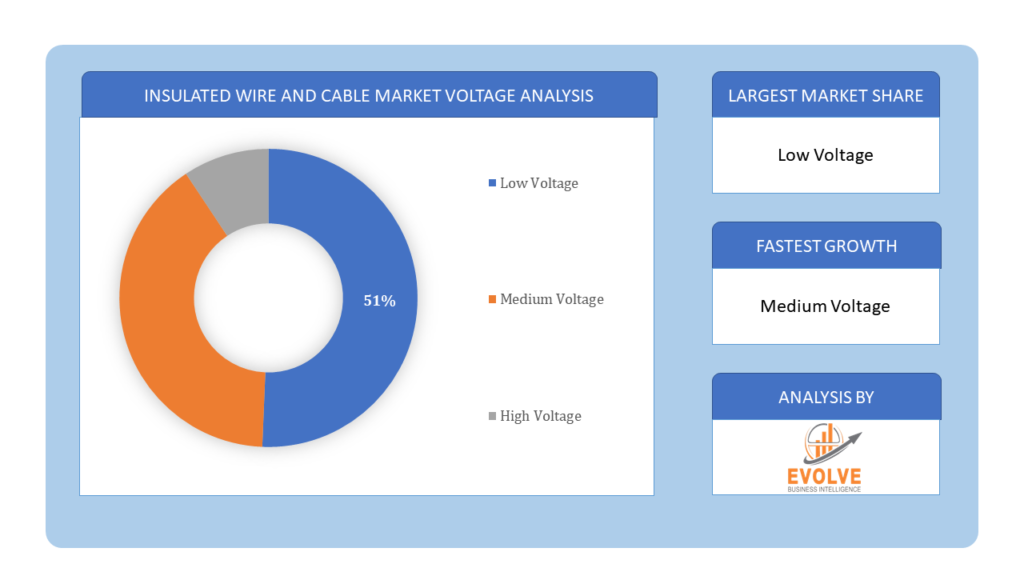
Based on Voltage, the market is segmented based on Low Voltage, Medium Voltage and High Voltage. The low voltage segment dominant the market. This is because, low-voltage cables consist of flexible, bare, or tin-plated copper conductors in addition to rigid, solid, or stranded copper and aluminum conductors. Furthermore, this low-voltage segment is utilized in numerous applications such as smart grids, building cables, distribution networks, and other appliances.
By Material
Based on Material, the market segment has been divided into the Metal, Plastic and Optical Fiber. The metal segment dominant the market. This is because, metal-insulated wire is widely utilized in a variety of household products and to transfer electricity throughout residential, commercial, and industrial structures. Therefore, a metal segment of the global insulated wire and cable market will develop as a result of the world’s rapid building of homes, offices, and other commercial spaces.
By End User
Based on End User, the market segment has been divided into the Telecommunication, Electronics, Construction and Others. The telecommunication segment dominant the market. This is due to cables are necessary for sending voice and data information over long distances, which makes the telecommunication segment the fastest growing in the global insulated wire and cable market.
Global Insulated Wire and Cable Market Regional Analysis
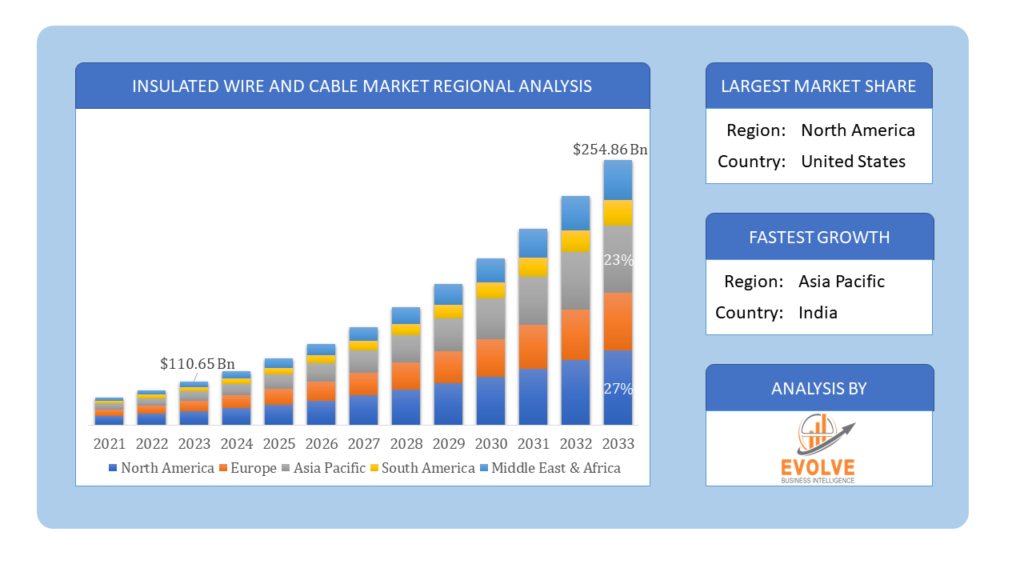
Based on region, the global Insulated Wire and Cable Market has been divided into North America, Europe, Asia-Pacific, the Middle East & Africa, and Latin America. North America is projected to dominate the use of the Insulated Wire and Cable Market followed by the Asia-Pacific and Europe regions.
Insulated Wire and Cable North America Market
North America holds a dominant position in the Insulated Wire and Cable Market. Mature market with a strong emphasis on technological innovation and regulatory compliance. Demand driven by infrastructure upgrades, telecommunications expansion, and renewable energy projects. Growth in smart grid investments, 5G rollout, and electric vehicle infrastructure.
Insulated Wire and Cable Asia-Pacific Market
The Asia-Pacific region has indeed emerged as the fastest-growing market for the Insulated Wire and Cable Market industry. Fast-growing market driven by rapid urbanization and industrialization. Infrastructure development, urban expansion, and increasing consumer electronics demand. Growing renewable energy projects, 5G infrastructure deployment, and expanding automotive sector.
Competitive Landscape
The global Insulated Wire and Cable Market is highly competitive, with numerous players offering a wide range of software solutions. The competitive landscape is characterized by the presence of established companies, as well as emerging startups and niche players. To increase their market position and attract a wide consumer base, the businesses are employing various strategies, such as product launches, and strategic alliances.
Prominent Players:
- ABL Electronic Supplies Inc
- AFC Cable Systems Inc.
- Amphenol Corp.
- Asia Pacific Wire & Cable Corporation Ltd.
- Belden Inc.
- Cable USA
- Carlisle Interconnect Technologies
- Cerro Wire LLC
- Hitachi Metals Ltd.
- Delphi Automotive Plc
Scope of the Report
Global Insulated Wire and Cable Market, by Voltage
- Low Voltage
- Medium Voltage
- High Voltage
Global Insulated Wire and Cable Market, by Material
- Metal
- Plastic
- Optical Fiber
Global Insulated Wire and Cable Market, by End User
- Telecommunication
- Electronics
- Construction
- Others
Global Insulated Wire and Cable Market, by Region
- North America
- US
- Canada
- Mexico
- Europe
- UK
- Germany
- France
- Italy
- Spain
- Benelux
- Nordic
- Rest of Europe
- Asia Pacific
- China
- Japan
- South Korea
- Indonesia
- Austalia
- Malaysia
- India
- Rest of Asia Pacific
- South America
- Brazil
- Argentina
- Rest of South America
- Middle East & Africa
- Saudi Arabia
- UAE
- Egypt
- South Africa
- Rest of Middle East & Africa
Parameters | Indicators |
---|---|
Market Size | 2033: $254.86 Billion/strong> |
CAGR | 5.56% CAGR (2023-2033) |
Base year | 2022 |
Forecast Period | 2023-2033 |
Historical Data | 2021 |
Report Coverage | Revenue Forecast, Competitive Landscape, Growth Factors, and Trends |
Key Segmentations | Voltage, Material, End User |
Geographies Covered | North America, Europe, Asia-Pacific, Latin America, Middle East, Africa |
Key Vendors | ABL Electronic Supplies Inc, AFC Cable Systems Inc., Amphenol Corp., Asia Pacific Wire & Cable Corporation Ltd., Belden Inc., Cable USA, Carlisle Interconnect Technologies, Cerro Wire LLC, Hitachi Metals Ltd. And Delphi Automotive Plc |
Key Market Opportunities | • Renewable Energy Integration • Energy Efficiency Initiatives |
Key Market Drivers | • Technological Advancements • Increasing Urbanization |
REPORT CONTENT BRIEF:
- High-level analysis of the current and future Insulated Wire and Cable Market trends and opportunities
- Detailed analysis of current market drivers, restraining factors, and opportunities in the future
- Insulated Wire and Cable Market historical market size for the year 2021, and forecast from 2023 to 2033
- Insulated Wire and Cable Market share analysis at each product level
- Competitor analysis with detailed insight into its product segment, Government & Defense strength, and strategies adopted.
- Identifies key strategies adopted including product launches and developments, mergers and acquisitions, joint ventures, collaborations, and partnerships as well as funding taken and investment done, among others.
- To identify and understand the various factors involved in the global Insulated Wire and Cable Market affected by the pandemic
- To provide a detailed insight into the major companies operating in the market. The profiling will include the Government & Defense health of the company’s past 2-3 years with segmental and regional revenue breakup, product offering, recent developments, SWOT analysis, and key strategies.
Press Release
Memory Chip Market Estimated to Grow at a CAGR of 10.53% During the Forecast Period
Green Ammonia Market Projected to Reach USD 146.45 Billion by 2034, Growing at a CAGR of 72.14%
AI Chipset Market to Reach $2393.2 Billion by 2033 | 7.82% CAGR
Travel Insurance Market Soars: 20.14% CAGR
Smart Oilfield Market: 5.14% CAGR Expected
Catalog Management Systems Market Grows: 9.47% CAGR
Secondary Ticket Market Grows: 9.68% CAGR
Private Health Insurance Market: 5.12% CAGR Expected
Digital Content Market Surges: 12.63% CAGR
Crunchy Chocolates Market: 5.10% CAGR Expected
Frequently Asked Questions (FAQ)
1. What is the study period of this market?
- The study period of the global Insulated Wire and Cable Market is 2021- 2033
2. What is the growth rate of the global Insulated Wire and Cable Market?
- The global Insulated Wire and Cable Market is growing at a CAGR of 4.41% over the next 10 years
3. Which region has the highest growth rate in the market of Insulated Wire and Cable Market?
- Asia Pacific is expected to register the highest CAGR during 2023-2033
4. Which region has the largest share of the global Insulated Wire and Cable Market?
- North America holds the largest share in 2022
5. Who are the key players in the global Insulated Wire and Cable Market?
- ABL Electronic Supplies Inc, AFC Cable Systems Inc., Amphenol Corp., Asia Pacific Wire & Cable Corporation Ltd., Belden Inc., Cable USA, Carlisle Interconnect Technologies, Cerro Wire LLC, Hitachi Metals Ltd. And Delphi Automotive Plc. are the major companies operating in the market.
6. Do you offer Post Sale Support?
- Yes, we offer 16 hours of analyst support to solve the queries
7. Do you sell particular sections of a report?
Yes, we provide regional as well as country-level reports. Other than this we also provide a sectional report. Please get in contact with our sales representatives
Table of Content
CHAPTER 1. Executive Summary CHAPTER 2. Scope of the Study 2.1. Market Definition 2.2. Market Scope & Segmentation 2.2.1. Objective of Report CHAPTER 3. Evolve BI Methodology 3.1. Data Collection & Validation Approach 3.2. Market Size Estimation and Forecast CHAPTER 4. Exclusive Analysis 4.1. Market Opportunity Score 4.1.1. Voltage Segement – Market Opportunity Score 4.1.2. Material Segment – Market Opportunity Score 4.1.3. End User Segment – Market Opportunity Score 4.2. Key Market Influencing Indicators CHAPTER 5. Market Insights and Trends 5.1. Value Chain Analysis 5.1.1. Raw Material 5.1.2. Manufacturing Process 5.1.3. Distribution Channel 5.1.4. End User 5.2. Porter’s Five Forces Analysis 5.2.1. Bargaining Power of Buyers 5.2.2. Bargaining Power of Suppliers 5.2.3. Threat of New Entrant 5.2.4. Threat of Substitute 5.2.5. Industry Rivalry 5.3. COVID-19 Impact and Post COVID Scenario on Insulated Wire and Cable Market 5.3.1. Impact of COVID-19 5.3.2. Government Support and Industry Revival Policies 5.3.3. Measures Taken by Companies to Mitigate Negative Impact 5.3.4. Post COVID Trend CHAPTER 6. Market Dynamics 6.1. Introduction 6.2. Drivers 6.2.1. Driver 1 6.2.2. Driver 2 6.2.3. Driver 3 6.3. Restraints 6.3.1. Restraint 1 6.3.2. Restraint 2 6.4. Opportunity 6.4.1. Opportunity 1 CHAPTER 7. Insulated Wire and Cable Market, By Voltage 7.1. Introduction 7.1.1. Low Voltage 7.1.2. Medium Voltage 7.1.3. High Voltage CHAPTER 8 Insulated Wire and Cable Market By Material 8.1. Introduction 8.1.1. Metal 8.1.2. Plastic 8.1.3. Optical Fiber CHAPTER 9. Insulated Wire and Cable Market, By End User 9.1. Introduction 9.1.1. Telecommunication 9.1.2 Electronics 9.1.3 Construction 9.1.4 Others CHAPTER 10. Insulated Wire and Cable Market, By Region 10.1. Introduction 10.2. NORTH AMERICA 10.2.1. North America: Market Size and Forecast, By Country, 2023 – 2033 ($ Million) 10.2.2. North America: Market Size and Forecast, By Voltage, 2023 – 2033 ($ Million) 10.2.3. North America: Market Size and Forecast, By Material, 2023 – 2033 ($ Million) 10.2.4. North America: Market Size and Forecast, By End User, 2023 – 2033 ($ Million) 10.2.5. US 10.2.5.1. US: Market Size and Forecast, By Voltage, 2023 – 2033 ($ Million) 10.2.5.2. US: Market Size and Forecast, By Material, 2023 – 2033 ($ Million) 10.2.5.3. US: Market Size and Forecast, By End User, 2023 – 2033 ($ Million) 10.2.6. CANADA 10.2.6.1. Canada: Market Size and Forecast, By Voltage, 2023 – 2033 ($ Million) 10.2.6.2. Canada: Market Size and Forecast, By Material, 2023 – 2033 ($ Million) 10.2.6.3. Canada: Market Size and Forecast, By End User, 2023 – 2033 ($ Million) 10.2.7. MEXICO 10.2.7.1. Mexico: Market Size and Forecast, By Voltage, 2023 – 2033 ($ Million) 10.2.7.2. Mexico: Market Size and Forecast, By Material, 2023 – 2033 ($ Million) 10.2.7.3. Mexico: Market Size and Forecast, By End User, 2023 – 2033 ($ Million) 10.3. Europe 10.3.1. Europe: Market Size and Forecast, By Country, 2023 – 2033 ($ Million) 10.3.2. Europe: Market Size and Forecast, By Voltage, 2023 – 2033 ($ Million) 10.3.3. Europe: Market Size and Forecast, By Material, 2023 – 2033 ($ Million) 10.3.4. Europe: Market Size and Forecast, By End User, 2023 – 2033 ($ Million) 10.3.5. U.K. 10.3.5.1. U.K.: Market Size and Forecast, By Voltage, 2023 – 2033 ($ Million) 10.3.5.2. U.K.: Market Size and Forecast, By Material, 2023 – 2033 ($ Million) 10.3.5.3. U.K.: Market Size and Forecast, By End User, 2023 – 2033 ($ Million) 10.3.6. GERMANY 10.3.6.1. Germany: Market Size and Forecast, By Voltage, 2023 – 2033 ($ Million) 10.3.6.2. Germany: Market Size and Forecast, By Material, 2023 – 2033 ($ Million) 10.3.6.3. Germany: Market Size and Forecast, By End User, 2023 – 2033 ($ Million) 10.3.7. FRANCE 10.3.7.1. France: Market Size and Forecast, By Voltage, 2023 – 2033 ($ Million) 10.3.7.2. France: Market Size and Forecast, By Material, 2023 – 2033 ($ Million) 10.3.7.3. France: Market Size and Forecast, By End User, 2023 – 2033 ($ Million) 10.3.8. ITALY 10.3.8.1. Italy: Market Size and Forecast, By Voltage, 2023 – 2033 ($ Million) 10.3.8.2. Italy: Market Size and Forecast, By Material, 2023 – 2033 ($ Million) 10.3.8.3. Italy: Market Size and Forecast, By End User, 2023 – 2033 ($ Million) 10.3.9. SPAIN 10.3.9.1. Spain: Market Size and Forecast, By Voltage, 2023 – 2033 ($ Million) 10.3.9.2. Spain: Market Size and Forecast, By Material, 2023 – 2033 ($ Million) 10.3.9.3. Spain: Market Size and Forecast, By End User, 2023 – 2033 ($ Million) 10.3.10. BENELUX 10.3.10.1. BeNeLux: Market Size and Forecast, By Voltage, 2023 – 2033 ($ Million) 10.3.10.2. BeNeLux: Market Size and Forecast, By Material, 2023 – 2033 ($ Million) 10.3.10.3. BeNeLux: Market Size and Forecast, By End User, 2023 – 2033 ($ Million) 10.3.11. RUSSIA 10.3.11.1. Russia: Market Size and Forecast, By Voltage, 2023 – 2033 ($ Million) 10.3.11.2. Russia: Market Size and Forecast, By Material, 2023 – 2033 ($ Million) 10.3.11.3. Russia: Market Size and Forecast, By End User, 2023 – 2033 ($ Million) 10.3.12. REST OF EUROPE 10.3.12.1. Rest of Europe: Market Size and Forecast, By Voltage, 2023 – 2033 ($ Million) 10.3.12.2. Rest of Europe: Market Size and Forecast, By Material, 2023 – 2033 ($ Million) 10.3.12.3. Rest of Europe: Market Size and Forecast, By End User, 2023 – 2033 ($ Million) 10.4. Asia Pacific 10.4.1. Asia Pacific: Market Size and Forecast, By Country, 2023 – 2033 ($ Million) 10.4.2. Asia Pacific: Market Size and Forecast, By Voltage, 2023 – 2033 ($ Million) 10.4.3. Asia Pacific: Market Size and Forecast, By Material, 2023 – 2033 ($ Million) 10.4.4. Asia Pacific: Market Size and Forecast, By End User, 2023 – 2033 ($ Million) 10.4.5. CHINA 10.4.5.1. China: Market Size and Forecast, By Voltage, 2023 – 2033 ($ Million) 10.4.5.2. China: Market Size and Forecast, By Material, 2023 – 2033 ($ Million) 10.4.5.3. China: Market Size and Forecast, By End User, 2023 – 2033 ($ Million) 10.4.6. JAPAN 10.4.6.1. Japan: Market Size and Forecast, By Voltage, 2023 – 2033 ($ Million) 10.4.6.2. Japan: Market Size and Forecast, By Material, 2023 – 2033 ($ Million) 10.4.6.3. Japan: Market Size and Forecast, By End User, 2023 – 2033 ($ Million) 10.4.7. INDIA 10.4.7.1. India: Market Size and Forecast, By Voltage, 2023 – 2033 ($ Million) 10.4.7.2. India: Market Size and Forecast, By Material, 2023 – 2033 ($ Million) 10.4.7.3. India: Market Size and Forecast, By End User, 2023 – 2033 ($ Million) 10.4.8. SOUTH KOREA 10.4.8.1. South Korea: Market Size and Forecast, By Voltage, 2023 – 2033 ($ Million) 10.4.8.2. South Korea: Market Size and Forecast, By Material, 2023 – 2033 ($ Million) 10.4.8.3. South Korea: Market Size and Forecast, By End User, 2023 – 2033 ($ Million) 10.4.9. THAILAND 10.4.9.1. Thailand: Market Size and Forecast, By Voltage, 2023 – 2033 ($ Million) 10.4.9.2. Thailand: Market Size and Forecast, By Material, 2023 – 2033 ($ Million) 10.4.9.3. Thailand: Market Size and Forecast, By End User, 2023 – 2033 ($ Million) 10.4.10. INDONESIA 10.4.10.1. Indonesia: Market Size and Forecast, By Voltage, 2023 – 2033 ($ Million) 10.4.10.2. Indonesia: Market Size and Forecast, By Material, 2023 – 2033 ($ Million) 10.4.10.3. Indonesia: Market Size and Forecast, By End User, 2023 – 2033 ($ Million) 10.4.11. MALAYSIA 10.4.11.1. Malaysia: Market Size and Forecast, By Voltage, 2023 – 2033 ($ Million) 10.4.11.2. Malaysia: Market Size and Forecast, By Material, 2023 – 2033 ($ Million) 10.4.11.3. Malaysia: Market Size and Forecast, By End User, 2023 – 2033 ($ Million) 10.4.12. AUSTRALIA 10.4.12.1. Australia: Market Size and Forecast, By Voltage, 2023 – 2033 ($ Million) 10.4.12.2. Australia: Market Size and Forecast, By Material, 2023 – 2033 ($ Million) 10.4.12.3. Australia: Market Size and Forecast, By End User, 2023 – 2033 ($ Million) 10.4.13. REST FO ASIA PACIFIC 10.4.13.1. Rest fo Asia Pacific: Market Size and Forecast, By Voltage, 2023 – 2033 ($ Million) 10.4.13.2. Rest fo Asia Pacific: Market Size and Forecast, By Material, 2023 – 2033 ($ Million) 10.4.13.3. Rest fo Asia Pacific: Market Size and Forecast, By End User, 2023 – 2033 ($ Million) 10.5. South America 10.5.1. South America: Market Size and Forecast, By Country, 2023 – 2033 ($ Million) 10.5.2. South America: Market Size and Forecast, By Voltage, 2023 – 2033 ($ Million) 10.5.3. South America: Market Size and Forecast, By Material, 2023 – 2033 ($ Million) 10.5.4. South America: Market Size and Forecast, By End User, 2023 – 2033 ($ Million) 10.5.5. BRAZIL 10.5.5.1. Brazil: Market Size and Forecast, By Voltage, 2023 – 2033 ($ Million) 10.5.5.2. Brazil: Market Size and Forecast, By Material, 2023 – 2033 ($ Million) 10.5.5.3. Brazil: Market Size and Forecast, By End User, 2023 – 2033 ($ Million) 10.5.6. ARGENTINA 10.5.6.1. Argentina: Market Size and Forecast, By Voltage, 2023 – 2033 ($ Million) 10.5.6.2. Argentina: Market Size and Forecast, By Material, 2023 – 2033 ($ Million) 10.5.6.3. Argentina: Market Size and Forecast, By End User, 2023 – 2033 ($ Million) 10.5.7. REST OF SOUTH AMERICA 10.5.7.1. Rest of South America: Market Size and Forecast, By Voltage, 2023 – 2033 ($ Million) 10.5.7.2. Rest of South America: Market Size and Forecast, By Material, 2023 – 2033 ($ Million) 10.5.7.3. Rest of South America: Market Size and Forecast, By End User, 2023 – 2033 ($ Million) 10.6. Middle East & Africa 10.6.1. Middle East & Africa: Market Size and Forecast, By Country, 2023 – 2033 ($ Million) 10.6.2. Middle East & Africa: Market Size and Forecast, By Voltage, 2023 – 2033 ($ Million) 10.6.3. Middle East & Africa: Market Size and Forecast, By Material, 2023 – 2033 ($ Million) 10.6.4. Middle East & Africa: Market Size and Forecast, By End User, 2023 – 2033 ($ Million) 10.6.5. SAUDI ARABIA 10.6.5.1. Saudi Arabia: Market Size and Forecast, By Voltage, 2023 – 2033 ($ Million) 10.6.5.2. Saudi Arabia: Market Size and Forecast, By Material, 2023 – 2033 ($ Million) 10.6.5.3. Saudi Arabia: Market Size and Forecast, By End User, 2023 – 2033 ($ Million) 10.6.6. UAE 10.6.6.1. UAE: Market Size and Forecast, By Voltage, 2023 – 2033 ($ Million) 10.6.6.2. UAE: Market Size and Forecast, By Material, 2023 – 2033 ($ Million) 10.6.6.3. UAE: Market Size and Forecast, By End User, 2023 – 2033 ($ Million) 10.6.7. EGYPT 10.6.7.1. Egypt: Market Size and Forecast, By Voltage, 2023 – 2033 ($ Million) 10.6.7.2. Egypt: Market Size and Forecast, By Material, 2023 – 2033 ($ Million) 10.6.7.3. Egypt: Market Size and Forecast, By End User, 2023 – 2033 ($ Million) 10.6.8. SOUTH AFRICA 10.6.8.1. South Africa: Market Size and Forecast, By Voltage, 2023 – 2033 ($ Million) 10.6.8.2. South Africa: Market Size and Forecast, By Material, 2023 – 2033 ($ Million) 10.6.8.3. South Africa: Market Size and Forecast, By End User, 2023 – 2033 ($ Million) 10.6.9. REST OF MIDDLE EAST & AFRICA 10.6.9.1. Rest of Middle East & Africa: Market Size and Forecast, By Voltage, 2023 – 2033 ($ Million) 10.6.9.2. Rest of Middle East & Africa: Market Size and Forecast, By Material, 2023 – 2033 ($ Million) 10.6.9.3.__________ Rest of Middle East & Africa: Market Size and Forecast, By End User, 2023 – 2033 ($ Million) CHAPTER 12. Competitive Landscape 12.1. Competitior Benchmarking 2023 12.2. Market Share Analysis 12.3. Key Developments Analysis By Top 5 Companies 12.4. Market Share Acquisition Strategies: Analysis of Key Approaches Employed by Top Players CHAPTER 13. Company Profiles 13.1. ABL Electronic Supplies Inc 13.1.1. Hanon Systems 13.1.2. Financial Analysis 13.1.2.1. Business Segment Revenue, 2020, 2021, 2022, $ Million 13.1.2.2. Geographic Revenue Mix, 2022 (% Share) 13.1.3. Product Portfolio 13.1.4. Recent Development and Strategies Adopted 13.1.5. SWOT Analysis 13.2. AFC Cable Systems Inc. 13.3. Amphenol Corp. 13.4. Asia Pacific Wire & Cable Corporation Ltd. 13.5. Belden Inc. 13.6. Cable USA 13.7. Carlisle Interconnect Technologies 13.8. Cerro Wire LLC 13.9 Hitachi Metals Ltd. 13.10 Delphi Automotive Plc