Green ammonia Market Analysis and Global Forecast 2023-2033
$ 1,390.00 – $ 5,520.00Price range: $ 1,390.00 through $ 5,520.00
Green ammonia Market Research Report: Information By Technology (Alkaline Water Electrolysis, Proton Exchange Membrane And Solid Oxide Electrolysis), By Capacity (High, Medium and Low), By End User (Power Generation, Transportation and Industrial Feedstocks), and by Region — Forecast till 2033
Green ammonia Market Overview
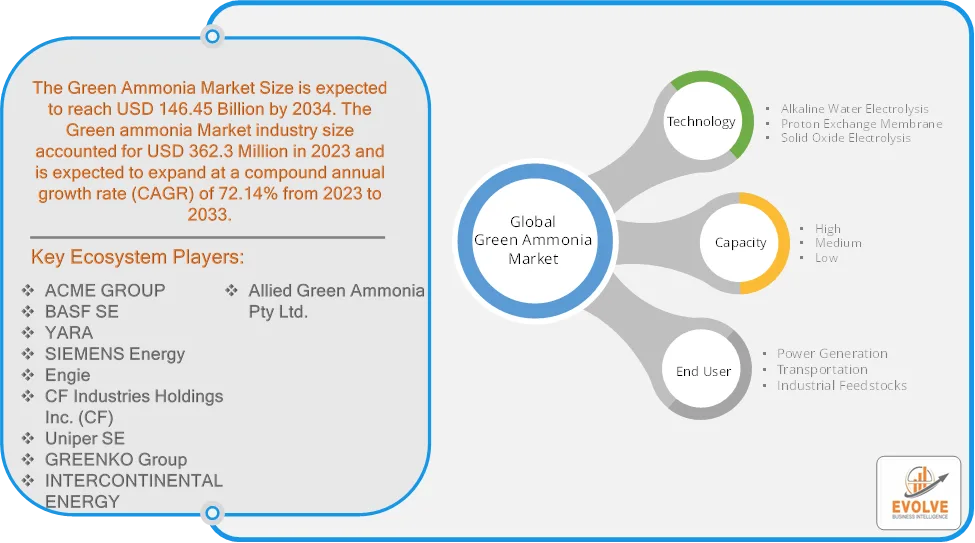
The Green ammonia Market Size is expected to reach USD 146.45 Billion by 2034. The Green ammonia Market industry size accounted for USD 362.3 Million in 2023 and is expected to expand at a compound annual growth rate (CAGR) of 72.14% from 2023 to 2033. The Green Ammonia Market refers to the global industry centered around the production, distribution, and utilization of ammonia that is synthesized using renewable energy sources instead of conventional fossil fuels. In green ammonia production, hydrogen is typically derived through the electrolysis of water powered by renewable energy sources such as wind, solar, or hydropower, and then combined with nitrogen from the air to create ammonia.
The Green Ammonia Market is projected to expand rapidly as industries and governments work towards decarbonization, sustainability, and renewable energy goals.
Global Green ammonia Market Synopsis
 Green ammonia Market Dynamics
The major factors that have impacted the growth of Green ammonia Market are as follows:
Drivers:
Ø Rising Demand for Sustainable Agricultural Practices
Fertilizer Industry: Ammonia is a critical component in nitrogen-based fertilizers. With increasing pressure to adopt sustainable practices, green ammonia offers a low-carbon alternative to conventional ammonia. The declining costs of renewable energy, such as wind and solar, make the production of green ammonia more economically feasible. Advances in electrolysis technology are reducing costs and improving the efficiency of green hydrogen production, which is crucial for green ammonia synthesis.
Restraint:
- Perception of High Production Costs
Green ammonia production relies heavily on renewable energy, which can have higher costs compared to conventional fossil fuels in some regions. The cost of electrolyzers and the energy-intensive nature of the process make green ammonia more expensive than traditional ammonia. The current state of electrolyzer technology requires improvements in efficiency and scalability to make green ammonia cost-effective.
Opportunity:
⮚ Decarbonization of the Fertilizer Industry
Green ammonia offers a low-carbon alternative for nitrogen-based fertilizers, addressing the rising demand for eco-friendly agricultural practices. Green ammonia can act as a practical carrier for hydrogen, enabling efficient storage and transportation over long distances. Green ammonia is gaining traction as a zero-carbon fuel alternative for ships, supported by International Maritime Organization (IMO) regulations targeting emission reductions. Innovations in electrolyzer technology can lower production costs and increase the scalability of green ammonia projects.
Green ammonia Market Segment Overview
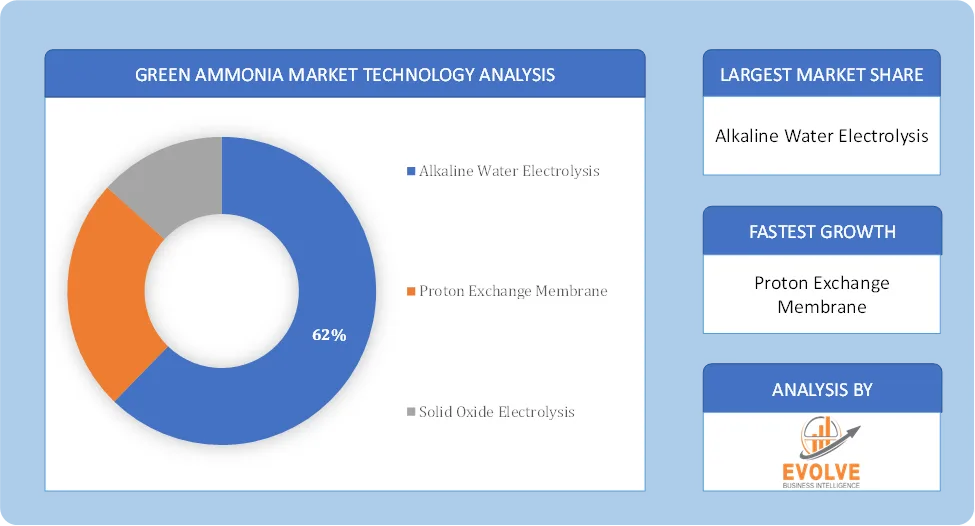
Based on Technology, the market is segmented based on alkaline water electrolysis, proton exchange membrane and solid oxide electrolysis. Proton Exchange Membrane (PEM) electrolysis is an advanced technology for producing green hydrogen, integral to green ammonia synthesis. PEM electrolysis uses a solid polymer electrolyte to conduct protons from the anode to the cathode, where hydrogen gas is generated. This process operates at higher current densities and provides greater efficiency and responsiveness compared to alkaline water electrolysis. Powered by renewable electricity, PEM electrolysis is ideal for intermittent energy sources like wind and solar, as it can quickly adjust to fluctuations in power supply.
By Capacity
Based on Capacity, the market is segmented based on High, Medium and Low. The medium capacity of green ammonia refers to production, storage, or utilization levels that fall between small-scale pilot projects and large-scale industrial Technologys. Medium-capacity facilities are often used to bridge the gap between experimental or demonstration-scale plants and full-scale commercial facilities, producing green ammonia at a moderate volume, typically in the range of thousands to tens of thousands of tons annually. These medium-scale projects serve several purposes, including testing the viability of green ammonia technologies, optimizing processes, and establishing supply chains.
By End user
Based on End User, the market has been divided into the Power Generation, Transportation and Industrial Feedstocks. The transportation category generated the most income. The worldwide fuel energy crisis, which has fueled the need for green fuel, is to blame for its large share. Renewable sources, including green ammonia and others, are replacing conventional ones. These sources generate fuel that is clean, effective, and environmentally benign. Global attention is being given to issues like environmental preservation and carbon emissions.
Global Green ammonia Market Regional Analysis
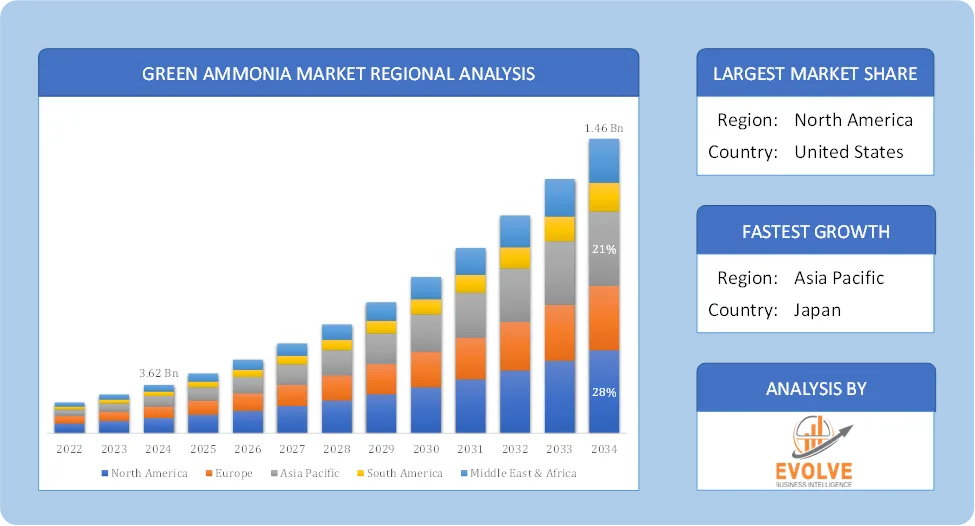
Based on region, the global Green ammonia Market has been divided into North America, Europe, Asia-Pacific, the Middle East & Africa, and Latin America. North America is projected to dominate the use of the Green ammonia Market followed by the Asia-Pacific and Europe regions.
 Global Green ammonia North America Market
North America holds a dominant position in the Green ammonia Market. North America has significant growth potential due to abundant renewable energy resources and increasing investments in green hydrogen projects. Government policies and incentives promoting green energy and sustainable agriculture. Rising investments in decarbonizing the fertilizer and chemical industries. Growing demand for sustainable fertilizers in agriculture and Potential for green ammonia as a marine fuel in ports along the Atlantic and Pacific coasts.
Global Green ammonia Asia-Pacific Market
The Asia-Pacific region has indeed emerged as the fastest-growing market for the Green ammonia Market industry. The Asia-Pacific region is projected to be the fastest-growing market due to its rapidly expanding industrial sector and increasing energy demand. Rapid urbanization and industrialization increasing the demand for sustainable energy. Rising investments in renewable energy projects and green hydrogen production and Growing agricultural sector requiring sustainable fertilizers.
Competitive Landscape
The global Green ammonia Market is highly competitive, with numerous players offering a wide range of software solutions. The competitive landscape is characterized by the presence of established companies, as well as emerging startups and niche players. To increase their market position and attract a wide consumer base, the businesses are employing various strategies, such as product launches, and strategic alliances.
Prominent Players:
- ACME GROUP
- BASF SE
- YARA
- SIEMENS Energy
- Engie
- CF Industries Holdings Inc. (CF)
- Uniper SE
- GREENKO Group
- INTERCONTINENTAL ENERGY
- Allied Green Ammonia Pty Ltd.
Scope of the Report
Global Green ammonia Market, by Technology
- Alkaline Water Electrolysis
- Proton Exchange Membrane Electrolysis
- Solid Oxide Electrolysis
Global Green ammonia Market, by Capacity
- High
- Medium
- Low
Global Green ammonia Market, by End User
- Power Generation
- Transportation and Industrial Feedstocks
Global Green ammonia Market, by Region
- North America
- US
- Canada
- Mexico
- Europe
- UK
- Germany
- France
- Italy
- Spain
- Benelux
- Nordic
- Rest of Europe
- Asia Pacific
- China
- Japan
- South Korea
- Indonesia
- Austalia
- Malaysia
- India
- Rest of Asia Pacific
- South America
- Brazil
- Argentina
- Rest of SouthAmerica
- Middle East &Africa
- Saudi Arabia
- UAE
- Egypt
- SouthAfrica
- Rest of Middle East & Africa
| Parameters | Indicators |
|---|---|
| Market Size | 2033: USD607.2Billion |
| CAGR (2023-2033) | 4.41% |
| Base year | 2022 |
| Forecast Period | 2023-2033 |
| Historical Data | 2021 (2017 to 2020 On Demand) |
| Report Coverage | Revenue Forecast, Competitive Landscape, Growth Factors, and Trends |
| Key Segmentations | Technology, Capacity, End User |
| Geographies Covered | North America, Europe, Asia-Pacific, South America, Middle East, Africa |
| Key Vendors | ACME GROUP, BASF SE, YARA, SIEMENS Energy, Engie, CF Industries Holdings Inc. (CF), Uniper SE, GREENKO Group, INTERCONTINENTAL ENERGY And Allied Green Ammonia Pty Ltd. |
| Key Market Opportunities | · Decarbonization of the Fertilizer Industry |
| Key Market Drivers | · Rising Demand for Sustainable Agricultural Practices · Expansion of Renewable Energy Infrastructure |
REPORT CONTENT BRIEF:
- High-level analysis of the current and future Green ammonia Market trends and opportunities
- Detailed analysis of current market drivers, restraining factors, and opportunities in the future
- Green ammonia Market historical market size for the year 2021, and forecast from 2023 to 2033
- Green ammonia Market share analysis at each product level
- Competitor analysis with detailed insight into its product segment, Government & Defense strength, and strategies adopted.
- Identifies key strategies adopted including product launches and developments, mergers and acquisitions, joint ventures, collaborations, and partnerships as well as funding taken and investment done, among others.
- To identify and understand the various factors involved in the global Green ammonia Market affected by the pandemic
- To provide a detailed insight into the major companies operating in the market. The profiling will include the Government & Defense health of the company’s past 2-3 years with segmental and regional revenue breakup, product offering, recent developments, SWOT analysis, and key strategies.
Frequently Asked Questions (FAQ)
What is the study period of this market?
The study period of the global Green ammonia Market is 2021- 2033
What is the growth rate of the global Green ammonia Market?
The global Green ammonia Market is growing at a CAGR of 4.41% over the next 10 years
Which region has the highest growth rate in the market of Green ammonia Market?
Asia Pacific is expected to register the highest CAGR during 2023-2033
Which region has the largest share of the global Green ammonia Market?
North America holds the largest share in 2022
Who are the key players in the global Green ammonia Market?
ACME GROUP, BASF SE, YARA, SIEMENS Energy, Engie, CF Industries Holdings Inc. (CF), Uniper SE, GREENKO Group, INTERCONTINENTAL ENERGY And Allied Green Ammonia Pty Ltd. are the major companies operating in the market.
Do you offer Post Sale Support?
Yes, we offer 16 hours of analyst support to solve the queries
Do you sell particular sections of a report?
Yes, we provide regional as well as country-level reports. Other than this we also provide a sectional report. Please get in contact with our sales representatives.
Press Release

Global Pharmaceutical Manufacturing Market to Reach $1.38 Trillion by 2035 with 7.35% CAGR, New Research Shows

The Global Mammography Market Is Estimated To Record a CAGR of Around 10.29% During The Forecast Period

Glue Stick Market to Reach USD 2.35 Billion by 2034

Podiatry Service Market to Reach USD 11.88 Billion by 2034

Microfluidics Technology Market to Reach USD 32.58 Billion by 2034

Ferric Chloride Market to Reach USD 10.65 Billion by 2034

Family Practice EMR Software Market to Reach USD 21.52 Billion by 2034

Electric Hairbrush Market to Reach USD 15.95 Billion by 2034

Daily Bamboo Products Market to Reach USD 143.52 Billion by 2034

Cross-border E-commerce Logistics Market to Reach USD 112.65 Billion by 2034
Table of Content
Chapter 1. Executive Summary Chapter 2. Scope Of The Study 2.1. Market Definition 2.2. Scope Of The Study 2.2.1. Objectives of Report 2.2.2. Limitations 2.3. Market Structure Chapter 3. Evolve BI Methodology Chapter 4. Market Insights and Trends 4.1. Supply/ Value Chain Analysis 4.1.1. Raw Material Providers 4.1.2. Manufacturing Process 4.1.3. Distributors/Retailers 4.1.4. End-Use Industry 4.2. Porter’s Five Forces Analysis 4.2.1. Threat Of New Entrants 4.2.2. Bargaining Power Of Buyers 4.2.3. Bargaining Power Of Suppliers 4.2.4. Threat Of Substitutes 4.2.5. Industry Rivalry 4.3. Impact Of COVID-19 on the AI Chipset Market 4.3.1. Impact on Market Size 4.3.2. End-Use Industry Trend, Preferences, and Budget Impact 4.3.3. Regulatory Framework/Government Policies 4.3.4. Key Players' Strategy to Tackle Negative Impact 4.3.5. Opportunity Window 4.4. Technology Overview 12.28. Macro factor 4.6. Micro Factor 4.7. Demand Supply Gap Analysis of the AI Chipset Market 4.8. Import Analysis of the AI Chipset Market 4.9. Export Analysis of the AI Chipset Market Chapter 5. Market Dynamics 5.1. Introduction 5.2. DROC Analysis 5.2.1. Drivers 5.2.2. Restraints 5.2.3. Opportunities 5.2.4. Challenges 5.3. Patent Analysis 5.4. Industry Roadmap 5.5. Parent/Peer Market Analysis Chapter 6. Global AI Chipset Market, By Component 6.1. Introduction 6.2. Central Processing Unit (CPU) 6.3. Graphics Processing Unit (GPU) 6.4. Neural Network Processor (NNP) 6.5. Other Chapter 7. Global AI Chipset Market, By Application 7.1. Introduction 7.2. Consumer Electronics 7.3. Automotive 7.4. Healthcare 7.5. Automation and Robotics 7.6. Other Chapter 8. Global AI Chipset Market, By Region 8.1. Introduction 8.2. North America 8.2.1. Introduction 8.2.2. Driving Factors, Opportunity Analyzed, and Key Trends 8.2.3. Market Size and Forecast, By Country, 2023-2033 8.2.4. Market Size and Forecast, By Component, 2023-2033 8.2.5. Market Size and Forecast, By Application, 2023-2033 8.2.6. US 8.2.6.1. Introduction 8.2.6.2. Driving Factors, Opportunity Analyzed, and Key Trends 8.2.6.3. Market Size and Forecast, By Component, 2023-2033 8.2.6.4. Market Size and Forecast, By Application, 2023-2033 8.2.7. Canada 8.2.7.1. Introduction 8.2.7.2. Driving Factors, Opportunity Analyzed, and Key Trends 8.2.7.4. Market Size and Forecast, By Component, 2023-2033 8.2.7.5. Market Size and Forecast, By Application, 2023-2033 8.3. Europe 8.3.1. Introduction 8.3.2. Driving Factors, Opportunity Analyzed, and Key Trends 8.3.3. Market Size and Forecast, By Country, 2023-2033 8.3.4. Market Size and Forecast, By Component, 2023-2033 8.3.5. Market Size and Forecast, By Application, 2023-2033 8.3.6. Germany 8.3.6.1. Introduction 8.3.6.2. Driving Factors, Opportunity Analyzed, and Key Trends 8.3.6.3. Market Size and Forecast, By Component, 2023-2033 8.3.6.4. Market Size and Forecast, By Application, 2023-2033 8.3.7. France 8.3.7.1. Introduction 8.3.7.2. Driving Factors, Opportunity Analyzed, and Key Trends 8.3.7.3. Market Size and Forecast, By Component, 2023-2033 8.3.7.4. Market Size and Forecast, By Application, 2023-2033 8.3.8. UK 8.3.8.1. Introduction 8.3.8.2. Driving Factors, Opportunity Analyzed, and Key Trends 8.3.8.3. Market Size and Forecast, By Component, 2023-2033 8.3.8.4. Market Size and Forecast, By Application, 2023-2033 8.3.9. Italy 8.3.9.1. Introduction 8.3.9.2. Driving Factors, Opportunity Analyzed, and Key Trends 8.3.9.3. Market Size and Forecast, By Component, 2023-2033 8.3.9.4. Market Size and Forecast, By Application, 2023-2033 8.3.11. Rest Of Europe 8.3.11.1. Introduction 8.3.11.2. Driving Factors, Opportunity Analyzed, and Key Trends 8.3.11.3. Market Size and Forecast, By Component, 2023-2033 8.3.11.4. Market Size and Forecast, By Application, 2023-2033 8.4. Asia-Pacific 8.4.1. Introduction 8.4.2. Driving Factors, Opportunity Analyzed, and Key Trends 8.4.3. Market Size and Forecast, By Country, 2023-2033 8.4.4. Market Size and Forecast, By Component, 2023-2033 8.12.28. Market Size and Forecast, By Application, 2023-2033 8.4.6. China 8.4.6.1. Introduction 8.4.6.2. Driving Factors, Opportunity Analyzed, and Key Trends 8.4.6.3. Market Size and Forecast, By Component, 2023-2033 8.4.6.4. Market Size and Forecast, By Application, 2023-2033 8.4.7. India 8.4.7.1. Introduction 8.4.7.2. Driving Factors, Opportunity Analyzed, and Key Trends 8.4.7.3. Market Size and Forecast, By Component, 2023-2033 8.4.7.4. Market Size and Forecast, By Application, 2023-2033 8.4.8. Japan 8.4.8.1. Introduction 8.4.8.2. Driving Factors, Opportunity Analyzed, and Key Trends 8.4.8.3. Market Size and Forecast, By Component, 2023-2033 8.4.8.4. Market Size and Forecast, By Application, 2023-2033 8.4.9. South Korea 8.4.9.1. Introduction 8.4.9.2. Driving Factors, Opportunity Analyzed, and Key Trends 8.4.9.3. Market Size and Forecast, By Component, 2023-2033 8.4.9.4. Market Size and Forecast, By Application, 2023-2033 8.4.10. Rest Of Asia-Pacific 8.4.10.1. Introduction 8.4.10.2. Driving Factors, Opportunity Analyzed, and Key Trends 8.4.10.3. Market Size and Forecast, By Component, 2023-2033 8.4.10.4. Market Size and Forecast, By Application, 2023-2033 8.5. Rest Of The World (RoW) 8.5.1. Introduction 8.5.2. Driving Factors, Opportunity Analyzed, and Key Trends 8.5.3. Market Size and Forecast, By Component, 2023-2033 8.5.4. Market Size and Forecast, By Application, 2023-2033 Chapter 9. Company Landscape 9.1. Introduction 9.2. Vendor Share Analysis 9.3. Key Development Analysis 9.4. Competitor Dashboard Chapter 10. Company Profiles 10.1. Advanced Micro Devices Inc. (AMD) 10.1.1. Business Overview 10.1.2. Government & Defense Analysis 10.1.2.1. Government & Defense – Existing/Funding 10.1.3. Product Portfolio 10.1.4. Recent Development and Strategies Adopted 10.1.5. SWOT Analysis 10.2. Xilinx Inc 10.2.1. Business Overview 10.2.2. Government & Defense Analysis 10.2.2.1. Government & Defense – Existing/Funding 10.2.3. Product Portfolio 10.2.4. Recent Development and Strategies Adopted 10.2.5. SWOT Analysis 10.3. Graphcore Ltd 10.3.1. Business Overview 10.3.2. Government & Defense Analysis 10.3.2.1. Government & Defense – Existing/Funding 10.3.3. Product Portfolio 10.3.4. Recent Development and Strategies Adopted 10.3.5. SWOT Analysis 10.4. Huawei Technologies Co. Ltd 10.4.1. Business Overview 10.4.2. Government & Defense Analysis 10.4.2.1. Government & Defense – Existing/Funding 10.4.3. Product Portfolio 10.4.4. Recent Development and Strategies Adopted 10.12.28. SWOT Analysis 10.5. IBM Corporation 10.5.1. Business Overview 10.5.2. Government & Defense Analysis 10.5.2.1. Government & Defense – Existing/Funding 10.5.3. Product Portfolio 10.5.4. Recent Development and Strategies Adopted 10.5.5. SWOT Analysis 10.6. Intel Corporation 10.6.1. Business Overview 10.6.2. Government & Defense Analysis 10.6.2.1. Government & Defense – Existing/Funding 10.6.3. Product Portfolio 10.6.4. Recent Development and Strategies Adopted 10.6.5. SWOT Analysis 10.7. NVIDIA Corporation 10.7.1. Business Overview 10.7.2. Government & Defense Analysis 10.7.2.1. Government & Defense – Existing/Funding 10.7.3. Product Portfolio 10.7.4. Recent Development and Strategies Adopted 10.7.5. SWOT Analysis 10.8 Micron Technology Inc 10.8.1. Business Overview 10.8.2. Government & Defense Analysis 10.8.2.1. Government & Defense – Existing/Funding 10.8.3. Product Portfolio 10.8.4. Recent Development and Strategies Adopted 10.8.5. SWOT Analysis 10.9 Samsung Semiconductor 10.9.1. Business Overview 10.9.2. Government & Defense Analysis 10.9.2.1. Government & Defense – Existing/Funding 10.9.3. Product Portfolio 10.9.4. Recent Development and Strategies Adopted 10.9.5. SWOT Analysis
Connect to Analyst
Research Methodology


