Fluorite Market Analysis and Global Forecast 2023-2033
Price range: $ 1,390.00 through $ 5,520.00
Fluorite Market Research Report: Information By Form (Powder, Lump, and Filter Cake), By Purity and its Application (Acid Spar, Met Spar, and Ceramic Spar), By End Use Industry (Metallurgy, Chemical, Ceramic, Optical, and Electrical & Electronics), and by Region — Forecast till 2033
Page: 129
Fluorite Market Overview
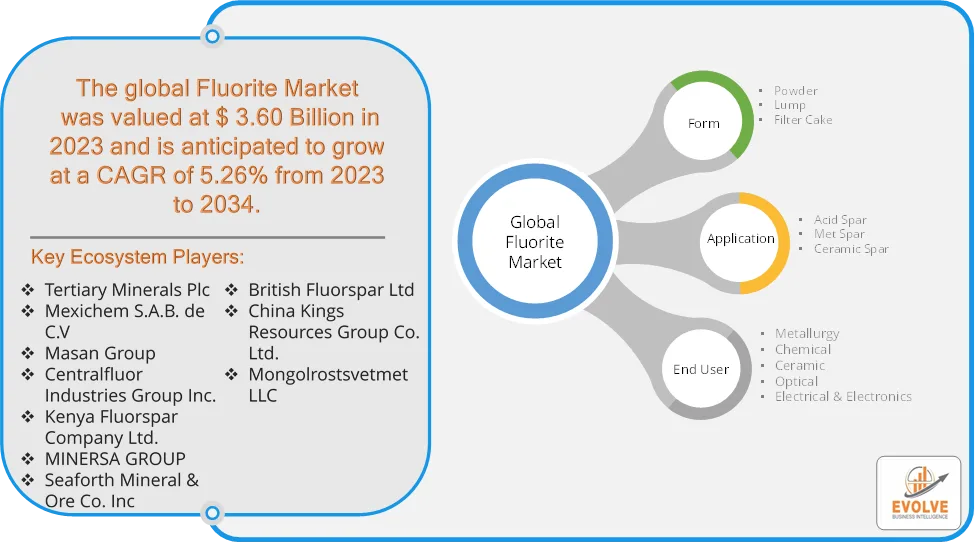
The Fluorite Market size accounted for USD 3.60 Billion in 2023 and is estimated to account for 3.85 Billion in 2024. The Market is expected to reach USD 5.87 Billion by 2034 growing at a compound annual growth rate (CAGR) of 5.26% from 2024 to 2034. Fluorite, also known as fluorspar, is a naturally occurring mineral composed of calcium fluoride (CaF₂). It is widely used in industries such as metallurgy, chemical manufacturing, ceramics, and optics. The primary grades of fluorite include acid-grade (used in hydrofluoric acid production) and metallurgical-grade (used in steelmaking and aluminum smelting).
The fluorite market is driven by the mineral’s essential role in various industrial processes, with the chemical and metallurgical sectors being the primary consumers. However, environmental concerns and market volatility pose challenges to its growth.
Global Fluorite Market Synopsis

Fluorite Market Dynamics
The major factors that have impacted the growth of Fluorite Market are as follows:
Drivers:
Ø Rising Demand for Hydrofluoric Acid (HF) Production
Hydrofluoric acid (HF) is derived from acid-grade fluorite and is a critical raw material in fluorochemicals, fluoropolymers, and refrigerants. The growing use of fluorinated refrigerants (HFCs & HFOs) in air conditioning and cooling systems drives demand and HF is also crucial in the manufacture of lithium-ion batteries for electric vehicles (EVs). Fluorine-based compounds are used in electrolytes for lithium-ion batteries, improving battery performance and safety. The electric vehicle (EV) boom is accelerating the demand for lithium-ion batteries, indirectly boosting fluorite consumption and expanding renewable energy storage solutions further supports market growth.
Restraint:
- Price Volatility & High Production Costs
Mining and processing fluorite is capital-intensive, requiring advanced extraction and refining technologies. Price fluctuations in the market are common due to supply-demand imbalances, geopolitical risks, and production cuts and higher transportation and energy costs further impact profitability, particularly for small and medium-sized miners. Advancements in synthetic fluorine-based compounds could reduce the dependence on natural fluorite and some industries are exploring alternative flux materials in metallurgy to replace fluorite.
Opportunity:
⮚ Rising Demand for Fluorine-Based Battery Materials
Fluorine-based electrolytes are gaining traction in lithium-ion batteries (LIBs) and next-generation solid-state batteries. Growing adoption of electric vehicles (EVs) and renewable energy storage is increasing fluorite demand. Fluoropolymers (e.g., PTFE, PVDF) are essential in semiconductors, aerospace, medical devices, and automotive coatings. The growth of 5G technology, AI, and cloud computing is driving demand for semiconductors, boosting fluorite-based chemical use and increased usage in medical implants, drug delivery systems, and non-stick coatings presents further market expansion.
Fluorite Market Segment Overview
 By Form
Based on Form, the market is segmented based on Powder, Lump, and Filter Cake. The Powder segment dominant the market. The powder form of fluorite is essential for its efficient use in many industrial processes. It allows for better mixing, increased surface area for reactions, and improved control over chemical processes and Improved refining technologies enhance fluorite powder purity and efficiency.
By Application
Based on Application, the market segment has been divided into Acid Spar, Met Spar, and Ceramic Spar. The Acid Spar segment the market. The acid spar segment is a significant portion of the overall fluorite market due to the widespread use of fluorine-based chemicals. HF derived from Acid Spar is used to produce PTFE (Teflon), PVDF, and other fluoropolymers used in aerospace, electronics, and medical applications.
By End Use
Based on End Use, the market segment has been divided into the Metallurgy, Chemical, Ceramic, Optical, and Electrical & Electronics. Metallurgy segment dominant the market.
Global Fluorite Market Regional Analysis
Based on region, the global Fluorite Market has been divided into North America, Europe, Asia-Pacific, the Middle East & Africa, and Latin America. North America is projected to dominate the use of the Fluorite Market followed by the Asia-Pacific and Europe regions.

North America Global Fluorite Market
North America holds a dominant position in the Fluorite Market. The United States and Canada are significant consumers of fluorite, particularly for chemical applications. Demand is driven by the production of hydrofluoric acid and fluorochemicals. There is Growth in renewable energy and lithium-ion battery production fuels fluorite demand and Increasing automotive and battery production requiring fluorine-based compounds.
Asia-Pacific Global Fluorite Market
The Asia-Pacific region has indeed emerged as the fastest-growing market for the Fluorite Market industry. Asia-Pacific region holds the largest market share, driven by the rapid industrialization of countries like China and India. China is a major producer and consumer of fluorite, with significant demand from its steel, chemical, and cement industries and India’s growing infrastructure development also contributes to increased fluorite consumption. Strong growth in the steel and aluminum industries and expanding chemical manufacturing sector.
Competitive Landscape
The global Fluorite Market is highly competitive, with numerous players offering a wide range of software solutions. The competitive landscape is characterized by the presence of established companies, as well as emerging startups and niche players. To increase their market position and attract a wide consumer base, the businesses are employing various strategies, such as product launches, and strategic alliances.
Prominent Players:
- Tertiary Minerals Plc
- Mexichem S.A.B. de C.V
- Masan Group
- Centralfluor Industries Group Inc.
- Kenya Fluorspar Company Ltd.
- MINERSA GROUP
- Seaforth Mineral & Ore Co. Inc
- British Fluorspar Ltd
- China Kings Resources Group Co. Ltd.
- Mongolrostsvetmet LLC.
Scope of the Report
Global Fluorite Market, by Form
- Powder
- Lump
- Filter Cake
Global Fluorite Market, by Application
- Acid Spar
- Met Spar
- Ceramic Spar
Global Fluorite Market, by End Use
- Metallurgy
- Chemical
- Ceramic
- Optical
- Electrical & Electronics
Global Fluorite Market, by Region
- North America
- US
- Canada
- Mexico
- Europe
- UK
- Germany
- France
- Italy
- Spain
- Benelux
- Nordic
- Rest of Europe
- Asia Pacific
- China
- Japan
- South Korea
- Indonesia
- Austalia
- Malaysia
- India
- Rest of Asia Pacific
- South America
- Brazil
- Argentina
- Rest of SouthAmerica
- Middle East &Africa
- Saudi Arabia
- UAE
- Egypt
- SouthAfrica
- Rest of Middle East & Africa
| Parameters | Indicators |
|---|---|
| Market Size | 2033: USD 5.87 Billion |
| CAGR (2023-2033) | 5.26% |
| Base year | 2022 |
| Forecast Period | 2023-2033 |
| Historical Data | 2021 (2017 to 2020 On Demand) |
| Report Coverage | Revenue Forecast, Competitive Landscape, Growth Factors, and Trends |
| Key Segmentations | Form, Application, End Use |
| Geographies Covered | North America, Europe, Asia-Pacific, South America, Middle East, Africa |
| Key Vendors | Tertiary Minerals Plc, Mexichem S.A.B. de C.V, Masan Group, Centralfluor Industries Group Inc., Kenya Fluorspar Company Ltd., MINERSA GROUP, Seaforth Mineral & Ore Co. Inc, British Fluorspar Ltd, China Kings Resources Group Co. Ltd. and Mongolrostsvetmet LLC. |
| Key Market Opportunities | · Rising Demand for Fluorine-Based Battery Materials · Expansion of Fluoropolymers in High-Performance Industries |
| Key Market Drivers | · Rising Demand for Hydrofluoric Acid (HF) Production · Increasing Use in Lithium-Ion Battery Production |
REPORT CONTENT BRIEF:
- High-level analysis of the current and future Fluorite Market trends and opportunities
- Detailed analysis of current market drivers, restraining factors, and opportunities in the future
- Fluorite Market historical market size for the year 2021, and forecast from 2023 to 2033
- Fluorite Market share analysis at each product level
- Competitor analysis with detailed insight into its product segment, Government & Defense strength, and strategies adopted.
- Identifies key strategies adopted including product launches and developments, mergers and acquisitions, joint ventures, collaborations, and partnerships as well as funding taken and investment done, among others.
- To identify and understand the various factors involved in the global Fluorite Market affected by the pandemic
- To provide a detailed insight into the major companies operating in the market. The profiling will include the Government & Defense health of the company’s past 2-3 years with segmental and regional revenue breakup, product offering, recent developments, SWOT analysis, and key strategies.
Frequently Asked Questions (FAQ)
What is the growth rate of the global Fluorite Market?
The global Fluorite Market is growing at a CAGR of 5.26% over the next 10 years
Which region has the highest growth rate in the market of Fluorite Market?
Asia Pacific is expected to register the highest CAGR during 2023-2033
Which region has the largest share of the global Fluorite Market?
North America holds the largest share in 2022
Who are the key players in the global Fluorite Market?
Tertiary Minerals Plc, Mexichem S.A.B. de C.V, Masan Group, Centralfluor Industries Group Inc., Kenya Fluorspar Company Ltd., MINERSA GROUP, Seaforth Mineral & Ore Co. Inc, British Fluorspar Ltd, China Kings Resources Group Co. Ltd. and Mongolrostsvetmet LLC. are the major companies operating in the market.
Do you offer Post Sale Support?
Yes, we offer 16 hours of analyst support to solve the queries
Do you sell particular sections of a report?
Yes, we provide regional as well as country-level reports. Other than this we also provide a sectional report. Please get in contact with our sales representatives.
Press Release

Global Pharmaceutical Manufacturing Market to Reach $1.38 Trillion by 2035 with 7.35% CAGR, New Research Shows
The Global Mammography Market Is Estimated To Record a CAGR of Around 10.29% During The Forecast Period
Glue Stick Market to Reach USD 2.35 Billion by 2034
Podiatry Service Market to Reach USD 11.88 Billion by 2034
Microfluidics Technology Market to Reach USD 32.58 Billion by 2034
Ferric Chloride Market to Reach USD 10.65 Billion by 2034
Family Practice EMR Software Market to Reach USD 21.52 Billion by 2034
Electric Hairbrush Market to Reach USD 15.95 Billion by 2034
Daily Bamboo Products Market to Reach USD 143.52 Billion by 2034
Cross-border E-commerce Logistics Market to Reach USD 112.65 Billion by 2034
Table of Contents
CHAPTER 1. Executive Summary
CHAPTER 2. Scope of the Study
2.1. Market Definition
2.2. Market Scope & Segmentation
2.2.1. Objective of Report
CHAPTER 3. Evolve BI Methodology
3.1. Data Collection & Validation Approach
3.2. Market Size Estimation and Forecast
CHAPTER 4. Exclusive Analysis
4.1. Market Opportunity Score
4.1.1. Form Segement – Market Opportunity Score
4.1.2. Application Segment – Market Opportunity Score
4.1.3. End Use Segment – Market Opportunity Score
4.2. Key Market Influencing Indicators
CHAPTER 5. Market Insights and Trends
5.1. Value Chain Analysis
5.1.1. Raw Material
5.1.2. Manufacturing Process
5.1.3. Distribution Channel
5.1.4. End User
5.2. Porter’s Five Forces Analysis
5.2.1. Bargaining Power of Buyers
5.2.2. Bargaining Power of Suppliers
5.2.3. Threat of New Entrant
5.2.4. Threat of Substitute
5.2.5. Industry Rivalry
5.3. COVID-19 Impact and Post COVID Scenario on Fluorite Market
5.3.1. Impact of COVID-19
5.3.2. Government Support and Industry Revival Policies
5.3.3. Measures Taken by Companies to Mitigate Negative Impact
5.3.4. Post COVID Trend
CHAPTER 6. Market Dynamics
6.1. Introduction
6.2. Drivers
6.2.1. Driver 1
6.2.2. Driver 2
6.2.3. Driver 3
6.3. Restraints
6.3.1. Restraint 1
6.3.2. Restraint 2
6.4. Opportunity
6.4.1. Opportunity 1
CHAPTER 7. Fluorite Market, By Form
7.1. Introduction
7.1.1. Powder
7.1.2 Lump
7.1.3 Filter Cake
CHAPTER 8 Fluorite Market, By Application
8.1. Introduction
8.1.1. Acid Spar
8.1.2. Met Spar
8.1.3. Ceramic Spar
CHAPTER 9. Fluorite Market, By End Use
9.1. Introduction
9.1.1. Metallurgy, Chemical, Ceramic, Optical, and Electrical & Electronics
9.1.2. Oil & Gas
9.1.3. Aerospace
9.1.4. Automotive
9.1.5. Manufacturing
9.1.6 Others
CHAPTER 10. Fluorite Market, By Region
10.1. Introduction
10.2. NORTH AMERICA
10.2.1. North America: Market Size and Forecast, By Country, 2024 – 2034($ Million)
10.2.2. North America: Market Size and Forecast, By Form, 2024 – 2034($ Million)
10.2.3. North America: Market Size and Forecast, By Application, 2024 – 2034($ Million)
10.2.4. North America: Market Size and Forecast, By End Use, 2024 – 2034($ Million)
10.2.5. US
10.2.5.1. US: Market Size and Forecast, By Form, 2024 – 2034($ Million)
10.2.5.2. US: Market Size and Forecast, By Application, 2024 – 2034($ Million)
10.2.5.3. US: Market Size and Forecast, By End Use, 2024 – 2034($ Million)
10.2.6. CANADA
10.2.6.1. Canada: Market Size and Forecast, By Form, 2024 – 2034($ Million)
10.2.6.2. Canada: Market Size and Forecast, By Application, 2024 – 2034($ Million)
10.2.6.3. Canada: Market Size and Forecast, By End Use, 2024 – 2034($ Million)
10.2.7. MEXICO
10.2.7.1. Mexico: Market Size and Forecast, By Form, 2024 – 2034($ Million)
10.2.7.2. Mexico: Market Size and Forecast, By Application, 2024 – 2034($ Million)
10.2.7.3. Mexico: Market Size and Forecast, By End Use, 2024 – 2034($ Million)
10.3. Europe
10.3.1. Europe: Market Size and Forecast, By Country, 2024 – 2034($ Million)
10.3.2. Europe: Market Size and Forecast, By Form, 2024 – 2034($ Million)
10.3.3. Europe: Market Size and Forecast, By Application, 2024 – 2034($ Million)
10.3.4. Europe: Market Size and Forecast, By End Use, 2024 – 2034($ Million)
10.3.5. U.K.
10.3.5.1. U.K.: Market Size and Forecast, By Form, 2024 – 2034($ Million)
10.3.5.2. U.K.: Market Size and Forecast, By Application, 2024 – 2034($ Million)
10.3.5.3. U.K.: Market Size and Forecast, By End Use, 2024 – 2034($ Million)
10.3.6. GERMANY
10.3.6.1. Germany: Market Size and Forecast, By Form, 2024 – 2034($ Million)
10.3.6.2. Germany: Market Size and Forecast, By Application, 2024 – 2034($ Million)
10.3.6.3. Germany: Market Size and Forecast, By End Use, 2024 – 2034($ Million)
10.3.7. FRANCE
10.3.7.1. France: Market Size and Forecast, By Service Type, 2024 – 2034($ Million)
10.3.7.2. France: Market Size and Forecast, By Application, 2024 – 2034($ Million)
10.3.7.3. France: Market Size and Forecast, By End Use, 2024 – 2034($ Million)
10.3.8. ITALY
10.3.8.1. Italy: Market Size and Forecast, By Form, 2024 – 2034($ Million)
10.3.8.2. Italy: Market Size and Forecast, By Application, 2024 – 2034($ Million)
10.3.8.3. Italy: Market Size and Forecast, By End Use, 2024 – 2034($ Million)
10.3.9. SPAIN
10.3.9.1. Spain: Market Size and Forecast, By Form, 2024 – 2034($ Million)
10.3.9.2. Spain: Market Size and Forecast, By Application, 2024 – 2034($ Million)
10.3.9.3. Spain: Market Size and Forecast, By End Use, 2024 – 2034($ Million)
10.3.10. BENELUX
10.3.10.1. BeNeLux: Market Size and Forecast, By Form, 2024 – 2034($ Million)
10.3.10.2. BeNeLux: Market Size and Forecast, By Application, 2024 – 2034($ Million)
10.3.10.3. BeNeLux: Market Size and Forecast, By End Use, 2024 – 2034($ Million)
10.3.11. RUSSIA
10.3.11.1. Russia: Market Size and Forecast, By Form, 2024 – 2034($ Million)
10.3.11.2. Russia: Market Size and Forecast, By Application, 2024 – 2034($ Million)
10.3.11.3. Russia: Market Size and Forecast, By End Use, 2024 – 2034($ Million)
10.3.12. REST OF EUROPE
10.3.12.1. Rest of Europe: Market Size and Forecast, By Form, 2024 – 2034($ Million)
10.3.12.2. Rest of Europe: Market Size and Forecast, By Application, 2024 – 2034($ Million)
10.3.12.3. Rest of Europe: Market Size and Forecast, By End User, 2024 – 2034($ Million)
10.4. Asia Pacific
10.4.1. Asia Pacific: Market Size and Forecast, By Country, 2024 – 2034($ Million)
10.4.2. Asia Pacific: Market Size and Forecast, By Form, 2024 – 2034($ Million)
10.4.3. Asia Pacific: Market Size and Forecast, By Application, 2024 – 2034($ Million)
10.4.4. Asia Pacific: Market Size and Forecast, By End Use, 2024 – 2034($ Million)
10.4.5. CHINA
10.4.5.1. China: Market Size and Forecast, By Form, 2024 – 2034($ Million)
10.4.5.2. China: Market Size and Forecast, By Application, 2024 – 2034($ Million)
10.4.5.3. China: Market Size and Forecast, By End Use, 2024 – 2034($ Million)
10.4.6. JAPAN
10.4.6.1. Japan: Market Size and Forecast, By Service Form, 2024 – 2034($ Million)
10.4.6.2. Japan: Market Size and Forecast, By Application, 2024 – 2034($ Million)
10.4.6.3. Japan: Market Size and Forecast, By End Use, 2024 – 2034($ Million)
10.4.7. INDIA
10.4.7.1. India: Market Size and Forecast, By Form, 2024 – 2034($ Million)
10.4.7.2. India: Market Size and Forecast, By Application, 2024 – 2034($ Million)
10.4.7.3. India: Market Size and Forecast, By End Use, 2024 – 2034($ Million)
10.4.8. SOUTH KOREA
10.4.8.1. South Korea: Market Size and Forecast, By Form, 2024 – 2034($ Million)
10.4.8.2. South Korea: Market Size and Forecast, By Application, 2024 – 2034($ Million)
10.4.8.3. South Korea: Market Size and Forecast, By End Use, 2024 – 2034($ Million)
10.4.9. THAILAND
10.4.9.1. Thailand: Market Size and Forecast, By Form, 2024 – 2034($ Million)
10.4.9.2. Thailand: Market Size and Forecast, By Application, 2024 – 2034($ Million)
10.4.9.3. Thailand: Market Size and Forecast, By End Use, 2024 – 2034($ Million)
10.4.10. INDONESIA
10.4.10.1. Indonesia: Market Size and Forecast, By Form, 2024 – 2034($ Million)
10.4.10.2. Indonesia: Market Size and Forecast, By Application, 2024 – 2034($ Million)
10.4.10.3. Indonesia: Market Size and Forecast, By End Use, 2024 – 2034($ Million)
10.4.11. MALAYSIA
10.4.11.1. Malaysia: Market Size and Forecast, By Form, 2024 – 2034($ Million)
10.4.11.2. Malaysia: Market Size and Forecast, By Application, 2024 – 2034($ Million)
10.4.11.3. Malaysia: Market Size and Forecast, By End Use, 2024 – 2034($ Million)
10.4.12. AUSTRALIA
10.4.12.1. Australia: Market Size and Forecast, By Form, 2024 – 2034($ Million)
10.4.12.2. Australia: Market Size and Forecast, By Application, 2024 – 2034($ Million)
10.4.12.3. Australia: Market Size and Forecast, By End Use, 2024 – 2034($ Million)
10.4.13. REST FO ASIA PACIFIC
10.4.13.1. Rest fo Asia Pacific: Market Size and Forecast, By Form, 2024 – 2034($ Million)
10.4.13.2. Rest fo Asia Pacific: Market Size and Forecast, By Application, 2024 – 2034($ Million)
10.4.13.3. Rest fo Asia Pacific: Market Size and Forecast, By End Use, 2024 – 2034($ Million)
10.5. South America
10.5.1. South America: Market Size and Forecast, By Country, 2024 – 2034($ Million)
10.5.2. South America: Market Size and Forecast, By Form, 2024 – 2034($ Million)
10.5.3. South America: Market Size and Forecast, By System, 2024 – 2034($ Million)
10.5.4. South America: Market Size and Forecast, By End Use, 2024 – 2034($ Million)
10.5.5. BRAZIL
10.5.5.1. Brazil: Market Size and Forecast, By Form, 2024 – 2034($ Million)
10.5.5.2. Brazil: Market Size and Forecast, By Application, 2024 – 2034($ Million)
10.5.5.3. Brazil: Market Size and Forecast, By End Use, 2024 – 2034($ Million)
10.5.6. ARGENTINA
10.5.6.1. Argentina: Market Size and Forecast, By Form, 2024 – 2034($ Million)
10.5.6.2. Argentina: Market Size and Forecast, By Application, 2024 – 2034($ Million)
10.5.6.3. Argentina: Market Size and Forecast, By End Use, 2024 – 2034($ Million)
10.5.7. REST OF SOUTH AMERICA
10.5.7.1. Rest of South America: Market Size and Forecast, By Form, 2024 – 2034($ Million)
10.5.7.2. Rest of South America: Market Size and Forecast, By Application, 2024 – 2034($ Million)
10.5.7.3. Rest of South America: Market Size and Forecast, By End Use, 2024 – 2034($ Million)
10.6. Middle East & Africa
10.6.1. Middle East & Africa: Market Size and Forecast, By Country, 2024 – 2034($ Million)
10.6.2. Middle East & Africa: Market Size and Forecast, By Form, 2024 – 2034($ Million)
10.6.3. Middle East & Africa: Market Size and Forecast, By Application, 2024 – 2034($ Million)
10.6.4. Middle East & Africa: Market Size and Forecast, By End Use, 2024 – 2034($ Million)
10.6.5. SAUDI ARABIA
10.6.5.1. Saudi Arabia: Market Size and Forecast, By Form, 2024 – 2034($ Million)
10.6.5.2. Saudi Arabia: Market Size and Forecast, By Application, 2024 – 2034($ Million)
10.6.5.3. Saudi Arabia: Market Size and Forecast, By End Use, 2024 – 2034($ Million)
10.6.6. UAE
10.6.6.1. UAE: Market Size and Forecast, By Form, 2024 – 2034($ Million)
10.6.6.2. UAE: Market Size and Forecast, By Application, 2024 – 2034($ Million)
10.6.6.3. UAE: Market Size and Forecast, By End Use, 2024 – 2034($ Million)
10.6.7. EGYPT
10.6.7.1. Egypt: Market Size and Forecast, By Form, 2024 – 2034($ Million)
10.6.7.2. Egypt: Market Size and Forecast, By Application, 2024 – 2034($ Million)
10.6.7.3. Egypt: Market Size and Forecast, By End Use, 2024 – 2034($ Million)
10.6.8. SOUTH AFRICA
10.6.8.1. South Africa: Market Size and Forecast, By Form, 2024 – 2034($ Million)
10.6.8.2. South Africa: Market Size and Forecast, By Application, 2024 – 2034($ Million)
10.6.8.3. South Africa: Market Size and Forecast, By End Use, 2024 – 2034($ Million)
10.6.9. REST OF MIDDLE EAST & AFRICA
10.6.9.1. Rest of Middle East & Africa: Market Size and Forecast, By Form, 2024 – 2034($ Million)
10.6.9.2. Rest of Middle East & Africa: Market Size and Forecast, By Application, 2024 – 2034($ Million)
10.6.9.3.Rest of Middle East & Africa: Market Size and Forecast, By End Use, 2024 – 2034($ Million)
CHAPTER 12. Competitive Landscape
12.1. Competitior Benchmarking 2023-
12.2. Market Share Analysis
12.3. Key Developments Analysis By Top 5 Companies
12.4. Market Share Acquisition Strategies: Analysis of Key Approaches Employed by Top Players
CHAPTER 13. Company Profiles
13.1. Tertiary Minerals Plc
13.1.1. Hanon Systems
13.1.2. Financial Analysis
13.1.2.1. Business Segment Revenue, 2020, 2021, 2022, $ Million
13.1.2.2. Geographic Revenue Mix, 2022 (% Share)
13.1.3. Product Portfolio
13.1.4. Recent Development and Strategies Adopted
13.1.5. SWOT Analysis
13.2. Mexichem S.A.B. de C.V
13.3. Masan Group
13.4. Centralfluor Industries Group Inc.
13.5. Kenya Fluorspar Company Ltd.
13.6. MINERSA GROUP
13.7. Seaforth Mineral & Ore Co. Inc
13.8. British Fluorspar Ltd
13.9 China Kings Resources Group Co. Ltd.
13.10 Mongolrostsvetmet LLC.
Connect To Analyst
Research Methodology

Our Most Viewed Report and gain instant expertise


Compressed air dryer market Analysis and Global Forecast 2024-2034

Exterior insulation and finish system (EIFS) Market Analysis and Global Forecast 2023-2033

Fireproofing Material Market Analysis and Global Forecast 2023-2033
Global Corrugated Pallets Market Analysis and Global Forecast 2023-2033

HVAC Pump Market Analysis and Global Forecast 2024-2034


