Fluid Milk Market Analysis and Global Forecast 2023-2033
$ 1,390.00 – $ 5,520.00Price range: $ 1,390.00 through $ 5,520.00
Fluid Milk Market Research Report: By Source (Cow Milk, Ship Milk, Goat Milk, Buffalo Milk), By Type (Whole Milk, Low-fat Milk, Reduced-fat Milk, Skim-Milk, Cultured Buttermilk, Lactose-Free Milk, Flavored Milk), By Application (Fortified Milk, Flavored Dairy Drinks, Yoghurts, Cheese, Creams, Frozen Desserts), and by Region — Forecast till 2033
Fluid Milk Market Overview
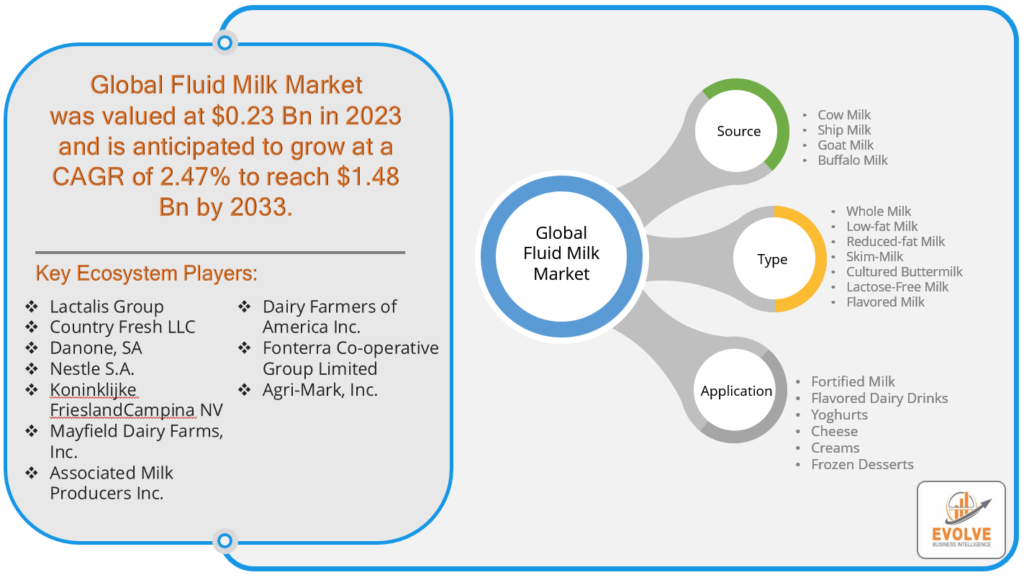
The Fluid Milk Market Size is expected to reach USD 1.48 Billion by 2033. The Fluid Milk industry size accounted for USD 0.23 Billion in 2023 and is expected to expand at a CAGR of 2.47% from 2023 to 2033. Fluid milk refers to liquid milk in its natural state, as opposed to processed or powdered forms. It is the raw, unaltered product obtained from the mammary glands of mammals, primarily cows in the context of commercial consumption. Fluid milk includes various varieties such as whole milk, skim milk, and low-fat or reduced-fat milk, each differing in fat content. Consumed as a beverage, poured over cereals, or used in cooking and baking, fluid milk is a rich source of essential nutrients such as calcium, vitamin D, and protein. The term distinguishes liquid milk from other dairy products derived from milk, like cheese or yogurt, which undergo processing or fermentation.
Global Fluid Milk Market Synopsis
The Fluid Milk market experienced a moderate impact during the COVID-19 pandemic, marked by a complex interplay of challenges and opportunities. Disruptions in supply chains, workforce limitations, and changes in consumer behavior contributed to fluctuations in production and distribution. While the closure of restaurants and food service establishments led to a decline in bulk purchases, there was an offsetting increase in retail sales as consumers stocked up on essentials. The pandemic underscored the importance of a resilient and adaptable supply chain for dairy producers. Additionally, with a heightened focus on health and nutrition during the pandemic, some consumers turned to fluid milk as a source of essential nutrients, mitigating the overall impact on the market. Overall, the Fluid Milk market navigated through the challenges posed by the pandemic, highlighting the industry’s ability to adapt to evolving circumstances.
Global Fluid Milk Market Dynamics
The major factors that have impacted the growth of Fluid Milk are as follows:
Drivers:
⮚     Health and Wellness Trends
The Fluid Milk market is the growing emphasis on health and wellness. As consumers increasingly prioritize nutritious and functional food choices, fluid milk, known for its rich content of essential nutrients like calcium, vitamin D, and protein, aligns well with these trends. The perception of milk as a wholesome and natural source of nutrients has driven consumer interest, particularly in segments such as organic or fortified milk products.
Restraint:
- Competition from Plant-Based Alternatives
The increasing competition from plant-based milk alternatives. The rise in popularity of plant-based beverages derived from sources such as soy, almond, or oat poses a challenge to traditional dairy products. Changing consumer preferences, driven by factors like lactose intolerance, environmental concerns, and ethical considerations, have led to a shift in demand toward non-dairy alternatives, impacting the market for fluid milk.
Opportunity:
⮚     Innovation and Product Diversification
An opportunity for the Fluid Milk market lies in innovation and product diversification. The introduction of new flavors, formulations, and packaging options can attract a broader consumer base. Additionally, the development of value-added products, such as lactose-free or protein-enriched milk, can cater to specific dietary needs and preferences, opening avenues for market expansion and meeting the evolving demands of a diverse consumer base.
Fluid Milk Market Segment Overview
By Source
Based on the Source, the market is segmented based on Cow Milk, Ship Milk, Goat Milk, and Buffalo Milk. The Cow Milk segment was anticipated to lead the Fluid Milk market due to its longstanding popularity, widespread consumer acceptance, and its status as a primary source of traditional dairy products, offering a familiar and nutritionally rich choice for a broad consumer base globally. Despite the rise of alternative milk products, cow milk maintains a dominant position in the market due to its essential nutrients and versatile applications in various culinary and nutritional contexts.
By Type
Based on the Type, the market has been divided into Whole Milk, Low-fat Milk, Reduced-fat Milk, skim milk, Cultured Buttermilk, Lactose-Free Milk, and Flavored Milk. The Whole Milk segment is expected to dominate the Fluid Milk market, primarily driven by consumer preferences for full-fat dairy products and the growing recognition of the health benefits associated with whole milk, including its role in providing essential nutrients and satiety, contributing to a resurgence in demand for this traditional and unprocessed milk variant.
By Application
Based on Application, the market has been divided into Fortified Milk, Flavored Dairy Drinks, Yoghurts, Cheese, Creams, and Frozen Desserts. The Fortified Milk segment is positioned to capture the largest market share in the Fluid Milk market, fueled by rising consumer awareness of nutritional enrichment, demand for functional foods, and the incorporation of vitamins, minerals, and other supplements in fortified milk, aligning with the growing focus on health and wellness among consumers globally.
Global Fluid Milk Market Regional Analysis
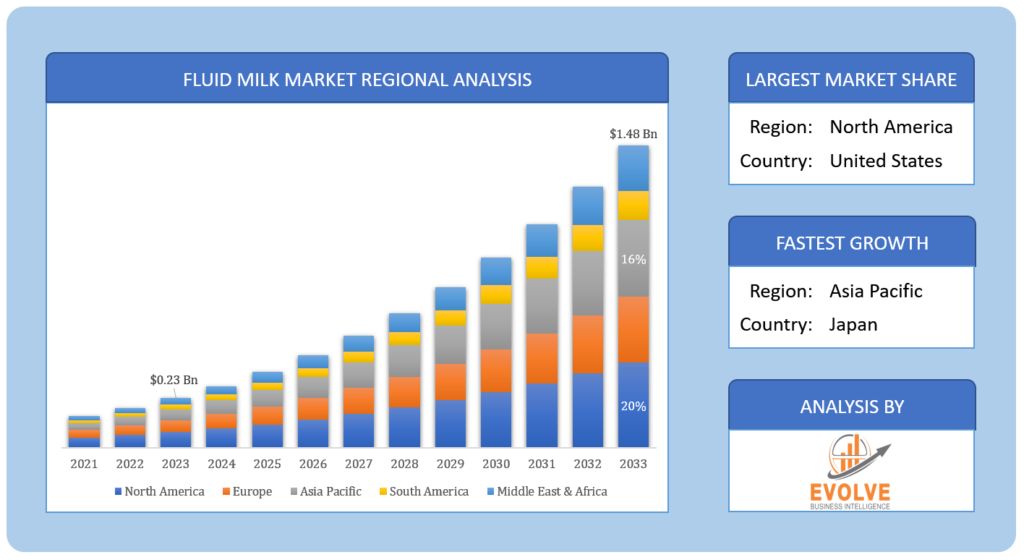
Based on region, the market has been divided into North America, Europe, Asia-Pacific, the Middle East & Africa, and Latin America. The area of North America is anticipated to dominate the market for the usage of Fluid Milk, followed by those in Asia-Pacific and Europe.
Fluid Milk North America Market
North America asserts dominance in the Fluid Milk market as a region characterized by well-established dairy industries, robust production capabilities, and a high level of consumer demand. The region’s dominance is evident in its widespread consumption of fluid milk products, with a preference for diverse variants like whole milk, skim milk, and specialty products. The market leadership is further driven by a strong dairy farming infrastructure, advanced processing technologies, and a cultural affinity for dairy consumption. Additionally, evolving consumer trends, including a focus on health and wellness, have prompted innovations such as lactose-free and organic milk options.
Fluid Milk Asia Pacific Market
The Asia-Pacific region has witnessed remarkable growth in the Fluid Milk market, fueled by a combination of population growth, rising disposable incomes, and increasing awareness of the nutritional benefits associated with dairy consumption. As urbanization and lifestyle changes shape consumer preferences, there has been a surge in demand for convenient and nutritious food options, including fluid milk. The adoption of Western dietary habits, coupled with a growing middle class, has led to an increased consumption of traditional and value-added milk products. Additionally, innovative packaging, marketing strategies, and the introduction of fortified and flavored milk variants have contributed to the expansion of the Fluid Milk market in the Asia-Pacific region, positioning it as a key driver of global growth in the dairy industry.
Competitive Landscape
The competitive landscape includes key players (tier 1, tier 2, and local) having a presence across the globe. Companies such as Associated Milk Producers Inc., Dairy Farmers of America Inc., Fonterra Co-operative Group Limited, and Agri-Mark Inc. are some of the leading players in the global  Fluid Milk Industry. These players have adopted partnership, acquisition, expansion, and new product development, among others as their key strategies.
Key Market Players:
- Lactalis Group
- Country Fresh LLC
- Danone, SA
- Nestle S.A.
- Koninklijke FrieslandCampina NV
- Mayfield Dairy Farms, Inc
- Associated Milk Producers Inc.
- Dairy Farmers of America Inc
- Fonterra Co-operative Group Limited
- Agri-Mark, Inc
Scope of the Report
Global Fluid Milk Market, by Source
- Cow Milk
- Ship Milk
- Goat Milk
- Buffalo Milk
Global Fluid Milk Market, by Type
- Whole Milk
- Low-fat Milk
- Reduced-fat Milk
- Skim-Milk
- Cultured Buttermilk
- Lactose-Free Milk
- Flavored Milk
Global Fluid Milk Market, by Application
- Fortified Milk
- Flavored Dairy Drinks
- Yogurts
- Cheese
- Creams
- Frozen Desserts
Global Fluid Milk Market, by Region
- North America
- US
- Canada
- Mexico
- Europe
- UK
- Germany
- France
- Italy
- Spain
- Benelux
- Nordic
- Rest of Europe
- Asia Pacific
- China
- Japan
- South Korea
- Indonesia
- Austalia
- Malaysia
- India
- Rest of Asia Pacific
- South America
- Brazil
- Argentina
- Rest of South America
- Middle East & Africa
- Saudi Arabia
- UAE
- Egypt
- South Africa
- Rest of Middle East & Africa
| Parameters | Indicators |
|---|---|
| Market Size | 2033: $1.48 Billion |
| CAGR | 2.47% CAGR (2023-2033) |
| Base year | 2022 |
| Forecast Period | 2023-2033 |
| Historical Data | 2021 |
| Report Coverage | Revenue Forecast, Competitive Landscape, Growth Factors, and Trends |
| Key Segmentations | Product Type, Distribution Channel |
| Geographies Covered | North America, Europe, Asia-Pacific, Latin America, Middle East, Africa |
| Key Vendors | Lactalis Group, Country Fresh LLC, Danone, SA, Nestle S.A., Koninklijke FrieslandCampina NV, Mayfield Dairy Farms, Inc., Associated Milk Producers Inc., Dairy Farmers of America Inc., Fonterra Co-operative Group Limited, Agri-Mark, Inc. |
| Key Market Opportunities | • Product Diversification and Innovation |
| Key Market Drivers | • Health and Nutrition Trends |
REPORT CONTENT BRIEF:
- High-level analysis of the current and future Fluid Milk Industry trends and opportunities
- Detailed analysis of current market drivers, restraining factors, and opportunities analysis in the future
- Historical market size for the year 2021, and forecast from 2023 to 2033
- Fluid Milk market share analysis for each segment
- Competitor analysis with a comprehensive insight into its product segment, financial strength, and strategies adopted.
- Identifies key strategies adopted by the key players including new product development, mergers and acquisitions, joint ventures, collaborations, and partnerships.
- To identify and understand the various factors involved in the global Fluid Milk market affected by the pandemic
- To provide year-on-year growth from 2022 to 2033
- To provide short-term, long-term, and overall CAGR comparison from 2022 to 2033.
- Provide Total Addressable Market (TAM) for the Global Fluid Milk Market.
Press Release

Global Pharmaceutical Manufacturing Market to Reach $1.38 Trillion by 2035 with 7.35% CAGR, New Research Shows

The Global Mammography Market Is Estimated To Record a CAGR of Around 10.29% During The Forecast Period

Glue Stick Market to Reach USD 2.35 Billion by 2034

Podiatry Service Market to Reach USD 11.88 Billion by 2034

Microfluidics Technology Market to Reach USD 32.58 Billion by 2034

Ferric Chloride Market to Reach USD 10.65 Billion by 2034

Family Practice EMR Software Market to Reach USD 21.52 Billion by 2034

Electric Hairbrush Market to Reach USD 15.95 Billion by 2034

Daily Bamboo Products Market to Reach USD 143.52 Billion by 2034

Cross-border E-commerce Logistics Market to Reach USD 112.65 Billion by 2034
Frequently Asked Questions (FAQ)
What is the study period of the Fluid Milk Market?
The study period covers historical data from 2021 and forecasts for the years 2023 to 2033.
What is the growth rate of the Fluid Milk Market?
The Fluid Milk market is projected to expand at a compound annual growth rate (CAGR) of 2.47% from 2023 to 2033.
Which region has the highest growth rate in the Fluid Milk Market?
The Asia-Pacific region is expected to experience the highest growth rate in the Fluid Milk market, driven by factors such as population growth, rising disposable incomes, and increasing awareness of nutritional benefits.
Which region has the largest share of the Fluid Milk Market?
Currently, North America holds the largest share in the Fluid Milk market due to its well-established dairy industries, robust production capabilities, and high consumer demand.
Who are the key players in the Fluid Milk Market?
Key players in the Fluid Milk market include Lactalis Group, Country Fresh LLC, Danone SA, Nestle S.A., Koninklijke FrieslandCampina NV, Mayfield Dairy Farms Inc., Associated Milk Producers Inc., Dairy Farmers of America Inc., Fonterra Co-operative Group Limited, and Agri-Mark Inc., among others.
Do you offer Post sales support?
Yes, we offer 16 hours of analyst support to solve the queries
Do you sell particular sections of a report?
Yes, we provide regional as well as country-level reports. Other than this we also provide a sectional report. Please get in contact with our sales representatives.
Table of Content
CHAPTER 1. Executive Summary CHAPTER 2. Scope of the Study 2.1. Market Definition 2.2. Market Scope & Segmentation 2.2.1. Objective of Report CHAPTER 3. Evolve BI Methodology 3.1. Data Collection & Validation Approach 3.2. Market Size Estimation and Forecast CHAPTER 4. Exclusive Analysis 4.1. Market Opportunity Score 4.1.1. Source Segement – Market Opportunity Score 4.1.2. Type Segment – Market Opportunity Score 4.1.3. Application Segment – Market Opportunity Score 4.2. Key Market Influencing Indicators CHAPTER 5. Market Insights and Trends 5.1. Value Chain Analysis 5.1.1. Raw Material 5.1.2. Manufacturing Process 5.1.3. Distribution Channel 5.1.4. End User 5.2. Porter’s Five Forces Analysis 5.2.1. Bargaining Power of Buyers 5.2.2. Bargaining Power of Suppliers 5.2.3. Threat of New Entrant 5.2.4. Threat of Substitute 5.2.5. Industry Rivalry 5.3. COVID-19 Impact and Post COVID Scenario on Fluid Milk Market 5.3.1. Impact of COVID-19 5.3.2. Government Support and Industry Revival Policies 5.3.3. Measures Taken by Companies to Mitigate Negative Impact 5.3.4. Post COVID Trend CHAPTER 6. MArket Dynamics 6.1. Introduction 6.2. Drivers 6.2.1. Driver 1 6.2.2. Driver 2 6.2.3. Driver 3 6.3. Restraints 6.3.1. Restraint 1 6.3.2. Restraint 2 6.4. Opportunity 6.4.1. Opportunity 1 CHAPTER 7. Global Fluid Milk Market, By Source 7.1. Introduction 7.1.1. Cow Milk 7.1.2. Ship Milk 7.1.3. Goat Milk 7.1.4. Buffalo Milk CHAPTER 8. Global Fluid Milk Market, By Type 8.1. Introduction 8.1.1. Whole Milk 8.1.2. Low-fat Milk 8.1.3. Reduced-fat Milk 8.1.4. Skim-Milk 8.1.5. Cultured Buttermilk 8.1.6. Lactose-Free Milk 8.1.7. Flavored Milk CHAPTER 9. Global Fluid Milk Market, By Application 9.1. Introduction 9.1.1. Fortified Milk 9.1.2. Flavored Dairy Drinks 9.1.3. Yogurts 9.1.4. Cheese 9.1.5. Creams 9.1.6. Frozen Desserts CHAPTER 10. Global Fluid Milk Market, By Region 10.1. Introduction 10.2. NORTH AMERICA 10.2.1. North America: Market Size and Forecast, By Country, 2023 – 2033 ($ Million) 10.2.2. North America: Market Size and Forecast, By Source, 2023 – 2033 ($ Million) 10.2.3. North America: Market Size and Forecast, By Type, 2023 – 2033 ($ Million) 10.2.4. North America: Market Size and Forecast, By Application, 2023 – 2033 ($ Million) 10.2.5. US 10.2.5.1. US: Market Size and Forecast, By Source, 2023 – 2033 ($ Million) 10.2.5.2. US: Market Size and Forecast, By Type, 2023 – 2033 ($ Million) 10.2.5.3. US: Market Size and Forecast, By Application, 2023 – 2033 ($ Million) 10.2.6. CANADA 10.2.6.1. Canada: Market Size and Forecast, By Source, 2023 – 2033 ($ Million) 10.2.6.2. Canada: Market Size and Forecast, By Type, 2023 – 2033 ($ Million) 10.2.6.3. Canada: Market Size and Forecast, By Application, 2023 – 2033 ($ Million) 10.2.7. MEXICO 10.2.7.1. Mexico: Market Size and Forecast, By Source, 2023 – 2033 ($ Million) 10.2.7.2. Mexico: Market Size and Forecast, By Type, 2023 – 2033 ($ Million) 10.2.7.3. Mexico: Market Size and Forecast, By Application, 2023 – 2033 ($ Million) 10.3. Europe 10.3.1. Europe: Market Size and Forecast, By Country, 2023 – 2033 ($ Million) 10.3.2. Europe: Market Size and Forecast, By Source, 2023 – 2033 ($ Million) 10.3.3. Europe: Market Size and Forecast, By Type, 2023 – 2033 ($ Million) 10.3.4. Europe: Market Size and Forecast, By Application, 2023 – 2033 ($ Million) 10.3.5. U.K. 10.3.5.1. U.K.: Market Size and Forecast, By Source, 2023 – 2033 ($ Million) 10.3.5.2. U.K.: Market Size and Forecast, By Type, 2023 – 2033 ($ Million) 10.3.5.3. U.K.: Market Size and Forecast, By Application, 2023 – 2033 ($ Million) 10.3.6. GERMANY 10.3.6.1. Germany: Market Size and Forecast, By Source, 2023 – 2033 ($ Million) 10.3.6.2. Germany: Market Size and Forecast, By Type, 2023 – 2033 ($ Million) 10.3.6.3. Germany: Market Size and Forecast, By Application, 2023 – 2033 ($ Million) 10.3.7. FRANCE 10.3.7.1. France: Market Size and Forecast, By Source, 2023 – 2033 ($ Million) 10.3.7.2. France: Market Size and Forecast, By Type, 2023 – 2033 ($ Million) 10.3.7.3. France: Market Size and Forecast, By Application, 2023 – 2033 ($ Million) 10.3.8. ITALY 10.3.8.1. Italy: Market Size and Forecast, By Source, 2023 – 2033 ($ Million) 10.3.8.2. Italy: Market Size and Forecast, By Type, 2023 – 2033 ($ Million) 10.3.8.3. Italy: Market Size and Forecast, By Application, 2023 – 2033 ($ Million) 10.3.9. SPAIN 10.3.9.1. Spain: Market Size and Forecast, By Source, 2023 – 2033 ($ Million) 10.3.9.2. Spain: Market Size and Forecast, By Type, 2023 – 2033 ($ Million) 10.3.9.3. Spain: Market Size and Forecast, By Application, 2023 – 2033 ($ Million) 10.3.10. BENELUX 10.3.10.1. BeNeLux: Market Size and Forecast, By Source, 2023 – 2033 ($ Million) 10.3.10.2. BeNeLux: Market Size and Forecast, By Type, 2023 – 2033 ($ Million) 10.3.10.3. BeNeLux: Market Size and Forecast, By Application, 2023 – 2033 ($ Million) 10.3.11. RUSSIA 10.3.11.1. Russia: Market Size and Forecast, By Source, 2023 – 2033 ($ Million) 10.3.11.2. Russia: Market Size and Forecast, By Type, 2023 – 2033 ($ Million) 10.3.11.3. Russia: Market Size and Forecast, By Application, 2023 – 2033 ($ Million) 10.3.12. REST OF EUROPE 10.3.12.1. Rest of Europe: Market Size and Forecast, By Source, 2023 – 2033 ($ Million) 10.3.12.2. Rest of Europe: Market Size and Forecast, By Type, 2023 – 2033 ($ Million) 10.3.12.3. Rest of Europe: Market Size and Forecast, By Application, 2023 – 2033 ($ Million) 10.4. Asia Pacific 10.4.1. Asia Pacific: Market Size and Forecast, By Country, 2023 – 2033 ($ Million) 10.4.2. Asia Pacific: Market Size and Forecast, By Source, 2023 – 2033 ($ Million) 10.4.3. Asia Pacific: Market Size and Forecast, By Type, 2023 – 2033 ($ Million) 10.4.4. Asia Pacific: Market Size and Forecast, By Application, 2023 – 2033 ($ Million) 10.4.5. CHINA 10.4.5.1. China: Market Size and Forecast, By Source, 2023 – 2033 ($ Million) 10.4.5.2. China: Market Size and Forecast, By Type, 2023 – 2033 ($ Million) 10.4.5.3. China: Market Size and Forecast, By Application, 2023 – 2033 ($ Million) 10.4.6. JAPAN 10.4.6.1. Japan: Market Size and Forecast, By Source, 2023 – 2033 ($ Million) 10.4.6.2. Japan: Market Size and Forecast, By Type, 2023 – 2033 ($ Million) 10.4.6.3. Japan: Market Size and Forecast, By Application, 2023 – 2033 ($ Million) 10.4.7. INDIA 10.4.7.1. India: Market Size and Forecast, By Source, 2023 – 2033 ($ Million) 10.4.7.2. India: Market Size and Forecast, By Type, 2023 – 2033 ($ Million) 10.4.7.3. India: Market Size and Forecast, By Application, 2023 – 2033 ($ Million) 10.4.8. SOUTH KOREA 10.4.8.1. South Korea: Market Size and Forecast, By Source, 2023 – 2033 ($ Million) 10.4.8.2. South Korea: Market Size and Forecast, By Type, 2023 – 2033 ($ Million) 10.4.8.3. South Korea: Market Size and Forecast, By Application, 2023 – 2033 ($ Million) 10.4.9. THAILAND 10.4.9.1. Thailand: Market Size and Forecast, By Source, 2023 – 2033 ($ Million) 10.4.9.2. Thailand: Market Size and Forecast, By Type, 2023 – 2033 ($ Million) 10.4.9.3. Thailand: Market Size and Forecast, By Application, 2023 – 2033 ($ Million) 10.4.10. INDONESIA 10.4.10.1. Indonesia: Market Size and Forecast, By Source, 2023 – 2033 ($ Million) 10.4.10.2. Indonesia: Market Size and Forecast, By Type, 2023 – 2033 ($ Million) 10.4.10.3. Indonesia: Market Size and Forecast, By Application, 2023 – 2033 ($ Million) 10.4.11. MALAYSIA 10.4.11.1. Malaysia: Market Size and Forecast, By Source, 2023 – 2033 ($ Million) 10.4.11.2. Malaysia: Market Size and Forecast, By Type, 2023 – 2033 ($ Million) 10.4.11.3. Malaysia: Market Size and Forecast, By Application, 2023 – 2033 ($ Million) 10.4.12. AUSTRALIA 10.4.12.1. Australia: Market Size and Forecast, By Source, 2023 – 2033 ($ Million) 10.4.12.2. Australia: Market Size and Forecast, By Type, 2023 – 2033 ($ Million) 10.4.12.3. Australia: Market Size and Forecast, By Application, 2023 – 2033 ($ Million) 10.4.13. REST FO ASIA PACIFIC 10.4.13.1. Rest fo Asia Pacific: Market Size and Forecast, By Source, 2023 – 2033 ($ Million) 10.4.13.2. Rest fo Asia Pacific: Market Size and Forecast, By Type, 2023 – 2033 ($ Million) 10.4.13.3. Rest fo Asia Pacific: Market Size and Forecast, By Application, 2023 – 2033 ($ Million) 10.5. South America 10.5.1. South America: Market Size and Forecast, By Country, 2023 – 2033 ($ Million) 10.5.2. South America: Market Size and Forecast, By Source, 2023 – 2033 ($ Million) 10.5.3. South America: Market Size and Forecast, By Type, 2023 – 2033 ($ Million) 10.5.4. South America: Market Size and Forecast, By Application, 2023 – 2033 ($ Million) 10.5.5. BRAZIL 10.5.5.1. Brazil: Market Size and Forecast, By Source, 2023 – 2033 ($ Million) 10.5.5.2. Brazil: Market Size and Forecast, By Type, 2023 – 2033 ($ Million) 10.5.5.3. Brazil: Market Size and Forecast, By Application, 2023 – 2033 ($ Million) 10.5.6. ARGENTINA 10.5.6.1. Argentina: Market Size and Forecast, By Source, 2023 – 2033 ($ Million) 10.5.6.2. Argentina: Market Size and Forecast, By Type, 2023 – 2033 ($ Million) 10.5.6.3. Argentina: Market Size and Forecast, By Application, 2023 – 2033 ($ Million) 10.5.7. REST OF SOUTH AMERICA 10.5.7.1. Rest of South America: Market Size and Forecast, By Source, 2023 – 2033 ($ Million) 10.5.7.2. Rest of South America: Market Size and Forecast, By Type, 2023 – 2033 ($ Million) 10.5.7.3. Rest of South America: Market Size and Forecast, By Application, 2023 – 2033 ($ Million) 10.6. Middle East & Africa 10.6.1. Middle East & Africa: Market Size and Forecast, By Country, 2023 – 2033 ($ Million) 10.6.2. Middle East & Africa: Market Size and Forecast, By Source, 2023 – 2033 ($ Million) 10.6.3. Middle East & Africa: Market Size and Forecast, By Type, 2023 – 2033 ($ Million) 10.6.4. Middle East & Africa: Market Size and Forecast, By Application, 2023 – 2033 ($ Million) 10.6.5. SAUDI ARABIA 10.6.5.1. Saudi Arabia: Market Size and Forecast, By Source, 2023 – 2033 ($ Million) 10.6.5.2. Saudi Arabia: Market Size and Forecast, By Type, 2023 – 2033 ($ Million) 10.6.5.3. Saudi Arabia: Market Size and Forecast, By Application, 2023 – 2033 ($ Million) 10.6.6. UAE 10.6.6.1. UAE: Market Size and Forecast, By Source, 2023 – 2033 ($ Million) 10.6.6.2. UAE: Market Size and Forecast, By Type, 2023 – 2033 ($ Million) 10.6.6.3. UAE: Market Size and Forecast, By Application, 2023 – 2033 ($ Million) 10.6.7. EGYPT 10.6.7.1. Egypt: Market Size and Forecast, By Source, 2023 – 2033 ($ Million) 10.6.7.2. Egypt: Market Size and Forecast, By Type, 2023 – 2033 ($ Million) 10.6.7.3. Egypt: Market Size and Forecast, By Application, 2023 – 2033 ($ Million) 10.6.8. SOUTH AFRICA 10.6.8.1. South Africa: Market Size and Forecast, By Source, 2023 – 2033 ($ Million) 10.6.8.2. South Africa: Market Size and Forecast, By Type, 2023 – 2033 ($ Million) 10.6.8.3. South Africa: Market Size and Forecast, By Application, 2023 – 2033 ($ Million) 10.6.9. REST OF MIDDLE EAST & AFRICA 10.6.9.1. Rest of Middle East & Africa: Market Size and Forecast, By Source, 2023 – 2033 ($ Million) 10.6.9.2. Rest of Middle East & Africa: Market Size and Forecast, By Type, 2023 – 2033 ($ Million) 10.6.9.3. Rest of Middle East & Africa: Market Size and Forecast, By Application, 2023 – 2033 ($ Million) CHAPTER 12. Competitive Landscape 12.1. Competitior Benchmarking 2023 12.2. Market Share Analysis 12.3. Key Developments Analysis By Top 5 Companies 12.4. Market Share Acquisition Strategies: Analysis of Key Approaches Employed by Top Players CHAPTER 13. Company Profiles 13.1. Lactalis Group 13.1.1. Business Overview 13.1.2. Financial Analysis 13.1.2.1. Business Segment Revenue, 2020, 2021, 2022, $ Million 13.1.2.2. Geographic Revenue Mix, 2022 (% Share) 13.1.3. Product Portfolio 13.1.4. Recent Development and Strategies Adopted 13.1.5. SWOT Analysis 13.2. Country Fresh LLC 13.3. Danone 13.4. Nestle S.A. 13.5. Koninklijke FrieslandCampina NV 13.6. Mayfield Dairy Farms, Inc 13.7. Associated Milk Producers Inc 13.8. Dairy Farmers of America Inc. 13.9. Fonterra Co-operative Group Limited 13.10. Agri-Mark, Inc.
Connect to Analyst
Research Methodology