Counter-UAS Market Analysis and Global Forecast (2023-2033) with COVID Impact Analysis
Price range: $ 1,390.00 through $ 5,520.00
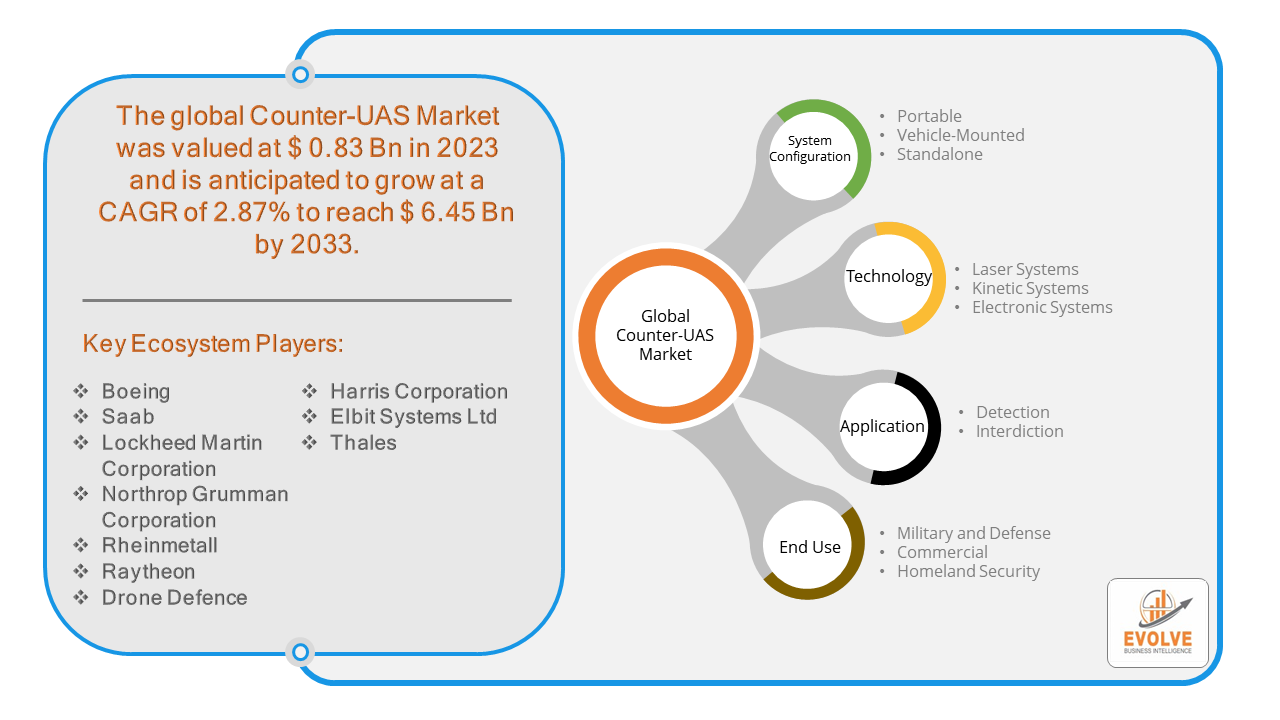
Counter-UAS Market Research Report: Information By System Configuration (Portable, Vehicle-Mounted, Standalone), By Technology (Laser Systems, Kinetic Systems, Electronic Systems), By Application (Detection, Interdiction), By End Use (Military and Defense, Commercial, Homeland Security), and by Region — Forecast till 2033
Page: 177
Counter-UAS Market Overview
The Counter-UAS Market Size is expected to reach USD 6.45 Billion by 2033. The Counter-UAS Market industry size accounted for USD 0.83 Billion in 2023 and is expected to expand at a compound annual growth rate (CAGR) of 2.87% from 2023 to 2033. The Counter-UAS (Unmanned Aerial Systems) Market refers to the industry involved in developing and deploying technologies designed to detect, track, identify, and mitigate unauthorized or malicious drone activities. This market encompasses a range of solutions such as radar systems, radio frequency (RF) detectors, electro-optical and infrared (EO/IR) sensors, jamming devices, and command and control systems. The increasing proliferation of drones in both civilian and military applications has driven the growth of the Counter-UAS market to address concerns related to security, privacy, and safety from potential drone threats.
The Counter-UAS market is a rapidly evolving field, and new technologies are being developed all the time. As the threat from drones continues to grow, the demand for counter-UAS systems is expected to remain high.
Global Counter-UAS Market Synopsis
 COVID-19 Impact Analysis
The COVID-19 pandemic had a mixed impact on the Counter-UAS (Unmanned Aerial Systems) market. Like many industries, the Counter-UAS market initially faced disruptions in manufacturing, supply chains, and deployment due to lockdowns, restrictions on movement, and workforce limitations. During the pandemic, there were reports of drones being misused, which heightened security concerns globally. This increased awareness and need for enhanced counter-UAS technologies to protect sensitive areas and critical infrastructure. The pandemic highlighted vulnerabilities in various sectors such as healthcare, logistics, and public safety, driving increased interest in deploying counter-UAS technologies to protect against unauthorized drone activities that could disrupt operations or compromise security.
Counter-UAS Market Dynamics
The major factors that have impacted the growth of Counter-UAS Market are as follows:
Drivers:
Ø Technological Advancements
Innovations in radar systems, RF detectors, EO/IR sensors, and jamming technologies are enhancing the capabilities of counter-UAS systems, making them more effective in detecting and mitigating drone threats. High-profile incidents involving drones, such as disruptions at airports or breaches of sensitive facilities, highlight the vulnerabilities and underscore the need for robust counter-UAS measures. Beyond defense and security, industries like energy, transportation, and entertainment are exploring counter-UAS technologies to protect assets, infrastructure, and public safety from potential drone-related risks. The global nature of drone threats and the need for standardized security measures across borders are driving international collaboration and adoption of counter-UAS solutions.
Restraint:
- Perception of Technological limitations and Cost
Counter-UAS systems are still under development, and there are limitations to their effectiveness. For instance, some systems may be vulnerable to spoofing or jamming by the drones themselves, and they might not perform well in all weather conditions. Counter-UAS systems can be expensive to purchase, install, and maintain. This can be a major barrier to adoption for some potential users, particularly for smaller organizations or those with limited budgets. Some people are concerned about the potential safety risks of counter-UAS systems, such as the possibility of accidentally harming innocent people or interfering with other electronic devices. These concerns can lead to delays in approvals and public resistance to deployment.
Opportunity:
⮚ Integration of Multi-Layered Solutions
Integrating various technologies such as radar, RF detection, EO/IR sensors, and jamming systems into cohesive, multi-layered defense solutions presents a promising opportunity. This approach can provide comprehensive coverage against a wide range of drone threats and scenarios, catering to diverse customer needs across defense, critical infrastructure protection, event security, and more. Increasing global security concerns related to terrorism, unauthorized surveillance, and the protection of sensitive facilities and events drive the demand for robust counter-UAS solutions. Governments and organizations worldwide are investing in enhancing their capabilities to mitigate drone-related threats, creating a favorable market environment for advanced counter-UAS technologies.
Counter-UAS Market Segment Overview
By System Configuration
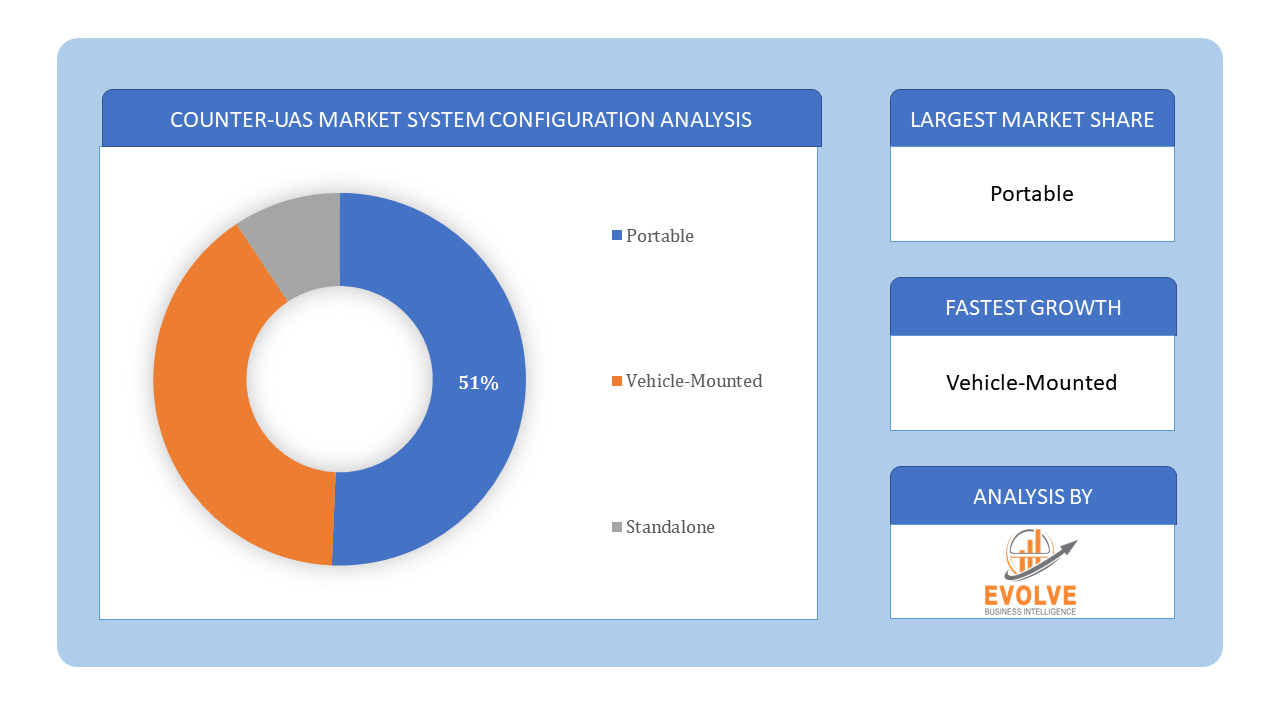 Based on System Configuration, the market is segmented based on Portable, Vehicle-Mounted and Standalone. The portable segment dominant the market. Counter unmanned aircraft systems (Counter UAS) that are portable in nature are designed for quick deployment to detect and neutralize unauthorized drones in the field. These systems generally comprise modular components that can be rapidly assembled and disassembled, making them highly adaptable and transportable for use in diverse operational environments. Portable Counter UAS systems may integrate various sensors, including radar, cameras, and radio-frequency (RF) detectors to identify and track drones.
By Technology
Based on Technology, the market segment has been divided into the Laser Systems, Kinetic Systems and Electronic Systems. The laser system segment dominant the market. Counter unmanned aircraft systems (Counter UAS) are increasingly incorporating laser systems as a means of neutralizing rogue drones. These systems utilize high-energy lasers to physically disable or destroy drones in mid-flight. Laser-based Counter UAS systems generally operate by tracking drones with sensors, such as radar or cameras, and then directing the laser beam towards the target.
By Application
Based on Application, the market segment has been divided into the Detection and Interdiction. The detection segment is Dominant the market. Counter UAS systems are being integrated with other defense and security systems, such as radar, communication networks, and surveillance systems, to create a comprehensive defense strategy. Cybersecurity measures are also being incorporated into the development of these systems to prevent unauthorized access or control of drones.
By End Use
Based on End Use, the market segment has been divided into the Military and Defense, Commercial and Homeland Security. The military & defense segment dominant the market. Counter unmanned aircraft systems (Counter UAS) have become a key area of focus for military and defense sectors. These systems are specifically designed to safeguard military personnel, critical infrastructure, and other high-value assets from potential threats posed by drones. Military-grade Counter UAS systems typically incorporate a variety of sensors such as radar, radiofrequency (RF) detectors, and cameras to detect and track drones. They may also integrate more advanced technologies such as laser systems or electronic countermeasures to disable or neutralize unauthorized drones.
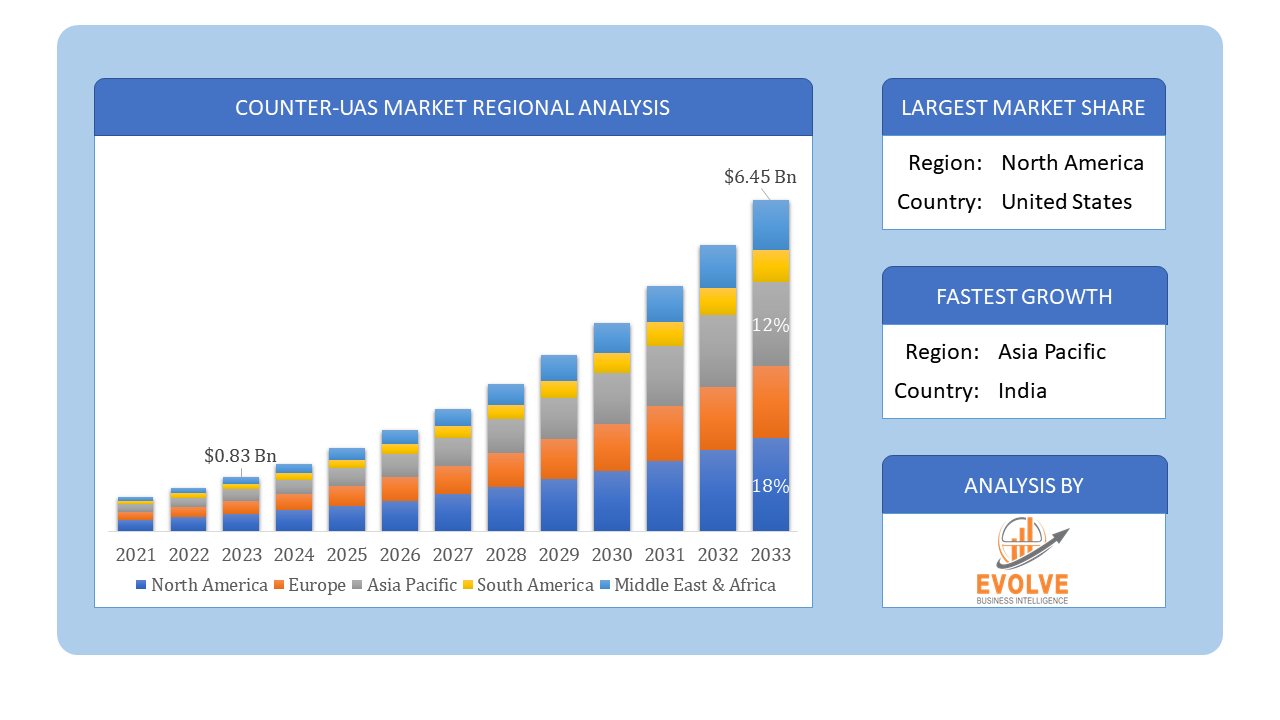
Global Counter-UAS Market Regional Analysis
Based on region, the global Counter-UAS Market has been divided into North America, Europe, Asia-Pacific, the Middle East & Africa, and Latin America. North America is projected to dominate the use of the Counter-UAS Market followed by the Asia-Pacific and Europe regions.
 North America Market
North America holds a dominant position in the Counter-UAS Market. North America dominates the Counter-UAS market due to significant investments in defense and homeland security. The region’s advanced technological capabilities and stringent regulatory frameworks drive the adoption of sophisticated counter-UAS solutions.
Asia-Pacific Market
The Asia-Pacific region has indeed emerged as the fastest-growing market for the Counter-UAS Market industry. The Asia-Pacific region is experiencing rapid growth in the Counter-UAS market, fueled by increasing defense spending, rising security threats, and the proliferation of drones in commercial and industrial sectors. Countries like China, India, and Japan are key contributors to market growth.
Competitive Landscape
The global Counter-UAS Market is highly competitive, with numerous players offering a wide range of software Solutions. The competitive landscape is characterized by the presence of established companies, as well as emerging startups and niche players. To increase their market position and attract a wide consumer base, the businesses are employing various strategies, such as product launches, and strategic alliances.
Prominent Players:
- Boeing
- Saab
- Lockheed Martin Corporation
- Northrop Grumman Corporation
- Rheinmetall
- Raytheon
- Drone Defence
- Harris Corporation
- Elbit Systems Ltd
- Thales
Key Development
In February 2023, South Korea’s top defense firm, Hanwha Aerospace, announced an investment in Fortem Technologies, a U.S. airspace security firm.
In November 2022, Northrop Grumman’s short-range counter-drone command and control capability has completed a live-fire test for the US Army at Yuma Proving Ground, Arizona. Scope of the Report
Global Counter-UAS Market, by System Configuration
- Portable
- Vehicle-Mounted
- Standalone
Global Counter-UAS Market, by Technology
- Laser Systems
- Kinetic Systems
- Electronic Systems
Global Counter-UAS Market, by Application
- Detection
- Interdiction
Global Counter-UAS Market, by End Use
- Military and Defense
- Commercial
- Homeland Security
Global Counter-UAS Market, by Region
- North America
- US
- Canada
- Mexico
- Europe
- UK
- Germany
- France
- Italy
- Spain
- Benelux
- Nordic
- Rest of Europe
- Asia Pacific
- China
- Japan
- South Korea
- Indonesia
- Austalia
- Malaysia
- India
- Rest of Asia Pacific
- South America
- Brazil
- Argentina
- Rest of South America
- Middle East & Africa
- Saudi Arabia
- UAE
- Egypt
- South Africa
- Rest of Middle East & Africa
| Parameters | Indicators |
|---|---|
| Market Size | 2033: $6.45 Billion/strong> |
| CAGR | 2.87% CAGR (2023-2033) |
| Base year | 2022 |
| Forecast Period | 2023-2033 |
| Historical Data | 2021 |
| Report Coverage | Revenue Forecast, Competitive Landscape, Growth Factors, and Trends |
| Key Segmentations | System Configuration, Technology, Application, End Use |
| Geographies Covered | North America, Europe, Asia-Pacific, Latin America, Middle East, Africa |
| Key Vendors | Boeing, Saab, Lockheed Martin Corporation, Northrop Grumman Corporation, Rheinmetall, Raytheon, Drone Defence, Harris Corporation, Elbit Systems Ltd and Thales |
| Key Market Opportunities | • Integration of Multi-Layered Solutions • Global Security Concerns |
| Key Market Drivers | • Technological Advancements • Commercial Applications and Global Adoption |
REPORT CONTENT BRIEF:
- High-level analysis of the current and future Counter-UAS Market trends and opportunities
- Detailed analysis of current market drivers, restraining factors, and opportunities in the future
- Counter-UAS Market historical market size for the year 2021, and forecast from 2023 to 2033
- Counter-UAS Market share analysis at each product level
- Competitor analysis with detailed insight into its product segment, Government & Defense strength, and strategies adopted.
- Identifies key strategies adopted including product launches and developments, mergers and acquisitions, joint ventures, collaborations, and partnerships as well as funding taken and investment done, among others.
- To identify and understand the various factors involved in the global Counter-UAS Market affected by the pandemic
- To provide a detailed insight into the major companies operating in the market. The profiling will include the Government & Defense health of the company’s past 2-3 years with segmental and regional revenue breakup, product offering, recent developments, SWOT analysis, and key strategies.
Frequently Asked Questions (FAQ)
2.What is the growth rate of the global Counter-UAS Market?
- The global Counter-UAS Market is growing at a CAGR of 2.87% over the next 10 years
3.Which region has the highest growth rate in the market of Counter-UAS Market?
- Asia Pacific is expected to register the highest CAGR during 2023-2033
4.Which region has the largest share of the global Counter-UAS Market?
- North America holds the largest share in 2022
5.Who are the key players in the global Counter-UAS Market?
Boeing, Saab, Lockheed Martin Corporation, Northrop Grumman Corporation, Rheinmetall, Raytheon, Drone Defence, Harris Corporation, Elbit Systems Ltd and Thales. are the major companies operating in the market
6.Do you offer Post Sale Support?
- Yes, we offer 16 hours of analyst support to solve the queries
7.Do you sell particular sections of a report?
Yes, we provide regional as well as country-level reports. Other than this we also provide a sectional report. Please get in contact with our sales representatives
Press Release

Global Pharmaceutical Manufacturing Market to Reach $1.38 Trillion by 2035 with 7.35% CAGR, New Research Shows
The Global Mammography Market Is Estimated To Record a CAGR of Around 10.29% During The Forecast Period
Glue Stick Market to Reach USD 2.35 Billion by 2034
Podiatry Service Market to Reach USD 11.88 Billion by 2034
Microfluidics Technology Market to Reach USD 32.58 Billion by 2034
Ferric Chloride Market to Reach USD 10.65 Billion by 2034
Family Practice EMR Software Market to Reach USD 21.52 Billion by 2034
Electric Hairbrush Market to Reach USD 15.95 Billion by 2034
Daily Bamboo Products Market to Reach USD 143.52 Billion by 2034
Cross-border E-commerce Logistics Market to Reach USD 112.65 Billion by 2034
Table of Content
CHAPTER 1. Executive Summary CHAPTER 2. Scope of the Study 2.1. Market Definition 2.2. Market Scope & Segmentation 2.2.1. Objective of Report CHAPTER 3. Evolve BI Methodology 3.1. Data Collection & Validation Approach 3.2. Market Size Estimation and Forecast CHAPTER 4. Exclusive Analysis 4.1. Market Opportunity Score 4.1.1. System Configuration Segement – Market Opportunity Score 4.1.2. Technology Segment – Market Opportunity Score 4.1.3. Application Segment – Market Opportunity Score 4.1.4. End Use Segment – Market Opportunity Score 4.2. Key Market Influencing Indicators CHAPTER 5. Market Insights and Trends 5.1. Value Chain Analysis 5.1.1. Raw Material 5.1.2. Manufacturing Process 5.1.3. Distribution Channel 5.1.4. End Users 5.2. Porter’s Five Forces Analysis 5.2.1. Bargaining Power of Buyers 5.2.2. Bargaining Power of Suppliers 5.2.3. Threat of New Entrant 5.2.4. Threat of Substitute 5.2.5. Industry Rivalry 5.3. COVID-19 Impact and Post COVID Scenario on Counter-UAS Market 5.3.1. Impact of COVID-19 5.3.2. Government Support and Industry Revival Policies 5.3.3. Measures Taken by Companies to Mitigate Negative Impact 5.3.4. Post COVID Trend CHAPTER 6. MArket Dynamics 6.1. Introduction 6.2. Drivers 6.2.1. Driver 1 6.2.2. Driver 2 6.2.3. Driver 3 6.3. Restraints 6.3.1. Restraint 1 6.3.2. Restraint 2 6.4. Opportunity 6.4.1. Opportunity 1 CHAPTER 7. Counter-UAS Market, By System Configuration 7.1. Introduction 7.1.1. Portable 7.1.2. Vehicle-Mounted 7.1.3. Standalone CHAPTER 8. Counter-UAS Market, By Technology 8.1. Introduction 8.1.1. Laser Systems 8.1.2. Kinetic Systems 8.1.3. Electronic Systems CHAPTER 9. Counter-UAS Market, By Application 9.1. Introduction 9.1.1. Detection 9.1.2. Interdiction CHAPTER 10. Counter-UAS Market, By End Use 10.1.Introduction 10.1.1. Military and Defense 10.1.2. Commercial 10.1.3. Homeland Security sCHAPTER 11. Counter-UAS Market, By Region 11.1. Introduction 11.2. NORTH AMERICA 11.2.1. North America: Market Size and Forecast, By Country, 2023 – 2033 ($ Million) 11.2.2. North America: Market Size and Forecast, By System Configuration, 2023 – 2033 ($ Million) 11.2.3. North America: Market Size and Forecast, By Technology, 2023 – 2033 ($ Million) 11.2.4. North America: Market Size and Forecast, By Application, 2023 – 2033 ($ Million) 11.2.5. North America: Market Size and Forecast, By End Use, 2023 – 2033 ($ Million) 11.2.6. US 11.2.6.1. US: Market Size and Forecast, By System Configuration, 2023 – 2033 ($ Million) 11.2.6.2. US: Market Size and Forecast, By Technology, 2023 – 2033 ($ Million) 11.2.6.3. US: Market Size and Forecast, By Application, 2023 – 2033 ($ Million) 11.2.6.4. US: Market Size and Forecast, By End Use, 2023 – 2033 ($ Million) 11.2.7. CANADA 11.2.7.1. Canada: Market Size and Forecast, By System Configuration, 2023 – 2033 ($ Million) 11.2.7.2. Canada: Market Size and Forecast, By Technology, 2023 – 2033 ($ Million) 11.2.7.3. Canada: Market Size and Forecast, By Application, 2023 – 2033 ($ Million) 11.2.7.4. Canada: Market Size and Forecast, By End Use, 2023 – 2033 ($ Million) 11.2.8. MEXICO 11.2.8.1. Mexico: Market Size and Forecast, By System Configuration, 2023 – 2033 ($ Million) 11.2.8.2. Mexico: Market Size and Forecast, By Technology, 2023 – 2033 ($ Million) 11.2.8.3. Mexico: Market Size and Forecast, By Application, 2023 – 2033 ($ Million) 11.2.8.4. Mexico: Market Size and Forecast, By End Use, 2023 – 2033 ($ Million) 11.3. Europe 11.3.1. Europe: Market Size and Forecast, By Country, 2023 – 2033 ($ Million) 11.3.2. Europe: Market Size and Forecast, By System Configuration, 2023 – 2033 ($ Million) 11.3.3. Europe: Market Size and Forecast, By Technology, 2023 – 2033 ($ Million) 11.3.4. Europe: Market Size and Forecast, By Application, 2023 – 2033 ($ Million) 11.3.5. Europe: Market Size and Forecast, By End Use, 2023 – 2033 ($ Million) 11.3.6. U.K. 11.3.6.1. U.K.: Market Size and Forecast, By System Configuration, 2023 – 2033 ($ Million) 11.3.6.2. U.K.: Market Size and Forecast, By Technology, 2023 – 2033 ($ Million) 11.3.6.3. U.K.: Market Size and Forecast, By Application, 2023 – 2033 ($ Million) 11.3.6.4. U.K.: Market Size and Forecast, By End Use, 2023 – 2033 ($ Million) 11.3.7. GERMANY 11.3.7.1. Germany: Market Size and Forecast, By System Configuration, 2023 – 2033 ($ Million) 11.3.7.2. Germany: Market Size and Forecast, By Technology, 2023 – 2033 ($ Million) 11.3.7.3. Germany: Market Size and Forecast, By Application, 2023 – 2033 ($ Million) 11.3.7.4. Germany: Market Size and Forecast, By End Use, 2023 – 2033 ($ Million) 11.3.8. FRANCE 11.3.8.1. France: Market Size and Forecast, By System Configuration, 2023 – 2033 ($ Million) 11.3.8.2. France: Market Size and Forecast, By Technology, 2023 – 2033 ($ Million) 11.3.8.3. France: Market Size and Forecast, By Application, 2023 – 2033 ($ Million) 11.3.8.4. France: Market Size and Forecast, By End Use, 2023 – 2033 ($ Million) 11.3.9. ITALY 11.3.9.1. Italy: Market Size and Forecast, By System Configuration, 2023 – 2033 ($ Million) 11.3.9.2. Italy: Market Size and Forecast, By Technology, 2023 – 2033 ($ Million) 11.3.9.3. Italy: Market Size and Forecast, By Application, 2023 – 2033 ($ Million) 11.3.9.4. Italy: Market Size and Forecast, By End Use, 2023 – 2033 ($ Million) 11.3.10. SPAIN 11.3.10.1. Spain: Market Size and Forecast, By System Configuration, 2023 – 2033 ($ Million) 11.3.10.2. Spain: Market Size and Forecast, By Technology, 2023 – 2033 ($ Million) 11.3.10.3. Spain: Market Size and Forecast, By Application, 2023 – 2033 ($ Million) 11.3.10.4. Spain: Market Size and Forecast, By End Use, 2023 – 2033 ($ Million) 11.3.11. BENELUX 11.3.11.1. BeNeLux: Market Size and Forecast, By System Configuration, 2023 – 2033 ($ Million) 11.3.11.2. BeNeLux: Market Size and Forecast, By Technology, 2023 – 2033 ($ Million) 11.3.11.3. BeNeLux: Market Size and Forecast, By Application, 2023 – 2033 ($ Million) 11.3.11.4. BeNeLux: Market Size and Forecast, By End Use, 2023 – 2033 ($ Million) 11.3.12. RUSSIA 11.3.12.1. Russia: Market Size and Forecast, By System Configuration, 2023 – 2033 ($ Million) 11.3.12.2. Russia: Market Size and Forecast, By Technology, 2023 – 2033 ($ Million) 11.3.12.3. Russia: Market Size and Forecast, By Application, 2023 – 2033 ($ Million) 11.3.12.4. Russia: Market Size and Forecast, By End Use, 2023 – 2033 ($ Million) 11.3.13. REST OF EUROPE 11.3.13.1. Rest of Europe: Market Size and Forecast, By System Configuration, 2023 – 2033 ($ Million) 11.3.13.2. Rest of Europe: Market Size and Forecast, By Technology, 2023 – 2033 ($ Million) 11.3.13.3. Rest of Europe: Market Size and Forecast, By Application, 2023 – 2033 ($ Million) 11.3.13.4. Rest of Europe: Market Size and Forecast, By End Use, 2023 – 2033 ($ Million) 11.4. Asia Pacific 11.4.1. Asia Pacific: Market Size and Forecast, By Country, 2023 – 2033 ($ Million) 11.4.2. Asia Pacific: Market Size and Forecast, By System Configuration, 2023 – 2033 ($ Million) 11.4.3. Asia Pacific: Market Size and Forecast, By Technology, 2023 – 2033 ($ Million) 11.4.4. Asia Pacific: Market Size and Forecast, By Application, 2023 – 2033 ($ Million) 11.4.5. Asia Pacific: Market Size and Forecast, By End Use, 2023 – 2033 ($ Million) 11.4.6. CHINA 11.4.6.1. China: Market Size and Forecast, By System Configuration, 2023 – 2033 ($ Million) 11.4.6.2. China: Market Size and Forecast, By Technology, 2023 – 2033 ($ Million) 11.4.6.3. China: Market Size and Forecast, By Application, 2023 – 2033 ($ Million) 11.4.6.4. China: Market Size and Forecast, By End Use, 2023 – 2033 ($ Million) 11.4.7. JAPAN 11.4.7.1. Japan: Market Size and Forecast, By System Configuration, 2023 – 2033 ($ Million) 11.4.7.2. Japan: Market Size and Forecast, By Technology, 2023 – 2033 ($ Million) 11.4.7.3. Japan: Market Size and Forecast, By Application, 2023 – 2033 ($ Million) 11.4.7.4. Japan: Market Size and Forecast, By End Use, 2023 – 2033 ($ Million) 11.4.8. INDIA 11.4.8.1. India: Market Size and Forecast, By System Configuration, 2023 – 2033 ($ Million) 11.4.8.2. India: Market Size and Forecast, By Technology, 2023 – 2033 ($ Million) 11.4.8.3. India: Market Size and Forecast, By Application, 2023 – 2033 ($ Million) 11.4.8.4. India: Market Size and Forecast, By End Use, 2023 – 2033 ($ Million) 11.4.9. SOUTH KOREA 11.4.9.1. South Korea: Market Size and Forecast, By System Configuration, 2023 – 2033 ($ Million) 11.4.9.2. South Korea: Market Size and Forecast, By Technology, 2023 – 2033 ($ Million) 11.4.9.3. South Korea: Market Size and Forecast, By Application, 2023 – 2033 ($ Million) 11.4.9.4. South Korea: Market Size and Forecast, By End Use, 2023 – 2033 ($ Million) 11.4.10. THAILAND 11.4.10.1. Thailand: Market Size and Forecast, By System Configuration, 2023 – 2033 ($ Million) 11.4.10.2. Thailand: Market Size and Forecast, By Technology, 2023 – 2033 ($ Million) 11.4.10.3. Thailand: Market Size and Forecast, By Application, 2023 – 2033 ($ Million) 11.4.10.4. Thailand: Market Size and Forecast, By End Use, 2023 – 2033 ($ Million) 11.4.11. INDONESIA 11.4.11.1. Indonesia: Market Size and Forecast, By System Configuration, 2023 – 2033 ($ Million) 11.4.11.2. Indonesia: Market Size and Forecast, By Technology, 2023 – 2033 ($ Million) 11.4.11.3. Indonesia: Market Size and Forecast, By Application, 2023 – 2033 ($ Million) 11.4.11.4. Indonesia: Market Size and Forecast, By End Use, 2023 – 2033 ($ Million) 11.4.12. MALAYSIA 11.4.12.1. Malaysia: Market Size and Forecast, By System Configuration, 2023 – 2033 ($ Million) 11.4.12.2. Malaysia: Market Size and Forecast, By Technology, 2023 – 2033 ($ Million) 11.4.12.3. Malaysia: Market Size and Forecast, By Application, 2023 – 2033 ($ Million) 11.4.12.4. Malaysia: Market Size and Forecast, By End Use, 2023 – 2033 ($ Million) 11.4.13. AUSTRALIA 11.4.13.1. Australia: Market Size and Forecast, By System Configuration, 2023 – 2033 ($ Million) 11.4.13.2. Australia: Market Size and Forecast, By Technology, 2023 – 2033 ($ Million) 11.4.13.3. Australia: Market Size and Forecast, By Application, 2023 – 2033 ($ Million) 11.4.13.4. Australia: Market Size and Forecast, By End Use, 2023 – 2033 ($ Million) 11.4.14. REST FO ASIA PACIFIC 11.4.14.1. Rest fo Asia Pacific: Market Size and Forecast, By System Configuration, 2023 – 2033 ($ Million) 11.4.14.2. Rest fo Asia Pacific: Market Size and Forecast, By Technology, 2023 – 2033 ($ Million) 11.4.14.3. Rest fo Asia Pacific: Market Size and Forecast, By Application, 2023 – 2033 ($ Million) 11.4.14.4. Rest fo Asia Pacific: Market Size and Forecast, By End Use, 2023 – 2033 ($ Million) 11.5. South America 11.5.1. South America: Market Size and Forecast, By Country, 2023 – 2033 ($ Million) 11.5.2. South America: Market Size and Forecast, By System Configuration, 2023 – 2033 ($ Million) 11.5.3. South America: Market Size and Forecast, By Technology, 2023 – 2033 ($ Million) 11.5.4. South America: Market Size and Forecast, By Application, 2023 – 2033 ($ Million) 11.5.5. South America: Market Size and Forecast, By End Use, 2023 – 2033 ($ Million) 11.5.6. BRAZIL 11.5.6.1. Brazil: Market Size and Forecast, By System Configuration, 2023 – 2033 ($ Million) 11.5.6.2. Brazil: Market Size and Forecast, By Technology, 2023 – 2033 ($ Million) 11.5.6.3. Brazil: Market Size and Forecast, By Application, 2023 – 2033 ($ Million) 11.5.6.4. Brazil: Market Size and Forecast, By End Use, 2023 – 2033 ($ Million) 11.5.7. ARGENTINA 11.5.7.1. Argentina: Market Size and Forecast, By System Configuration, 2023 – 2033 ($ Million) 11.5.7.2. Argentina: Market Size and Forecast, By Technology, 2023 – 2033 ($ Million) 11.5.7.3. Argentina: Market Size and Forecast, By Application, 2023 – 2033 ($ Million) 11.5.7.4. Argentina: Market Size and Forecast, By End Use, 2023 – 2033 ($ Million) 11.5.8. REST OF SOUTH AMERICA 11.5.8.1. Rest of South America: Market Size and Forecast, By System Configuration, 2023 – 2033 ($ Million) 11.5.8.2. Rest of South America: Market Size and Forecast, By Technology, 2023 – 2033 ($ Million) 11.5.8.3. Rest of South America: Market Size and Forecast, By Application, 2023 – 2033 ($ Million) 11.5.8.4. Rest of South America: Market Size and Forecast, By End Use, 2023 – 2033 ($ Million) 11.6. Middle East & Africa 11.6.1. Middle East & Africa: Market Size and Forecast, By Country, 2023 – 2033 ($ Million) 11.6.2. Middle East & Africa: Market Size and Forecast, By System Configuration, 2023 – 2033 ($ Million) 11.6.3. Middle East & Africa: Market Size and Forecast, By Technology, 2023 – 2033 ($ Million) 11.6.4. Middle East & Africa: Market Size and Forecast, By Application, 2023 – 2033 ($ Million) 11.6.5. Middle East & Africa: Market Size and Forecast, By End Use, 2023 – 2033 ($ Million) 11.6.6. SAUDI ARABIA 11.6.6.1. Saudi Arabia: Market Size and Forecast, By System Configuration, 2023 – 2033 ($ Million) 11.6.6.2. Saudi Arabia: Market Size and Forecast, By Technology, 2023 – 2033 ($ Million) 11.6.6.3. Saudi Arabia: Market Size and Forecast, By Application, 2023 – 2033 ($ Million) 11.6.6.4. Saudi Arabia: Market Size and Forecast, By End Use, 2023 – 2033 ($ Million) 11.6.7. UAE 11.6.7.1. UAE: Market Size and Forecast, By System Configuration, 2023 – 2033 ($ Million) 11.6.7.2. UAE: Market Size and Forecast, By Technology, 2023 – 2033 ($ Million) 11.6.7.3. UAE: Market Size and Forecast, By Application, 2023 – 2033 ($ Million) 11.6.7.4. UAE: Market Size and Forecast, By End Use, 2023 – 2033 ($ Million) 11.6.8. EGYPT 11.6.8.1. Egypt: Market Size and Forecast, By System Configuration, 2023 – 2033 ($ Million) 11.6.8.2. Egypt: Market Size and Forecast, By Technology, 2023 – 2033 ($ Million) 11.6.8.3. Egypt: Market Size and Forecast, By Application, 2023 – 2033 ($ Million) 11.6.8.4. Egypt: Market Size and Forecast, By End Use, 2023 – 2033 ($ Million) 11.6.9. SOUTH AFRICA 11.6.9.1. South Africa: Market Size and Forecast, By System Configuration, 2023 – 2033 ($ Million) 11.6.9.2. South Africa: Market Size and Forecast, By Technology, 2023 – 2033 ($ Million) 11.6.9.3. South Africa: Market Size and Forecast, By Application, 2023 – 2033 ($ Million) 11.6.9.4. South Africa: Market Size and Forecast, By End Use, 2023 – 2033 ($ Million) 11.6.10. REST OF MIDDLE EAST & AFRICA 11.6.10.1. Rest of Middle East & Africa: Market Size and Forecast, By System Configuration, 2023 – 2033 ($ Million) 11.6.10.2. Rest of Middle East & Africa: Market Size and Forecast, By Technology, 2023 – 2033 ($ Million) 11.6.10.3. Rest of Middle East & Africa: Market Size and Forecast, By Application, 2023 – 2033 ($ Million) 11.6.10.4. Rest of Middle East & Africa: Market Size and Forecast, By End Use, 2023 – 2033 ($ Million) CHAPTER 12. Competitive Landscape 12.1. Competitior Benchmarking 2023 12.2. Market Share Analysis 12.3. Key Developments Analysis By Top 5 Companies 12.4. Market Share Acquisition Strategies: Analysis of Key Approaches Employed by Top Players CHAPTER 13. Company Profiles 13.1. Boeing 13.1.1. Business Overview 13.1.2. Financial Analysis 13.1.2.1. Business Segment Revenue, 2018, 2019, 2020, $ Million 13.1.2.2. Geographic Revenue Mix, 2020 (% Share) 13.1.3. Product Portfolio 13.1.4. Recent Development and Strategies Adopted 13.1.5. SWOT Analysis 13.2. Saab 13.3. Lockheed Martin Corporation 13.4. Northrop Grumman Corporation 13.5. Rheinmetall 13.6. Raytheon 13.7. Drone Defence 13.8. Harris Corporation 13.9. Elbit Systems Ltd 13.10. Thales
Connect to Analyst
Research Methodology

Our Most Viewed Report and gain instant expertise

Airport Information Systems Market Analysis and Global Forecast 2023-2033
Airport Information Systems Market Research Report: Information By System (Airport Operation Control Center, Departure Control System), By Application (Finance & Operations, Maintenance, Security, Others), By Airport (Class A Airports, Class B Airports, Class C Airports, Class D Airports), and by Region — Forecast till 2033
Page: 173