Connected Car Market Analysis and Global Forecast 2023-2033
$ 1,390.00 – $ 5,520.00Price range: $ 1,390.00 through $ 5,520.00
Connected Car Market Research Report: Information By Offering (Hardware, Software, Services), By Connectivity (DSRC, Cellular), By End Market (OEM, After-Market), and by Region — Forecast till 2033
Page: 156
Connected Car Market Overview
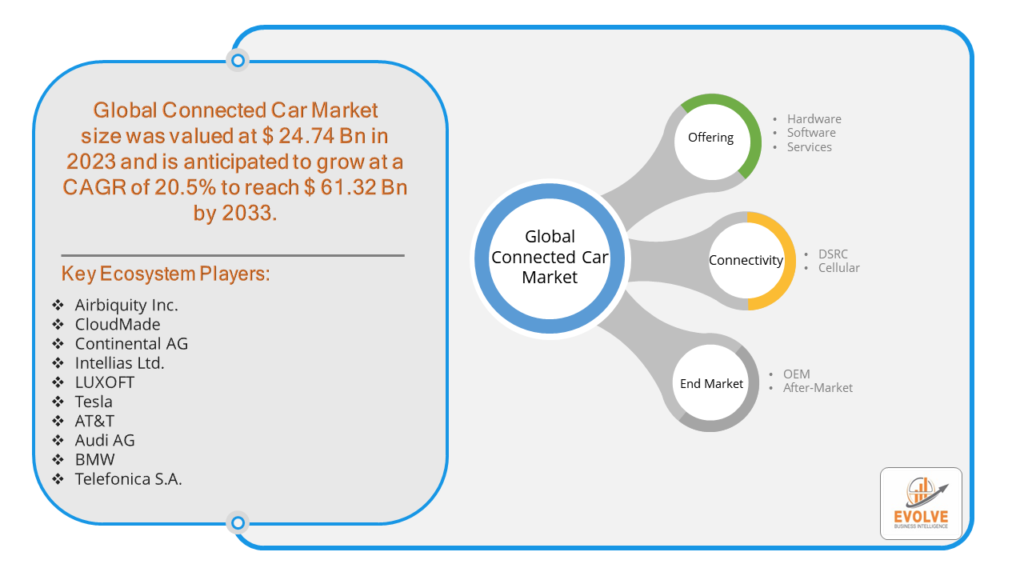
The Connected Car Market Size is expected to reach USD 61.32 Billion by 2033. The Connected Car Market industry size accounted for USD 24.74 Billion in 2023 and is expected to expand at a compound annual growth rate (CAGR) of 20.5% from 2023 to 2033. The Connected Car Market refers to the industry focused on vehicles that are equipped with internet access and usually also with a wireless local area network (LAN). This allows the cars to share internet access and data with other devices both inside and outside the vehicle.
A connected car is a vehicle equipped with internet connectivity and advanced technologies that allow it to communicate with other vehicles, infrastructure, and the internet. This connectivity enables a wide range of features and services, from entertainment and navigation to safety and autonomous driving capabilities. Overall, the connected car market is experiencing rapid growth and is expected to revolutionize the automotive industry. As technology continues to advance and consumer demand increases, we can anticipate even more innovative and connected vehicles in the future.
Global Connected Car Market Synopsis
The COVID-19 pandemic had a significant impact on the Connected Car Market. The pandemic caused widespread disruptions in global supply chains, affecting the production and delivery of critical components for connected cars, such as semiconductors, sensors, and communication modules. Lockdowns and restrictions led to temporary shutdowns or reduced capacity in automotive manufacturing plants, delaying production schedules and impacting market growth. Research and development activities for new technologies and advancements in connected car systems faced delays due to limited operational capacity and resource allocation shifts towards pandemic-related priorities. The pandemic underscored the importance of connectivity and remote services. Consumers and businesses increasingly valued connected features for enhanced safety, navigation, and remote diagnostics. The pandemic highlighted the need for efficient fleet management solutions. Connected cars equipped with telematics systems became essential for businesses to track and manage their fleets remotely.
Connected Car Market Dynamics
The major factors that have impacted the growth of Connected Car Market are as follows:
Drivers:
Ø Technological Advancements
The integration of Internet of Things (IoT) technology enhances vehicle connectivity, enabling real-time data exchange and improved communication between vehicles and infrastructure. The rollout of 5G networks provides faster and more reliable connectivity, essential for advanced connected car features such as Vehicle-to-Everything (V2X) communication and autonomous driving. Consumers increasingly demand advanced infotainment systems, including streaming services, internet radio, and real-time navigation. Features such as automatic emergency braking, collision detection, and lane-keeping assistance improve vehicle safety and are highly sought after by consumers. The ability to monitor vehicle health and performance remotely is a significant driver, reducing maintenance costs and downtime.
Restraint:
- Perception of High Cost of Implementation and Cybersecurity Concerns
Developing and deploying connected car technologies require significant investments in infrastructure, including 5G networks, IoT platforms, and cybersecurity measures. Retrofitting existing vehicles with connected features or integrating them into new models can increase manufacturing costs, potentially passing higher prices onto consumers. Connected cars collect and transmit large amounts of personal and vehicle data, raising concerns about data privacy and unauthorized access. Vulnerabilities in connected car systems can expose vehicles to cyber attacks, compromising safety and personal information. Addressing cybersecurity risks requires robust protective measures and continuous updates.
Opportunity:
⮚ Advancements in Autonomous Driving
Adoption of Advanced Driver Assistance Systems (ADAS) and autonomous driving technologies, leveraging connected car capabilities for safer and more efficient driving experiences. Opportunities in autonomous delivery vehicles, ride-sharing services, and fleet management solutions. Utilization of vehicle data for personalized services, including customized infotainment options, predictive maintenance alerts, and personalized driving preferences. Potential for automakers and service providers to offer subscription-based services, data-driven insights, and targeted advertising.
Connected Car Market Segment Overview
By Offering
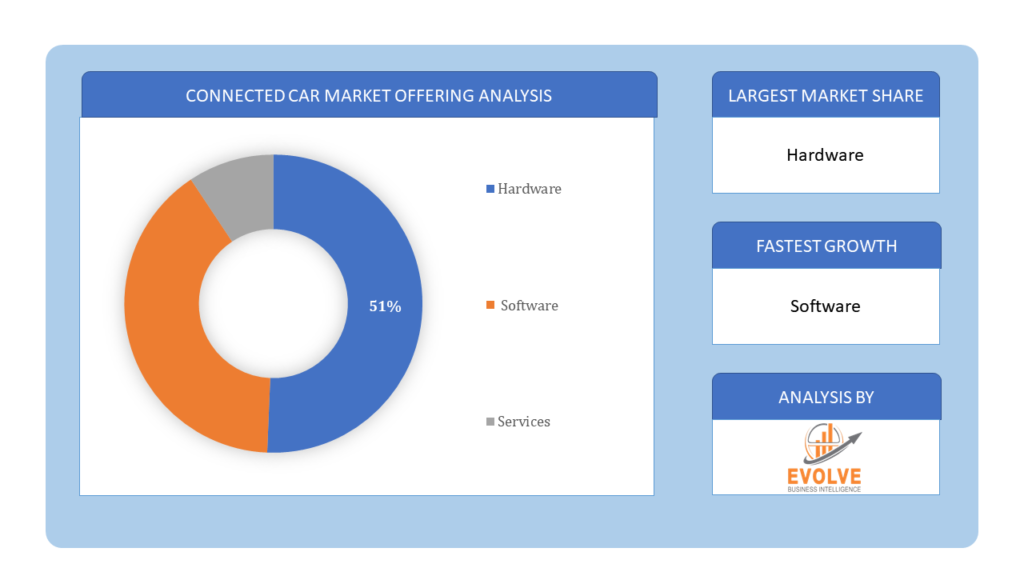
 Based on Offering, the market is segmented based on Hardware, Software, Services. The Services segment dominant the market. The Connected Car Market encompasses a wide range of offerings that enhance the functionality, convenience, and user experience of connected vehicles. These services leverage vehicle connectivity to provide real-time data, seamless communication, and various applications aimed at improving safety, efficiency, and entertainment.
By Connectivity
Based on Connectivity, the market segment has been divided into the DSRC and Cellular. The Cellular segment dominant the market. This can be attributed to raising popularity of vehicle to everything (V2X) communication that is widely used in autonomous connected vehicle. Cellular connectivity is more popular for V2X communication than DSRC due to factors like widespread deployment of cellular network, high penetration of cellular enable device and flexibility and scalability of cellular system.
By End Market
Based on End Market, the market segment has been divided into the OEM and After-Market. The original equipment manufacturers (OEMs) segment dominant the market. EMs are gaining traction in the connected cars market due to the increased adoption of connected vehicle services. Also, advancement in technology has enabled the customers to choose the connected car’s service in the vehicles, which has eventually led to the growth of the global connected car market.
Global Connected Car Market Regional Analysis
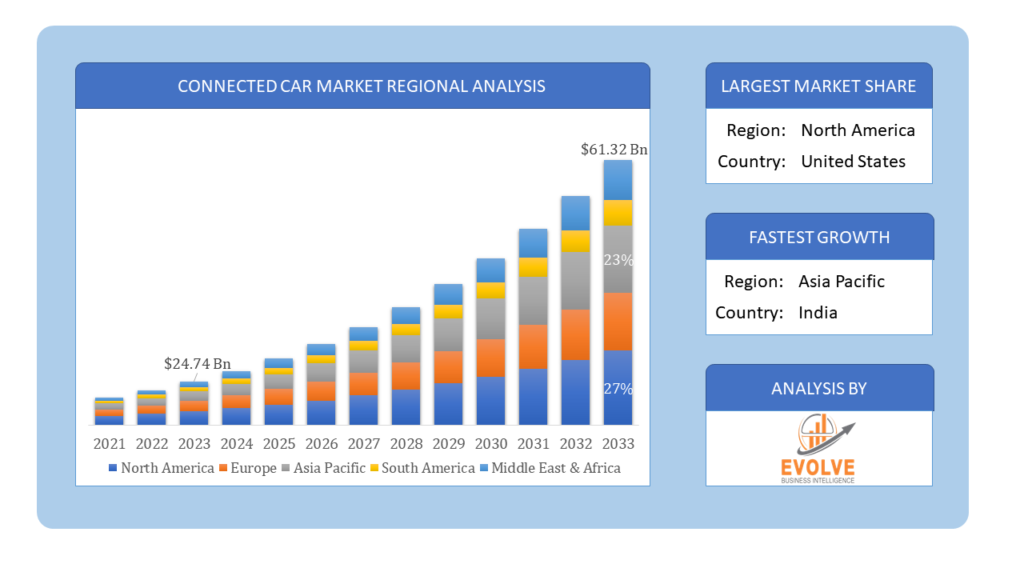
Based on region, the global Connected Car Market has been divided into North America, Europe, Asia-Pacific, the Middle East & Africa, and Latin America. North America is projected to dominate the use of the Connected Car Market followed by the Asia-Pacific and Europe regions.
 Connected Car North America Market
North America holds a dominant position in the Connected Car Market. North America, particularly the United States, leads in technological advancements and adoption of connected car technologies. Supportive regulatory environment encourages innovation in autonomous driving, V2X communication, and cybersecurity. High market maturity with strong consumer demand for advanced infotainment, safety features, and autonomous driving capabilities.
Connected Car Asia-Pacific Market
The Asia-Pacific region has indeed emerged as the fastest-growing market for the Connected Car Market industry. Rapid urbanization, rising disposable incomes, and government initiatives drive market growth in countries like China, Japan, and South Korea. Strong adoption of electric vehicles and supportive policies promoting EV infrastructure and connectivity. Asia Pacific leads in mobile technology adoption, fostering opportunities for IoT integration and smart mobility solutions.
Competitive Landscape
The global Connected Car Market is highly competitive, with numerous players offering a wide range of software solutions. The competitive landscape is characterized by the presence of established companies, as well as emerging startups and niche players. To increase their market position and attract a wide consumer base, the businesses are employing various strategies, such as product launches, and strategic alliances.
Prominent Players:
- Airbiquity Inc.
- CloudMade
- Continental AG
- Intellias Ltd.
- LUXOFT
- Tesla
- AT&T
- Audi AG
- BMW
- Telefonica S.A.
Key Development
In January 2022, Aptiv PLC announced a next-generation advanced driver-assistance system (ADAS) for driverless and electrified vehicles. Because of Aptiv’s scalable architecture will help to reduce the cost of software-driven automobiles.
In November 2021, Continental introduced a technology solution for highly automated driving, comprising clever software that enables complex autonomous driving. The Next Generation Driving Planner is a cutting-edge software solution that allows for highly autonomous driving starting at Level 3.
Scope of the Report
Global Connected Car Market, by Offering
- Hardware
- Software
- Services
Global Connected Car Market, by Connectivity
- DSRC
- Cellular
Global Connected Car Market, by End Market
- OEM
- After-Market
Global Connected Car Market, by Region
- North America
- US
- Canada
- Mexico
- Europe
- UK
- Germany
- France
- Italy
- Spain
- Benelux
- Nordic
- Rest of Europe
- Asia Pacific
- China
- Japan
- South Korea
- Indonesia
- Austalia
- Malaysia
- India
- Rest of Asia Pacific
- South America
- Brazil
- Argentina
- Rest of South America
- Middle East & Africa
- Saudi Arabia
- UAE
- Egypt
- South Africa
- Rest of Middle East & Africa
| Parameters | Indicators |
|---|---|
| Market Size | 2033: $61.32 Billion |
| CAGR | 20.5% CAGR (2023-2033) |
| Base year | 2022 |
| Forecast Period | 2023-2033 |
| Historical Data | 2021 |
| Report Coverage | Revenue Forecast, Competitive Landscape, Growth Factors, and Trends |
| Key Segmentations | Offering, Connectivity, End Market |
| Geographies Covered | North America, Europe, Asia-Pacific, Latin America, Middle East, Africa |
| Key Vendors | Airbiquity Inc., CloudMade, Continental AG, Intellias Ltd., LUXOFT, Tesla, AT&T, Audi AG, BMW and Telefonica S.A |
| Key Market Opportunities | • Advancements in Autonomous Driving • Data-Driven Services and Personalization |
| Key Market Drivers | • Technological Advancements • Consumer Demand for Enhanced Features |
REPORT CONTENT BRIEF:
- High-level analysis of the current and future Connected Car Market trends and opportunities
- Detailed analysis of current market drivers, restraining factors, and opportunities in the future
- Connected Car Market historical market size for the year 2021, and forecast from 2023 to 2033
- Connected Car Market share analysis at each product level
- Competitor analysis with detailed insight into its product segment, Government & Defense strength, and strategies adopted.
- Identifies key strategies adopted including product launches and developments, mergers and acquisitions, joint ventures, collaborations, and partnerships as well as funding taken and investment done, among others.
- To identify and understand the various factors involved in the global Connected Car Market affected by the pandemic
- To provide a detailed insight into the major companies operating in the market. The profiling will include the Government & Defense health of the company’s past 2-3 years with segmental and regional revenue breakup, product offering, recent developments, SWOT analysis, and key strategies.
Press Release

Global Pharmaceutical Manufacturing Market to Reach $1.38 Trillion by 2035 with 7.35% CAGR, New Research Shows

The Global Mammography Market Is Estimated To Record a CAGR of Around 10.29% During The Forecast Period

Glue Stick Market to Reach USD 2.35 Billion by 2034

Podiatry Service Market to Reach USD 11.88 Billion by 2034

Microfluidics Technology Market to Reach USD 32.58 Billion by 2034

Ferric Chloride Market to Reach USD 10.65 Billion by 2034

Family Practice EMR Software Market to Reach USD 21.52 Billion by 2034

Electric Hairbrush Market to Reach USD 15.95 Billion by 2034

Daily Bamboo Products Market to Reach USD 143.52 Billion by 2034

Cross-border E-commerce Logistics Market to Reach USD 112.65 Billion by 2034
Frequently Asked Questions (FAQ)
1.What is the study period of this market?
- The study period of the global Connected Car Market is 2021- 2033
2.What is the growth rate of the global Connected Car Market?
- The global Connected Car Market is growing at a CAGR of 20.5% over the next 10 years
3.Which region has the highest growth rate in the market of Connected Car Market?
- Asia Pacific is expected to register the highest CAGR during 2023-2033
4.Which region has the largest share of the global Connected Car Market?
- North America holds the largest share in 2022
5.Who are the key players in the global Connected Car Market?
Airbiquity Inc., CloudMade, Continental AG, Intellias Ltd., LUXOFT, Tesla, AT&T, Audi AG, BMW and Telefonica S.A are the major companies operating in the market
6.Do you offer Post Sale Support?
- Yes, we offer 16 hours of analyst support to solve the queries
7.Do you sell particular sections of a report?
Yes, we provide regional as well as country-level reports. Other than this we also provide a sectional report. Please get in contact with our sales representatives
Table of Content
CHAPTER 1. Executive Summary CHAPTER 2. Scope of the Study 2.1. Market Definition 2.2. Market Scope & Segmentation 2.2.1. Objective of Report CHAPTER 3. Evolve BI Methodology 3.1. Data Collection & Validation Approach 3.2. Market Size Estimation and Forecast CHAPTER 4. Exclusive Analysis 4.1. Market Opportunity Score 4.1.1. Offering Segement – Market Opportunity Score 4.1.2. Connectivity Segment – Market Opportunity Score 4.1.3. End Market Segment – Market Opportunity Score 4.2. Key Market Influencing Indicators CHAPTER 5. Market Insights and Trends 5.1. Value Chain Analysis 5.1.1. Raw Material 5.1.2. Manufacturing Process 5.1.3. Distribution Channel 5.1.4. End User 5.2. Porter’s Five Forces Analysis 5.2.1. Bargaining Power of Buyers 5.2.2. Bargaining Power of Suppliers 5.2.3. Threat of New Entrant 5.2.4. Threat of Substitute 5.2.5. Industry Rivalry 5.3. COVID-19 Impact and Post COVID Scenario on Connected Car Market 5.3.1. Impact of COVID-19 5.3.2. Government Support and Industry Revival Policies 5.3.3. Measures Taken by Companies to Mitigate Negative Impact 5.3.4. Post COVID Trend CHAPTER 6. Market Dynamics 6.1. Introduction 6.2. Drivers 6.2.1. Driver 1 6.2.2. Driver 2 6.2.3. Driver 3 6.3. Restraints 6.3.1. Restraint 1 6.3.2. Restraint 2 6.4. Opportunity 6.4.1. Opportunity 1 CHAPTER 7. Connected Car Market, By Offering 7.1. Introduction 7.1.1. Hardware 7.1.2. Software 7.1.3. Services CHAPTER 8 Connected Car Market, By Connectivity 8.1. Introduction 8.1.1. DSRC 8.1.2. Cellular CHAPTER 9. Connected Car Market, By End Market 9.1. Introduction 9.1.1. OEM 9.1.2 After-Market CHAPTER 10. Connected Car Market, By Region 10.1. Introduction 10.2. NORTH AMERICA 10.2.1. North America: Market Size and Forecast, By Country, 2023 – 2033 ($ Million) 10.2.2. North America: Market Size and Forecast, By Offering, 2023 – 2033 ($ Million) 10.2.3. North America: Market Size and Forecast, By Connectivity, 2023 – 2033 ($ Million) 10.2.4. North America: Market Size and Forecast, By End Market, 2023 – 2033 ($ Million) 10.2.5. US 10.2.5.1. US: Market Size and Forecast, By Offering, 2023 – 2033 ($ Million) 10.2.5.2. US: Market Size and Forecast, By Connectivity, 2023 – 2033 ($ Million) 10.2.5.3. US: Market Size and Forecast, By End Market, 2023 – 2033 ($ Million) 10.2.6. CANADA 10.2.6.1. Canada: Market Size and Forecast, By Offering, 2023 – 2033 ($ Million) 10.2.6.2. Canada: Market Size and Forecast, By Connectivity, 2023 – 2033 ($ Million) 10.2.6.3. Canada: Market Size and Forecast, By End Market, 2023 – 2033 ($ Million) 10.2.7. MEXICO 10.2.7.1. Mexico: Market Size and Forecast, By Offering, 2023 – 2033 ($ Million) 10.2.7.2. Mexico: Market Size and Forecast, By Connectivity, 2023 – 2033 ($ Million) 10.2.7.3. Mexico: Market Size and Forecast, By End Market, 2023 – 2033 ($ Million) 10.3. Europe 10.3.1. Europe: Market Size and Forecast, By Country, 2023 – 2033 ($ Million) 10.3.2. Europe: Market Size and Forecast, By Offering, 2023 – 2033 ($ Million) 10.3.3. Europe: Market Size and Forecast, By Connectivity, 2023 – 2033 ($ Million) 10.3.4. Europe: Market Size and Forecast, By End Market, 2023 – 2033 ($ Million) 10.3.5. U.K. 10.3.5.1. U.K.: Market Size and Forecast, By Offering, 2023 – 2033 ($ Million) 10.3.5.2. U.K.: Market Size and Forecast, By Connectivity, 2023 – 2033 ($ Million) 10.3.5.3. U.K.: Market Size and Forecast, By End Market, 2023 – 2033 ($ Million) 10.3.6. GERMANY 10.3.6.1. Germany: Market Size and Forecast, By Offering, 2023 – 2033 ($ Million) 10.3.6.2. Germany: Market Size and Forecast, By Connectivity, 2023 – 2033 ($ Million) 10.3.6.3. Germany: Market Size and Forecast, By End Market, 2023 – 2033 ($ Million) 10.3.7. FRANCE 10.3.7.1. France: Market Size and Forecast, By Offering, 2023 – 2033 ($ Million) 10.3.7.2. France: Market Size and Forecast, By Connectivity, 2023 – 2033 ($ Million) 10.3.7.3. France: Market Size and Forecast, By End Market, 2023 – 2033 ($ Million) 10.3.8. ITALY 10.3.8.1. Italy: Market Size and Forecast, By Offering, 2023 – 2033 ($ Million) 10.3.8.2. Italy: Market Size and Forecast, By Connectivity, 2023 – 2033 ($ Million) 10.3.8.3. Italy: Market Size and Forecast, By End Market, 2023 – 2033 ($ Million) 10.3.9. SPAIN 10.3.9.1. Spain: Market Size and Forecast, By Offering, 2023 – 2033 ($ Million) 10.3.9.2. Spain: Market Size and Forecast, By Connectivity, 2023 – 2033 ($ Million) 10.3.9.3. Spain: Market Size and Forecast, By End Market, 2023 – 2033 ($ Million) 10.3.10. BENELUX 10.3.10.1. BeNeLux: Market Size and Forecast, By Offering, 2023 – 2033 ($ Million) 10.3.10.2. BeNeLux: Market Size and Forecast, By Connectivity, 2023 – 2033 ($ Million) 10.3.10.3. BeNeLux: Market Size and Forecast, By End Market, 2023 – 2033 ($ Million) 10.3.11. RUSSIA 10.3.11.1. Russia: Market Size and Forecast, By Offering, 2023 – 2033 ($ Million) 10.3.11.2. Russia: Market Size and Forecast, By Connectivity, 2023 – 2033 ($ Million) 10.3.11.3. Russia: Market Size and Forecast, By End Market, 2023 – 2033 ($ Million) 10.3.12. REST OF EUROPE 10.3.12.1. Rest of Europe: Market Size and Forecast, By Offering, 2023 – 2033 ($ Million) 10.3.12.2. Rest of Europe: Market Size and Forecast, By Connectivity, 2023 – 2033 ($ Million) 10.3.12.3. Rest of Europe: Market Size and Forecast, By End Market, 2023 – 2033 ($ Million) 10.4. Asia Pacific 10.4.1. Asia Pacific: Market Size and Forecast, By Country, 2023 – 2033 ($ Million) 10.4.2. Asia Pacific: Market Size and Forecast, By Offering, 2023 – 2033 ($ Million) 10.4.3. Asia Pacific: Market Size and Forecast, By Connectivity, 2023 – 2033 ($ Million) 10.4.4. Asia Pacific: Market Size and Forecast, By End Market, 2023 – 2033 ($ Million) 10.4.5. CHINA 10.4.5.1. China: Market Size and Forecast, By Offering, 2023 – 2033 ($ Million) 10.4.5.2. China: Market Size and Forecast, By Connectivity, 2023 – 2033 ($ Million) 10.4.5.3. China: Market Size and Forecast, By End Market, 2023 – 2033 ($ Million) 10.4.6. JAPAN 10.4.6.1. Japan: Market Size and Forecast, By Offering, 2023 – 2033 ($ Million) 10.4.6.2. Japan: Market Size and Forecast, By Connectivity, 2023 – 2033 ($ Million) 10.4.6.3. Japan: Market Size and Forecast, By End Market, 2023 – 2033 ($ Million) 10.4.7. INDIA 10.4.7.1. India: Market Size and Forecast, By Offering, 2023 – 2033 ($ Million) 10.4.7.2. India: Market Size and Forecast, By Connectivity, 2023 – 2033 ($ Million) 10.4.7.3. India: Market Size and Forecast, By End Market, 2023 – 2033 ($ Million) 10.4.8. SOUTH KOREA 10.4.8.1. South Korea: Market Size and Forecast, By Offering, 2023 – 2033 ($ Million) 10.4.8.2. South Korea: Market Size and Forecast, By Connectivity, 2023 – 2033 ($ Million) 10.4.8.3. South Korea: Market Size and Forecast, By End Market, 2023 – 2033 ($ Million) 10.4.9. THAILAND 10.4.9.1. Thailand: Market Size and Forecast, By Offering, 2023 – 2033 ($ Million) 10.4.9.2. Thailand: Market Size and Forecast, By Connectivity, 2023 – 2033 ($ Million) 10.4.9.3. Thailand: Market Size and Forecast, By End Market, 2023 – 2033 ($ Million) 10.4.10. INDONESIA 10.4.10.1. Indonesia: Market Size and Forecast, By Offering, 2023 – 2033 ($ Million) 10.4.10.2. Indonesia: Market Size and Forecast, By Connectivity, 2023 – 2033 ($ Million) 10.4.10.3. Indonesia: Market Size and Forecast, By End Market, 2023 – 2033 ($ Million) 10.4.11. MALAYSIA 10.4.11.1. Malaysia: Market Size and Forecast, By Offering, 2023 – 2033 ($ Million) 10.4.11.2. Malaysia: Market Size and Forecast, By Connectivity, 2023 – 2033 ($ Million) 10.4.11.3. Malaysia: Market Size and Forecast, By End Market, 2023 – 2033 ($ Million) 10.4.12. AUSTRALIA 10.4.12.1. Australia: Market Size and Forecast, By Offering, 2023 – 2033 ($ Million) 10.4.12.2. Australia: Market Size and Forecast, By Connectivity, 2023 – 2033 ($ Million) 10.4.12.3. Australia: Market Size and Forecast, By End Market, 2023 – 2033 ($ Million) 10.4.13. REST FO ASIA PACIFIC 10.4.13.1. Rest fo Asia Pacific: Market Size and Forecast, By Offering, 2023 – 2033 ($ Million) 10.4.13.2. Rest fo Asia Pacific: Market Size and Forecast, By Connectivity, 2023 – 2033 ($ Million) 10.4.13.3. Rest fo Asia Pacific: Market Size and Forecast, By End Market, 2023 – 2033 ($ Million) 10.5. South America 10.5.1. South America: Market Size and Forecast, By Country, 2023 – 2033 ($ Million) 10.5.2. South America: Market Size and Forecast, By Offering, 2023 – 2033 ($ Million) 10.5.3. South America: Market Size and Forecast, By Connectivity, 2023 – 2033 ($ Million) 10.5.4. South America: Market Size and Forecast, By End Market, 2023 – 2033 ($ Million) 10.5.5. BRAZIL 10.5.5.1. Brazil: Market Size and Forecast, By Offering, 2023 – 2033 ($ Million) 10.5.5.2. Brazil: Market Size and Forecast, By Connectivity, 2023 – 2033 ($ Million) 10.5.5.3. Brazil: Market Size and Forecast, By End Market, 2023 – 2033 ($ Million) 10.5.6. ARGENTINA 10.5.6.1. Argentina: Market Size and Forecast, By Offering, 2023 – 2033 ($ Million) 10.5.6.2. Argentina: Market Size and Forecast, By Connectivity, 2023 – 2033 ($ Million) 10.5.6.3. Argentina: Market Size and Forecast, By End Market, 2023 – 2033 ($ Million) 10.5.7. REST OF SOUTH AMERICA 10.5.7.1. Rest of South America: Market Size and Forecast, By Offering, 2023 – 2033 ($ Million) 10.5.7.2. Rest of South America: Market Size and Forecast, By Connectivity, 2023 – 2033 ($ Million) 10.5.7.3. Rest of South America: Market Size and Forecast, By End Market, 2023 – 2033 ($ Million) 10.6. Middle East & Africa 10.6.1. Middle East & Africa: Market Size and Forecast, By Country, 2023 – 2033 ($ Million) 10.6.2. Middle East & Africa: Market Size and Forecast, By Offering, 2023 – 2033 ($ Million) 10.6.3. Middle East & Africa: Market Size and Forecast, By Connectivity, 2023 – 2033 ($ Million) 10.6.4. Middle East & Africa: Market Size and Forecast, By End Market, 2023 – 2033 ($ Million) 10.6.5. SAUDI ARABIA 10.6.5.1. Saudi Arabia: Market Size and Forecast, By Offering, 2023 – 2033 ($ Million) 10.6.5.2. Saudi Arabia: Market Size and Forecast, By Connectivity, 2023 – 2033 ($ Million) 10.6.5.3. Saudi Arabia: Market Size and Forecast, By End Market, 2023 – 2033 ($ Million) 10.6.6. UAE 10.6.6.1. UAE: Market Size and Forecast, By Offering, 2023 – 2033 ($ Million) 10.6.6.2. UAE: Market Size and Forecast, By Connectivity, 2023 – 2033 ($ Million) 10.6.6.3. UAE: Market Size and Forecast, By End Market, 2023 – 2033 ($ Million) 10.6.7. EGYPT 10.6.7.1. Egypt: Market Size and Forecast, By Offering, 2023 – 2033 ($ Million) 10.6.7.2. Egypt: Market Size and Forecast, By Connectivity, 2023 – 2033 ($ Million) 10.6.7.3. Egypt: Market Size and Forecast, By End Market, 2023 – 2033 ($ Million) 10.6.8. SOUTH AFRICA 10.6.8.1. South Africa: Market Size and Forecast, By Offering, 2023 – 2033 ($ Million) 10.6.8.2. South Africa: Market Size and Forecast, By Connectivity, 2023 – 2033 ($ Million) 10.6.8.3. South Africa: Market Size and Forecast, By End Market, 2023 – 2033 ($ Million) 10.6.9. REST OF MIDDLE EAST & AFRICA 10.6.9.1. Rest of Middle East & Africa: Market Size and Forecast, By Offering, 2023 – 2033 ($ Million) 10.6.9.2. Rest of Middle East & Africa: Market Size and Forecast, By Connectivity, 2023 – 2033 ($ Million) 10.6.9.3._______ Rest of Middle East & Africa: Market Size and Forecast, By End Market, 2023 – 2033 ($ Million) CHAPTER 12. Competitive Landscape 12.1. Competitior Benchmarking 2023 12.2. Market Share Analysis 12.3. Key Developments Analysis By Top 5 Companies 12.4. Market Share Acquisition Strategies: Analysis of Key Approaches Employed by Top Players CHAPTER 13. Company Profiles 13.1. Airbiquity Inc. 13.1.1. Hanon Systems 13.1.2. Financial Analysis 13.1.2.1. Business Segment Revenue, 2020, 2021, 2022, $ Million 13.1.2.2. Geographic Revenue Mix, 2022 (% Share) 13.1.3. Product Portfolio 13.1.4. Recent Development and Strategies Adopted 13.1.5. SWOT Analysis 13.2. CloudMade 13.3. Continental AG 13.4. Intellias Ltd. 13.5. LUXOFT 13.6. Tesla 13.7. AT&T 13.8. Audi AG 13.9 BMW 13.10 Telefonica S.A
Connect to Analyst
Research Methodology


