Autonomous Emergency Braking Market Analysis and Global Forecast 2023-2033
$ 1,390.00 – $ 5,520.00Price range: $ 1,390.00 through $ 5,520.00
Autonomous Emergency Braking Market Research Report: Information By Product Type (Low-speed AEBS, High-speed AEBS), By Vehicle Type (Passenger Vehicle, Commercial Vehicle), By Technology (Crash Imminent Braking, Dynamic Brake Support), and by Region — Forecast till 2033
Page: 163
Autonomous Emergency Braking Market Overview
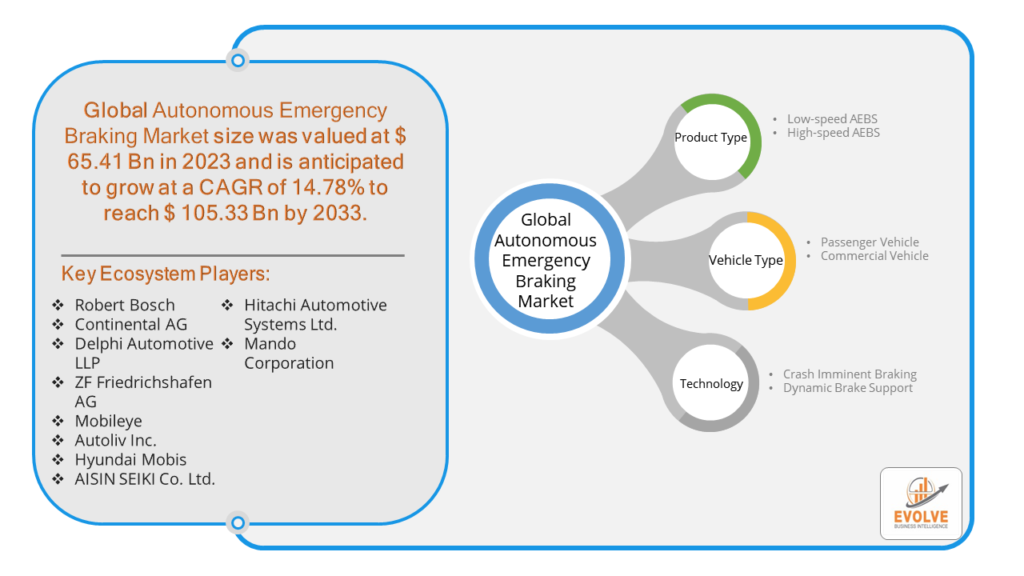
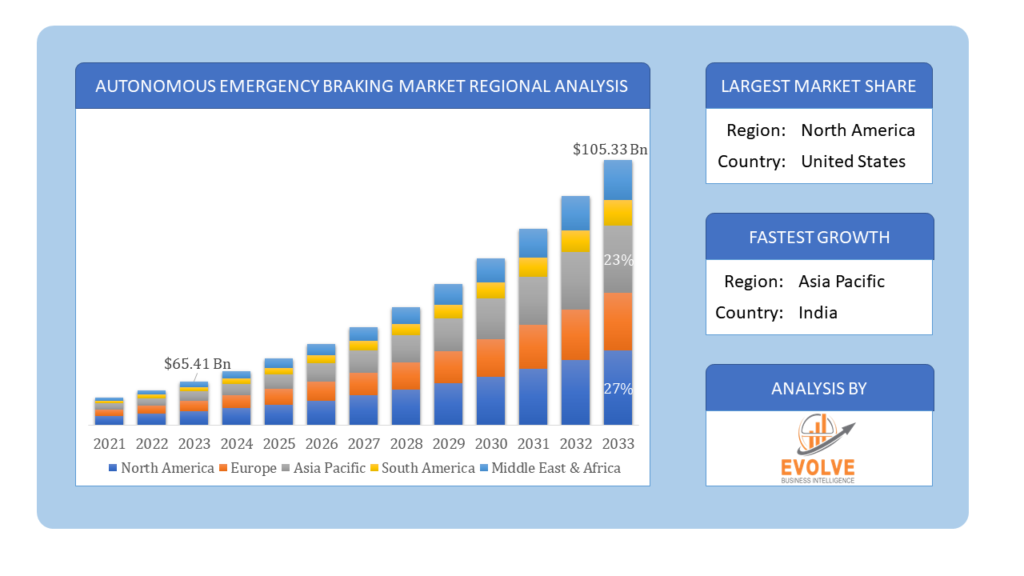
The Autonomous Emergency Braking Market Size is expected to reach USD 105.33 Billion by 2033. The Autonomous Emergency Braking Market industry size accounted for USD 65.41 Billion in 2023 and is expected to expand at a compound annual growth rate (CAGR) of 14.78% from 2023 to 2033. The Autonomous Emergency Braking (AEB) Market refers to the sector focused on the development, production, and sale of AEB systems. These systems are designed to automatically detect an impending collision and activate the brakes to prevent or mitigate the impact without driver intervention. The market includes various components and technologies such as sensors, cameras, radar, and LiDAR, as well as software for vehicle detection and decision-making algorithms. It encompasses a wide range of vehicles including passenger cars, commercial vehicles, and others. The market’s growth is driven by increasing safety concerns, regulatory mandates, and advancements in automotive technology.
AEB systems utilize advanced sensors and technologies to detect potential collisions with objects or pedestrians. When an imminent collision is detected, the system automatically applies the brakes, reducing the vehicle’s speed and minimizing the impact or preventing it altogether. The AEB market is expected to witness significant growth in the coming years due to the increasing focus on road safety, technological advancements, and favorable government regulations.
Global Autonomous Emergency Braking Market Synopsis
The COVID-19 pandemic had a significant impact on the Autonomous Emergency Braking (AEB) Market. The pandemic disrupted global supply chains, affecting the production and distribution of AEB systems. This led to delays and increased costs for manufacturers. The automotive industry faced significant slowdowns in vehicle production due to lockdowns, social distancing measures, and reduced workforce availability. This directly impacted the demand for AEB systems. The economic downturn caused by the pandemic led to reduced consumer spending on non-essential items, including new vehicles equipped with advanced safety systems like AEB. The heightened awareness of health and safety during the pandemic extended to vehicle safety, potentially increasing interest in AEB systems among consumers and regulators. The pandemic accelerated the shift towards automation and contactless technologies, which could boost the adoption of AEB systems in the long run as part of broader vehicle automation trends.
Autonomous Emergency Braking Market Dynamics
The major factors that have impacted the growth of Autonomous Emergency Braking Market are as follows:
Drivers:
Ø Rising Awareness of Vehicle Safety
Growing awareness among consumers about vehicle safety features is driving demand for cars equipped with AEB systems. Consumers are increasingly prioritizing safety when purchasing new vehicles. Independent safety organizations like the Insurance Institute for Highway Safety (IIHS) and Euro NCAP include AEB in their safety ratings, influencing consumer choices and encouraging manufacturers to include AEB systems. Advances in sensor technologies, such as radar, LiDAR, and cameras, have improved the accuracy and reliability of AEB systems, making them more effective in preventing collisions. Integration of AI and machine learning algorithms in AEB systems enhances their ability to detect and respond to potential hazards more accurately and quickly. The broader trend towards vehicle automation and autonomous driving is boosting the adoption of AEB systems as a fundamental component of advanced driver assistance systems (ADAS).
Restraint:
- Perception of High Costs and Technical Limitations
The development, testing, and integration of AEB systems involve significant costs. This can make vehicles equipped with these systems more expensive, potentially deterring cost-sensitive consumers. AEB systems require regular maintenance and can be costly to repair if damaged, increasing the overall cost of vehicle ownership. AEB systems rely on sensors like cameras, radar, and LiDAR, which can be affected by adverse weather conditions such as heavy rain, fog, or snow, potentially reducing their effectiveness.
Opportunity:
⮚ Integration with Autonomous and Connected Vehicles
AEB is a critical component of ADAS, and its integration with other systems like adaptive cruise control and lane-keeping assist enhances overall vehicle safety. The growth of connected vehicle technologies provides opportunities for AEB systems to receive real-time data from other vehicles and infrastructure, improving their effectiveness. Commercial vehicle operators can benefit from AEB systems to enhance fleet safety, reduce accidents, and lower operational costs. Stricter safety regulations for commercial vehicles can drive the adoption of AEB systems in this segment. Developing retrofit AEB solutions for existing vehicles provides a significant opportunity to expand the market beyond new vehicle sales.
Autonomous Emergency Braking Market Segment Overview
By Product Type
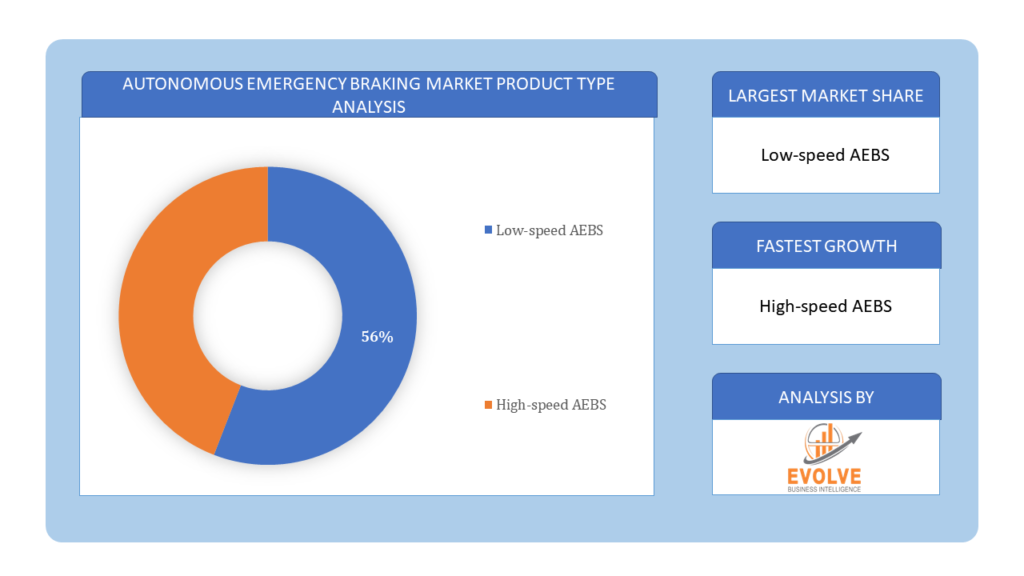 Based on Product Type, the market is segmented based on Low-speed AEBS and High-speed AEBS. The low-speed System segment dominates the market for automated emergency braking. Low-Speed AEB Systems are intended to prevent collisions at lesser speeds of up to 50 km/h (31 mph). They’re especially useful for parking and city driving because sensors identify obstructions and apply brakes as needed. Many modern autos are now equipped with low-speed AEB devices as standard equipment or as an optional feature.
By Vehicle Type
Based on Vehicle Type, the market segment has been divided into the Passenger Vehicle and Commercial Vehicle. The passenger vehicles category dominates the market for automatic emergency braking. Recent passenger cars are frequently outfitted with ADAS, having AEB as either a standard or optional function. SUVs, cars, minivans, and other personal vehicles fall into this category. Recently, the industry has experienced a shift toward cleaner, lower-emission cars. Modern technologies are increasingly in demand, both inside and outside of the passenger vehicle industry.
By Technology
Based on Technology, the market segment has been divided into the Crash Imminent Braking and Dynamic Brake Support. The dynamic brake support segment dominate the automatic emergency braking market. The Dynamic brake Support (DBS) safety function is designed to assist drivers in emergency braking situations by raising brake pressure in response to unexpected braking occurrences.
Global Autonomous Emergency Braking Market Regional Analysis
Based on region, the global Autonomous Emergency Braking Market has been divided into North America, Europe, Asia-Pacific, the Middle East & Africa, and Latin America. North America is projected to dominate the use of the Autonomous Emergency Braking Market followed by the Asia-Pacific and Europe regions.
 Autonomous Emergency Braking North America Market
North America holds a dominant position in the Autonomous Emergency Braking Market. The AEB market in North America is driven by stringent safety regulations and high consumer awareness of vehicle safety features. The National Highway Traffic Safety Administration (NHTSA) and the Insurance Institute for Highway Safety (IIHS) have been instrumental in promoting the adoption of AEB systems. The presence of leading automotive manufacturers and technology companies in the region fosters innovation and the development of advanced AEB systems. There is a significant opportunity for the adoption of AEB systems in commercial vehicle fleets to enhance safety and reduce accident-related costs.
Autonomous Emergency Braking Asia-Pacific Market
The Asia-Pacific region has indeed emerged as the fastest-growing market for the Autonomous Emergency Braking Market industry. Asia Pacific is the fastest-growing region in the AEB market, driven by rapid urbanization, rising disposable incomes, and increasing vehicle ownership. Growing consumer awareness of safety features, government initiatives to improve road safety, and a large automotive manufacturing base contribute to the market’s expansion. China and India are the key growth drivers in this region. China is one of the fastest-growing markets for AEB systems, driven by rapid urbanization, increasing vehicle ownership, and government initiatives to improve road safety. The Chinese government has been proactive in implementing safety regulations and promoting advanced driver assistance systems (ADAS).
Competitive Landscape
The global Autonomous Emergency Braking Market is highly competitive, with numerous players offering a wide range of software solutions. The competitive landscape is characterized by the presence of established companies, as well as emerging startups and niche players. To increase their market position and attract a wide consumer base, the businesses are employing various strategies, such as product launches, and strategic alliances.
Prominent Players:
- Robert Bosch
- Continental AG
- Delphi Automotive LLP
- ZF Friedrichshafen AG
- Mobileye
- Autoliv Inc.
- Hyundai Mobis
- AISIN SEIKI Co. Ltd.
- Hitachi Automotive Systems Ltd.
- Mando Corporation
Scope of the Report
Global Autonomous Emergency Braking Market, by Product Type
- Low-speed AEBS
- High-speed AEBS
Global Autonomous Emergency Braking Market, by Vehicle Type
- Passenger Vehicle
- Commercial Vehicle
Global Autonomous Emergency Braking Market, by Technology
- Crash Imminent Braking
- Dynamic Brake Support
Global Autonomous Emergency Braking Market, by Region
- North America
- US
- Canada
- Mexico
- Europe
- UK
- Germany
- France
- Italy
- Spain
- Benelux
- Nordic
- Rest of Europe
- Asia Pacific
- China
- Japan
- South Korea
- Indonesia
- Austalia
- Malaysia
- India
- Rest of Asia Pacific
- South America
- Brazil
- Argentina
- Rest of South America
- Middle East & Africa
- Saudi Arabia
- UAE
- Egypt
- South Africa
- Rest of Middle East & Africa
| Parameters | Indicators |
|---|---|
| Market Size | 2033: $105.33 Billion |
| CAGR | 14.78% CAGR (2023-2033) |
| Base year | 2022 |
| Forecast Period | 2023-2033 |
| Historical Data | 2021 |
| Report Coverage | Revenue Forecast, Competitive Landscape, Growth Factors, and Trends |
| Key Segmentations | Product Type, Vehicle Type, Technology |
| Geographies Covered | North America, Europe, Asia-Pacific, Latin America, Middle East, Africa |
| Key Vendors | Robert Bosch, Continental AG, Delphi Automotive LLP, ZF Friedrichshafen AG, Mobileye, Autoliv Inc., Hyundai Mobis, AISIN SEIKI Co. Ltd., Hitachi Automotive Systems Ltd. And Mando Corporation |
| Key Market Opportunities | • Integration with Autonomous and Connected Vehicles • Commercial Vehicle Market |
| Key Market Drivers | • Rising Awareness of Vehicle Safety • Technological Advancements |
REPORT CONTENT BRIEF:
- High-level analysis of the current and future Autonomous Emergency Braking Market trends and opportunities
- Detailed analysis of current market drivers, restraining factors, and opportunities in the future
- Autonomous Emergency Braking Market historical market size for the year 2021, and forecast from 2023 to 2033
- Autonomous Emergency Braking Market share analysis at each product level
- Competitor analysis with detailed insight into its product segment, Government & Defense strength, and strategies adopted.
- Identifies key strategies adopted including product launches and developments, mergers and acquisitions, joint ventures, collaborations, and partnerships as well as funding taken and investment done, among others.
- To identify and understand the various factors involved in the global Autonomous Emergency Braking Market affected by the pandemic
- To provide a detailed insight into the major companies operating in the market. The profiling will include the Government & Defense health of the company’s past 2-3 years with segmental and regional revenue breakup, product offering, recent developments, SWOT analysis, and key strategies.
Press Release

Global Pharmaceutical Manufacturing Market to Reach $1.38 Trillion by 2035 with 7.35% CAGR, New Research Shows

The Global Mammography Market Is Estimated To Record a CAGR of Around 10.29% During The Forecast Period

Glue Stick Market to Reach USD 2.35 Billion by 2034

Podiatry Service Market to Reach USD 11.88 Billion by 2034

Microfluidics Technology Market to Reach USD 32.58 Billion by 2034

Ferric Chloride Market to Reach USD 10.65 Billion by 2034

Family Practice EMR Software Market to Reach USD 21.52 Billion by 2034

Electric Hairbrush Market to Reach USD 15.95 Billion by 2034

Daily Bamboo Products Market to Reach USD 143.52 Billion by 2034

Cross-border E-commerce Logistics Market to Reach USD 112.65 Billion by 2034
Frequently Asked Questions (FAQ)
1.What is the study period of this market?
- The study period of the global Autonomous Emergency Braking Market is 2021- 2033
2.What is the growth rate of the global Autonomous Emergency Braking Market?
- The global Autonomous Emergency Braking Market is growing at a CAGR of 14.78% over the next 10 years
3.Which region has the highest growth rate in the market of Autonomous Emergency Braking Market?
- Asia Pacific is expected to register the highest CAGR during 2023-2033
4.Which region has the largest share of the global Autonomous Emergency Braking Market?
- North America holds the largest share in 2022
5.Who are the key players in the global Autonomous Emergency Braking Market?
Robert Bosch, Continental AG, Delphi Automotive LLP, ZF Friedrichshafen AG, Mobileye, Autoliv Inc., Hyundai Mobis, AISIN SEIKI Co. Ltd., Hitachi Automotive Systems Ltd. And Mando Corporation are the major companies operating in the market
6.Do you offer Post Sale Support?
- Yes, we offer 16 hours of analyst support to solve the queries
7.Do you sell particular sections of a report?
Yes, we provide regional as well as country-level reports. Other than this we also provide a sectional report. Please get in contact with our sales representatives
Table of Content
CHAPTER 1. Executive Summary CHAPTER 2. Scope of the Study 2.1. Market Definition 2.2. Market Scope & Segmentation 2.2.1. Objective of Report CHAPTER 3. Evolve BI Methodology 3.1. Data Collection & Validation Approach 3.2. Market Size Estimation and Forecast CHAPTER 4. Exclusive Analysis 4.1. Market Opportunity Score 4.1.1. Product Type Segement – Market Opportunity Score 4.1.2. Vehicle Type Segment – Market Opportunity Score 4.1.3. Technology Segment – Market Opportunity Score 4.2. Key Market Influencing Indicators CHAPTER 5. Market Insights and Trends 5.1. Value Chain Analysis 5.1.1. Raw Material 5.1.2. Manufacturing Process 5.1.3. Distribution Channel 5.1.4. End User 5.2. Porter’s Five Forces Analysis 5.2.1. Bargaining Power of Buyers 5.2.2. Bargaining Power of Suppliers 5.2.3. Threat of New Entrant 5.2.4. Threat of Substitute 5.2.5. Industry Rivalry 5.3. COVID-19 Impact and Post COVID Scenario on Autonomous Emergency Braking Market 5.3.1. Impact of COVID-19 5.3.2. Government Support and Industry Revival Policies 5.3.3. Measures Taken by Companies to Mitigate Negative Impact 5.3.4. Post COVID Trend CHAPTER 6. Market Dynamics 6.1. Introduction 6.2. Drivers 6.2.1. Driver 1 6.2.2. Driver 2 6.2.3. Driver 3 6.3. Restraints 6.3.1. Restraint 1 6.3.2. Restraint 2 6.4. Opportunity 6.4.1. Opportunity 1 CHAPTER 7. Autonomous Emergency Braking Market, By Vehicle Type 7.1. Introduction 7.1.1. Passenger Vehicle 7.1.2. Commercial Vehicle CHAPTER 8 Autonomous Emergency Braking Market, By Product Type 8.1. Introduction 8.1.1. Low-speed AEBS 8.1.2. High-speed AEBS CHAPTER 9. Autonomous Emergency Braking Market, By Technology 9.1. Introduction 9.1.1. Crash Imminent Braking 9.1.2 Dynamic Brake Support CHAPTER 10. Autonomous Emergency Braking Market, By Region 10.1. Introduction 10.2. NORTH AMERICA 10.2.1. North America: Market Size and Forecast, By Country, 2023 – 2033 ($ Million) 10.2.2. North America: Market Size and Forecast, By Product Type, 2023 – 2033 ($ Million) 10.2.3. North America: Market Size and Forecast, By Vehicle Type, 2023 – 2033 ($ Million) 10.2.4. North America: Market Size and Forecast, By Technology, 2023 – 2033 ($ Million) 10.2.5. US 10.2.5.1. US: Market Size and Forecast, By Product Type, 2023 – 2033 ($ Million) 10.2.5.2. US: Market Size and Forecast, By Vehicle Type, 2023 – 2033 ($ Million) 10.2.5.3. US: Market Size and Forecast, By Technology, 2023 – 2033 ($ Million) 10.2.6. CANADA 10.2.6.1. Canada: Market Size and Forecast, By Product Type, 2023 – 2033 ($ Million) 10.2.6.2. Canada: Market Size and Forecast, By Vehicle Type, 2023 – 2033 ($ Million) 10.2.6.3. Canada: Market Size and Forecast, By Technology, 2023 – 2033 ($ Million) 10.2.7. MEXICO 10.2.7.1. Mexico: Market Size and Forecast, By Product Type, 2023 – 2033 ($ Million) 10.2.7.2. Mexico: Market Size and Forecast, By Vehicle Type, 2023 – 2033 ($ Million) 10.2.7.3. Mexico: Market Size and Forecast, By Technology, 2023 – 2033 ($ Million) 10.3. Europe 10.3.1. Europe: Market Size and Forecast, By Country, 2023 – 2033 ($ Million) 10.3.2. Europe: Market Size and Forecast, By Product Type, 2023 – 2033 ($ Million) 10.3.3. Europe: Market Size and Forecast, By Vehicle Type, 2023 – 2033 ($ Million) 10.3.4. Europe: Market Size and Forecast, By Technology, 2023 – 2033 ($ Million) 10.3.5. U.K. 10.3.5.1. U.K.: Market Size and Forecast, By Product Type, 2023 – 2033 ($ Million) 10.3.5.2. U.K.: Market Size and Forecast, By Vehicle Type, 2023 – 2033 ($ Million) 10.3.5.3. U.K.: Market Size and Forecast, By Technology, 2023 – 2033 ($ Million) 10.3.6. GERMANY 10.3.6.1. Germany: Market Size and Forecast, By Product Type, 2023 – 2033 ($ Million) 10.3.6.2. Germany: Market Size and Forecast, By Vehicle Type, 2023 – 2033 ($ Million) 10.3.6.3. Germany: Market Size and Forecast, By Technology, 2023 – 2033 ($ Million) 10.3.7. FRANCE 10.3.7.1. France: Market Size and Forecast, By Product Type, 2023 – 2033 ($ Million) 10.3.7.2. France: Market Size and Forecast, By Vehicle Type, 2023 – 2033 ($ Million) 10.3.7.3. France: Market Size and Forecast, By Technology, 2023 – 2033 ($ Million) 10.3.8. ITALY 10.3.8.1. Italy: Market Size and Forecast, By Product Type, 2023 – 2033 ($ Million) 10.3.8.2. Italy: Market Size and Forecast, By Vehicle Type, 2023 – 2033 ($ Million) 10.3.8.3. Italy: Market Size and Forecast, By Technology, 2023 – 2033 ($ Million) 10.3.9. SPAIN 10.3.9.1. Spain: Market Size and Forecast, By Product Type, 2023 – 2033 ($ Million) 10.3.9.2. Spain: Market Size and Forecast, By Vehicle Type, 2023 – 2033 ($ Million) 10.3.9.3. Spain: Market Size and Forecast, By Technology, 2023 – 2033 ($ Million) 10.3.10. BENELUX 10.3.10.1. BeNeLux: Market Size and Forecast, By Product Type, 2023 – 2033 ($ Million) 10.3.10.2. BeNeLux: Market Size and Forecast, By Vehicle Type, 2023 – 2033 ($ Million) 10.3.10.3. BeNeLux: Market Size and Forecast, By Technology, 2023 – 2033 ($ Million) 10.3.11. RUSSIA 10.3.11.1. Russia: Market Size and Forecast, By Product Type, 2023 – 2033 ($ Million) 10.3.11.2. Russia: Market Size and Forecast, By Vehicle Type, 2023 – 2033 ($ Million) 10.3.11.3. Russia: Market Size and Forecast, By Technology, 2023 – 2033 ($ Million) 10.3.12. REST OF EUROPE 10.3.12.1. Rest of Europe: Market Size and Forecast, By Product Type, 2023 – 2033 ($ Million) 10.3.12.2. Rest of Europe: Market Size and Forecast, By Vehicle Type, 2023 – 2033 ($ Million) 10.3.12.3. Rest of Europe: Market Size and Forecast, By Technology, 2023 – 2033 ($ Million) 10.4. Asia Pacific 10.4.1. Asia Pacific: Market Size and Forecast, By Country, 2023 – 2033 ($ Million) 10.4.2. Asia Pacific: Market Size and Forecast, By Product Type, 2023 – 2033 ($ Million) 10.4.3. Asia Pacific: Market Size and Forecast, By Vehicle Type, 2023 – 2033 ($ Million) 10.4.4. Asia Pacific: Market Size and Forecast, By Technology, 2023 – 2033 ($ Million) 10.4.5. CHINA 10.4.5.1. China: Market Size and Forecast, By Product Type, 2023 – 2033 ($ Million) 10.4.5.2. China: Market Size and Forecast, By Vehicle Type, 2023 – 2033 ($ Million) 10.4.5.3. China: Market Size and Forecast, By Technology, 2023 – 2033 ($ Million) 10.4.6. JAPAN 10.4.6.1. Japan: Market Size and Forecast, By Product Type, 2023 – 2033 ($ Million) 10.4.6.2. Japan: Market Size and Forecast, By Vehicle Type, 2023 – 2033 ($ Million) 10.4.6.3. Japan: Market Size and Forecast, By Technology, 2023 – 2033 ($ Million) 10.4.7. INDIA 10.4.7.1. India: Market Size and Forecast, By Product Type, 2023 – 2033 ($ Million) 10.4.7.2. India: Market Size and Forecast, By Vehicle Type, 2023 – 2033 ($ Million) 10.4.7.3. India: Market Size and Forecast, By Technology, 2023 – 2033 ($ Million) 10.4.8. SOUTH KOREA 10.4.8.1. South Korea: Market Size and Forecast, By Product Type, 2023 – 2033 ($ Million) 10.4.8.2. South Korea: Market Size and Forecast, By Vehicle Type, 2023 – 2033 ($ Million) 10.4.8.3. South Korea: Market Size and Forecast, By Technology, 2023 – 2033 ($ Million) 10.4.9. THAILAND 10.4.9.1. Thailand: Market Size and Forecast, By Product Type, 2023 – 2033 ($ Million) 10.4.9.2. Thailand: Market Size and Forecast, By Vehicle Type, 2023 – 2033 ($ Million) 10.4.9.3. Thailand: Market Size and Forecast, By Technology, 2023 – 2033 ($ Million) 10.4.10. INDONESIA 10.4.10.1. Indonesia: Market Size and Forecast, By Product Type, 2023 – 2033 ($ Million) 10.4.10.2. Indonesia: Market Size and Forecast, By Vehicle Type, 2023 – 2033 ($ Million) 10.4.10.3. Indonesia: Market Size and Forecast, By Technology, 2023 – 2033 ($ Million) 10.4.11. MALAYSIA 10.4.11.1. Malaysia: Market Size and Forecast, By Product Type, 2023 – 2033 ($ Million) 10.4.11.2. Malaysia: Market Size and Forecast, By Vehicle Type, 2023 – 2033 ($ Million) 10.4.11.3. Malaysia: Market Size and Forecast, By Technology, 2023 – 2033 ($ Million) 10.4.12. AUSTRALIA 10.4.12.1. Australia: Market Size and Forecast, By Product Type, 2023 – 2033 ($ Million) 10.4.12.2. Australia: Market Size and Forecast, By Vehicle Type, 2023 – 2033 ($ Million) 10.4.12.3. Australia: Market Size and Forecast, By Technology, 2023 – 2033 ($ Million) 10.4.13. REST FO ASIA PACIFIC 10.4.13.1. Rest fo Asia Pacific: Market Size and Forecast, By Product Type, 2023 – 2033 ($ Million) 10.4.13.2. Rest fo Asia Pacific: Market Size and Forecast, By Vehicle Type, 2023 – 2033 ($ Million) 10.4.13.3. Rest fo Asia Pacific: Market Size and Forecast, By Technology, 2023 – 2033 ($ Million) 10.5. South America 10.5.1. South America: Market Size and Forecast, By Country, 2023 – 2033 ($ Million) 10.5.2. South America: Market Size and Forecast, By Product Type, 2023 – 2033 ($ Million) 10.5.3. South America: Market Size and Forecast, By Vehicle Type, 2023 – 2033 ($ Million) 10.5.4. South America: Market Size and Forecast, By Technology, 2023 – 2033 ($ Million) 10.5.5. BRAZIL 10.5.5.1. Brazil: Market Size and Forecast, By Product Type, 2023 – 2033 ($ Million) 10.5.5.2. Brazil: Market Size and Forecast, By Vehicle Type, 2023 – 2033 ($ Million) 10.5.5.3. Brazil: Market Size and Forecast, By Technology, 2023 – 2033 ($ Million) 10.5.6. ARGENTINA 10.5.6.1. Argentina: Market Size and Forecast, By Product Type, 2023 – 2033 ($ Million) 10.5.6.2. Argentina: Market Size and Forecast, By Vehicle Type, 2023 – 2033 ($ Million) 10.5.6.3. Argentina: Market Size and Forecast, By Technology, 2023 – 2033 ($ Million) 10.5.7. REST OF SOUTH AMERICA 10.5.7.1. Rest of South America: Market Size and Forecast, By Product Type, 2023 – 2033 ($ Million) 10.5.7.2. Rest of South America: Market Size and Forecast, By Vehicle Type, 2023 – 2033 ($ Million) 10.5.7.3. Rest of South America: Market Size and Forecast, By Technology, 2023 – 2033 ($ Million) 10.6. Middle East & Africa 10.6.1. Middle East & Africa: Market Size and Forecast, By Country, 2023 – 2033 ($ Million) 10.6.2. Middle East & Africa: Market Size and Forecast, By Product Type, 2023 – 2033 ($ Million) 10.6.3. Middle East & Africa: Market Size and Forecast, By Vehicle Type, 2023 – 2033 ($ Million) 10.6.4. Middle East & Africa: Market Size and Forecast, By Technology, 2023 – 2033 ($ Million) 10.6.5. SAUDI ARABIA 10.6.5.1. Saudi Arabia: Market Size and Forecast, By Product Type, 2023 – 2033 ($ Million) 10.6.5.2. Saudi Arabia: Market Size and Forecast, By Vehicle Type, 2023 – 2033 ($ Million) 10.6.5.3. Saudi Arabia: Market Size and Forecast, By Technology, 2023 – 2033 ($ Million) 10.6.6. UAE 10.6.6.1. UAE: Market Size and Forecast, By Product Type, 2023 – 2033 ($ Million) 10.6.6.2. UAE: Market Size and Forecast, By Vehicle Type, 2023 – 2033 ($ Million) 10.6.6.3. UAE: Market Size and Forecast, By Technology, 2023 – 2033 ($ Million) 10.6.7. EGYPT 10.6.7.1. Egypt: Market Size and Forecast, By Product Type, 2023 – 2033 ($ Million) 10.6.7.2. Egypt: Market Size and Forecast, By Vehicle Type, 2023 – 2033 ($ Million) 10.6.7.3. Egypt: Market Size and Forecast, By Technology, 2023 – 2033 ($ Million) 10.6.8. SOUTH AFRICA 10.6.8.1. South Africa: Market Size and Forecast, By Product Type, 2023 – 2033 ($ Million) 10.6.8.2. South Africa: Market Size and Forecast, By Vehicle Type, 2023 – 2033 ($ Million) 10.6.8.3. South Africa: Market Size and Forecast, By Technology, 2023 – 2033 ($ Million) 10.6.9. REST OF MIDDLE EAST & AFRICA 10.6.9.1. Rest of Middle East & Africa: Market Size and Forecast, By Product Type, 2023 – 2033 ($ Million) 10.6.9.2. Rest of Middle East & Africa: Market Size and Forecast, By Vehicle Type, 2023 – 2033 ($ Million) 10.6.9.3._______ Rest of Middle East & Africa: Market Size and Forecast, By Technology, 2023 – 2033 ($ Million) CHAPTER 12. Competitive Landscape 12.1. Competitior Benchmarking 2023 12.2. Market Share Analysis 12.3. Key Developments Analysis By Top 5 Companies 12.4. Market Share Acquisition Strategies: Analysis of Key Approaches Employed by Top Players CHAPTER 13. Company Profiles 13.1. Robert Bosch 13.1.1. Hanon Systems 13.1.2. Financial Analysis 13.1.2.1. Business Segment Revenue, 2020, 2021, 2022, $ Million 13.1.2.2. Geographic Revenue Mix, 2022 (% Share) 13.1.3. Product Portfolio 13.1.4. Recent Development and Strategies Adopted 13.1.5. SWOT Analysis 13.2. Continental AG 13.3. Delphi Automotive LLP 13.4. ZF Friedrichshafen AG 13.5. Mobileye 13.6. Autoliv Inc. 13.7. Hyundai Mobis 13.8. AISIN SEIKI Co. Ltd. 13.9 Hitachi Automotive Systems Ltd. 13.10 Mando Corporation.
Connect to Analyst
Research Methodology


