Price range: $ 1,390.00 through $ 5,520.00
Agriculture Analytics Market Research Report: Information By Component (Solution, Services), By Application (Farm analytics, Livestock analytics, Others), and by Region — Forecast till 2033
Page: 163
Description
Agriculture Analytics Market Overview
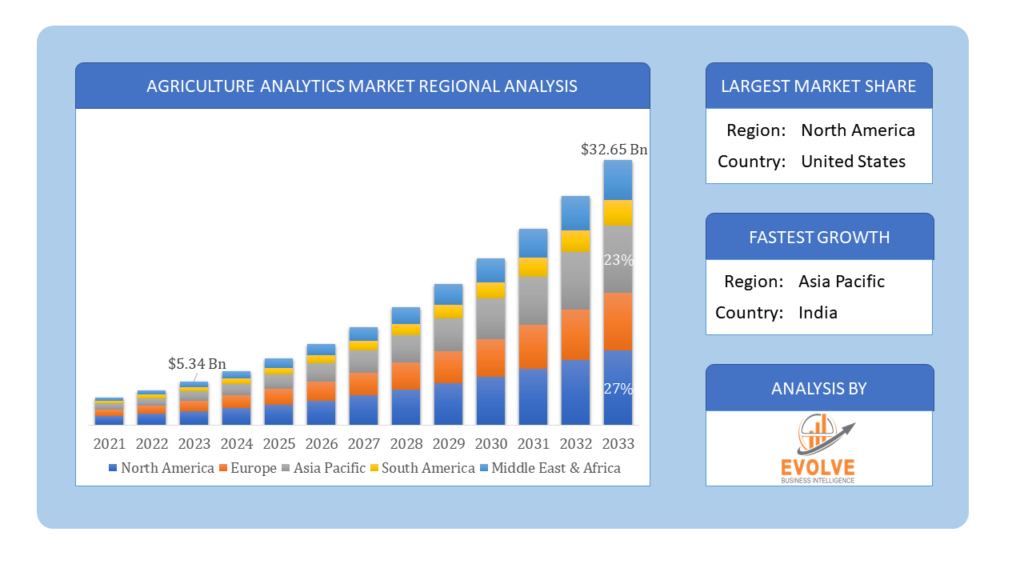
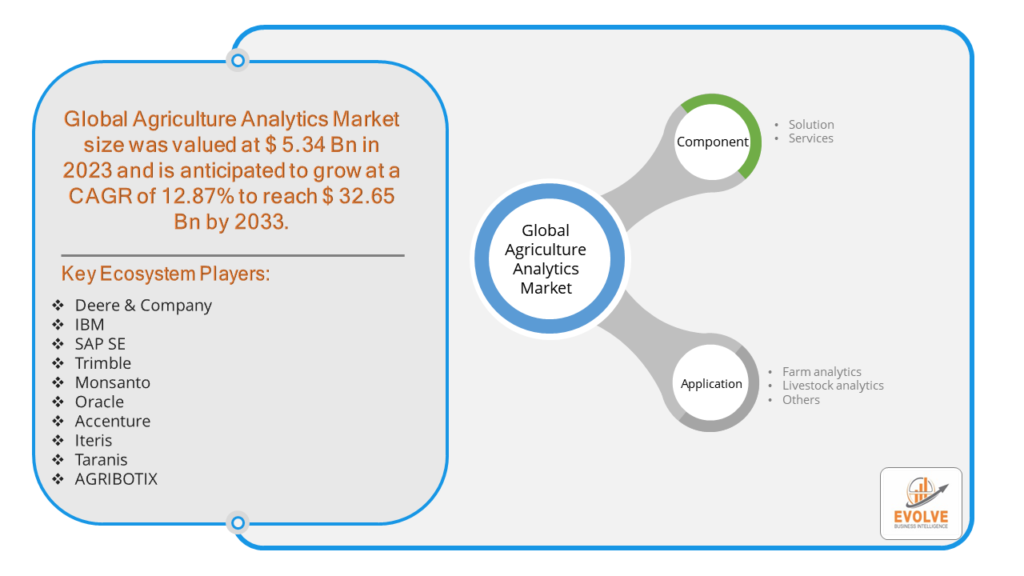
The Agriculture Analytics Market Size is expected to reach USD 32.65 Billion by 2033. The Agriculture Analytics industry size accounted for USD 5.34 Billion in 2023 and is expected to expand at a compound annual growth rate (CAGR) of 12.87% from 2023 to 2033. The agriculture analytics market encompasses the application of data analytics and technology in farming practices to enhance efficiency, productivity, and sustainability. It includes the use of sensors, satellite imagery, and AI-driven insights to optimize crop yield, manage resources like water and fertilizers more effectively, and mitigate risks such as weather-related challenges and pests. Key players offer solutions ranging from precision farming tools for data-driven decision-making to predictive analytics for market trends and supply chain management. This market is driven by increasing adoption of smart farming techniques and advancements in IoT and AI technologies tailored for agricultural use.
Global Agriculture Analytics Market Synopsis
The COVID-19 pandemic has led to supply chain disruptions leading to supply shortages or lower demand in the agriculture analytics market. The travel restrictions and social-distancing measures have resulted in a sharp drop in consumer and business spending and this pattern is to continue for some time. The end-user trend and preferences have changed due to the pandemic and have resulted in manufacturers, developers, and service providers to adopt various strategies to stabilize the company.
Agriculture Analytics Market Dynamics
The major factors that have impacted the growth of Agriculture Analytics are as follows:
Drivers:
Ø Technological Advancements
Advances in technology, such as IoT (Internet of Things) devices, drones, and AI-driven analytics platforms, have revolutionized agriculture. These tools provide farmers with actionable insights into soil health, crop conditions, and weather patterns, enabling proactive decision-making and risk management.
Restraint:
- Data Privacy and Security Concerns
Agriculture generates vast amounts of sensitive data related to crop yields, soil health, and farm operations. Concerns about data privacy, ownership, and cybersecurity risks associated with cloud-based analytics platforms deter farmers from fully embracing analytics solutions.
Opportunity:
⮚ Data-Driven Decision Support
Agriculture analytics empower farmers with data-driven decision support tools, such as predictive analytics for yield forecasting, market trends analysis, and risk management. Timely insights enable proactive adjustments to farming strategies, maximizing profitability and resilience.
Agriculture Analytics Segment Overview
By Component
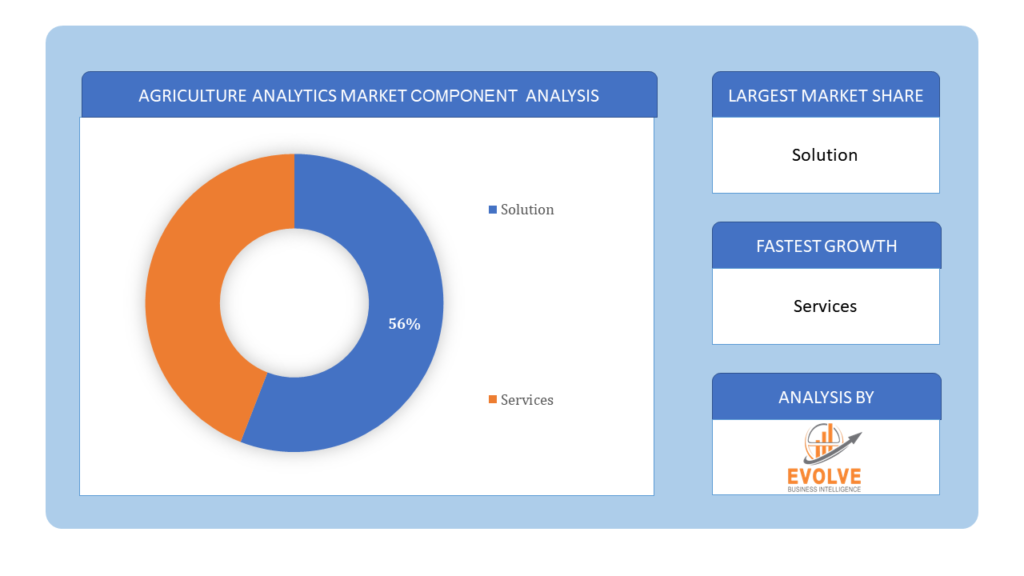
 Based on Component, the market is segmented based on Solution, Services. Solutions dominate the segment based on components. These solutions include software platforms, AI algorithms, and IoT devices tailored for farm management, crop monitoring, and data analysis, driving technological advancements and operational efficiencies in agriculture.
By Application
Based on Applications, the market has been divided into the Farm analytics, Livestock analytics, Others. Farm analytics dominates among the segments based on applications. Farm analytics focuses on crop management, soil health monitoring, and precision farming techniques, making it a primary driver of technological adoption and efficiency improvements in modern agriculture.
Global Agriculture Analytics Market Regional Analysis
Based on region, the global Agriculture Analytics market has been divided into North America, Europe, Asia-Pacific, the Middle East & Africa, and Latin America. Asia-Pacific is projected to dominate the use of the Agriculture Analytics market followed by the North America and Europe regions.
 Agriculture Analytics Asia-Pacific Market
Asia-Pacific holds a dominant position in the Agriculture Analytics Market. From 2023 to 2032, the Asia-Pacific Agriculture Analytics Market is anticipated to develop at the quickest compound annual growth rate (CAGR). The growing government effort to digitize and improve farming methods will probably drive demand for agriculture analytics. In order to boost yield, the fast population growth of countries like China, Japan, and India also promotes the adoption of cutting-edge technologies. The Middle East and Africa will see a major growth in the usage of agriculture analytics because most of these regions have less water resources accessible.
Agriculture Analytics North America Market
The North America region has indeed emerged as the fastest-growing market for the Agriculture Analytics industry. Over the projected period, the North American agriculture analytics market is expected to have a dominant market share. The market is growing because of the region’s dense concentration of big data analytics, artificial intelligence, cloud computing, and other technology suppliers. The US is expected to dominate the market because technologies were adopted early in all industries. Europe is expected to increase significantly as well over the forecast period. The farming industry is adopting agriculture analytics at a rate driven by the growing demand for high-quality, fresh food.
Competitive Landscape
The global Agriculture Analytics market is highly competitive, with numerous players offering a wide range of software solutions. The competitive landscape is characterized by the presence of established companies, as well as emerging startups and niche players. To increase their market position and attract a wide consumer base, the businesses are employing various strategies, such as product launches, and strategic alliances.
Prominent Players:
- Deere & Company
- IBM
- SAP SE
- Trimble
- Monsanto
- Oracle
- Accenture
- Iteris
- Taranis
Key Development
In September 2022, Deere & Company, a major player in agriculture analytics, focused on expanding its digital agriculture offerings. This included advancements in precision farming technologies and integration of AI-driven analytics to enhance productivity and sustainability for farmers globally.
Scope of the Report
Global Agriculture Analytics Market, by Component
- Solution
- Services
Global Agriculture Analytics Market, by Application
- Farm analytics
- Livestock analytics
- Others
Global Agriculture Analytics Market, by Region
- North America
- US
- Canada
- Mexico
- Europe
- UK
- Germany
- France
- Italy
- Spain
- Benelux
- Nordic
- Rest of Europe
- Asia Pacific
- China
- Japan
- South Korea
- Indonesia
- Austalia
- Malaysia
- India
- Rest of Asia Pacific
- South America
- Brazil
- Argentina
- Rest of South America
- Middle East & Africa
- Saudi Arabia
- UAE
- Egypt
- South Africa
- Rest of Middle East & Africa
| Parameters | Indicators |
|---|---|
| Market Size | 2033: $32.65 Billion |
| CAGR | 12.87% CAGR (2023-2033) |
| Base year | 2022 |
| Forecast Period | 2023-2033 |
| Historical Data | 2021 |
| Report Coverage | Revenue Forecast, Competitive Landscape, Growth Factors, and Trends |
| Key Segmentations | Component, Application |
| Geographies Covered | North America, Europe, Asia-Pacific, Latin America, Middle East, Africa |
| Key Vendors | Deere & Company, IBM, SAP SE, Trimble, Monsanto, Oracle, Accenture, Iteris, Taranis, AGRIBOTIX |
| Key Market Opportunities | • Rising food prices |
| Key Market Drivers | • Need to maintain a healthy agricultural yield |
REPORT CONTENT BRIEF:
- High-level analysis of the current and future Agriculture Analytics market trends and opportunities
- Detailed analysis of current market drivers, restraining factors, and opportunities in the future
- Agriculture Analytics market historical market size for the year 2021, and forecast from 2023 to 2033
- Agriculture Analytics market share analysis at each product level
- Competitor analysis with detailed insight into its product segment, Government & Defense strength, and strategies adopted.
- Identifies key strategies adopted including product launches and developments, mergers and acquisitions, joint ventures, collaborations, and partnerships as well as funding taken and investment done, among others.
- To identify and understand the various factors involved in the global Agriculture Analytics market affected by the pandemic
- To provide a detailed insight into the major companies operating in the market. The profiling will include the Government & Defense health of the company’s past 2-3 years with segmental and regional revenue breakup, product offering, recent developments, SWOT analysis, and key strategies.
Frequently Asked Questions (FAQ)
2.What is the growth rate of the global Agriculture Analytics market?
- The global Agriculture Analytics market is growing at a CAGR of 12.87% over the next 10 years
3.Which region has the highest growth rate in the market of Agriculture Analytics?
- North America is expected to register the highest CAGR during 2023-2033
4.Which region has the largest share of the global Agriculture Analytics market?
- Asia Pacific holds the largest share in 2022
5.Who are the key players in the global Agriculture Analytics market?
Deere & Company, IBM, SAP SE, Trimble, Monsanto, Oracle, Accenture, Iteris, Taranis, and AGRIBOTIX. are the major companies operating in the market
6.Do you offer Post Sale Support?
- Yes, we offer 16 hours of analyst support to solve the queries
7.Do you sell particular sections of a report?
Yes, we provide regional as well as country-level reports. Other than this we also provide a sectional report. Please get in contact with our sales representatives
Additional information
| Packages | Single User License, Enterprise License, Data Pack Excel |
|---|
Table of Content
[html_block id="7531"]


