EV On-Board Battery Chargers Market Analysis and Global Forecast 2024-2034

$ 1,390.00$ 5,520.00

EV On-Board Battery Chargers Market Research Report: Information By Power Output (Low-Power Chargers, Medium-Power Chargers, High-Power Chargers), By Propulsion Type (Battery Electric Vehicles (BEVs), Plug-in Hybrid Electric Vehicles (PHEVs)), by Vehicle Type (Passenger Cars, Commercial Vehicles) by End User (OEMs (Original Equipment Manufacturers), Aftermarket), and by Region — Forecast till 2034

Page: 165

Report Published on: April 1, 2025
$ 3,470.00
$ 5,520.00
$ 1,390.00
Description

EV On-Board Battery Chargers Market Overview

The EV On-Board Battery Chargers Market size accounted for USD 4.56 Billion in 2023 and is estimated to account for 5.85 Billion in 2024. The Market is expected to reach USD 25.88 Billion by 2034 growing at a compound annual growth rate (CAGR) of 18.21% from 2024 to 2034. The EV On-Board Battery Chargers Market is a key segment in the electric vehicle (EV) ecosystem, focusing on the development and production of chargers that are integrated into EVs to convert AC power from external sources into DC power for battery charging. These chargers play a critical role in ensuring efficient energy conversion and battery longevity.

The global EV on-board battery charger market is poised for substantial growth in the coming years. The increasing sales of electric vehicles, coupled with technological advancements in charging solutions and supportive government initiatives, will continue to drive market expansion.

Global EV On-Board Battery Chargers Market Synopsis
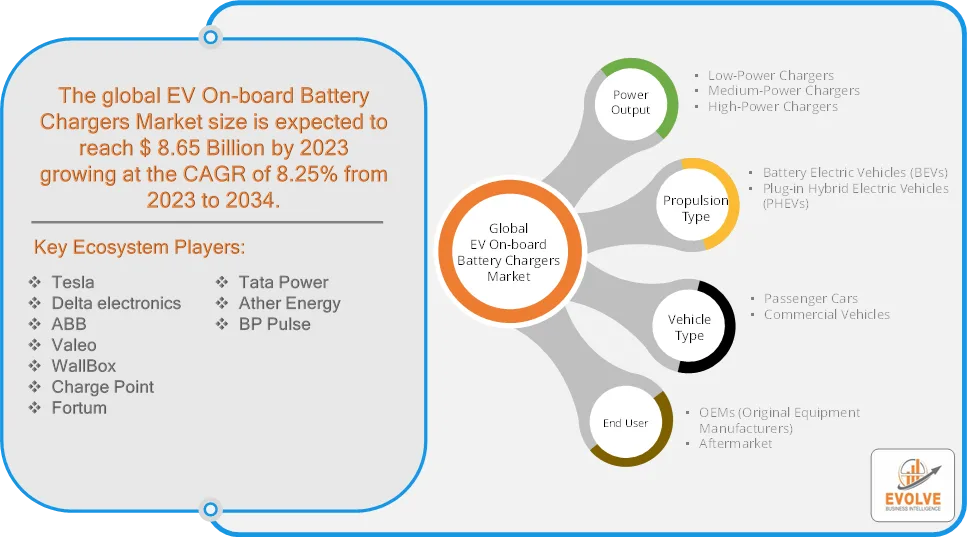
EV On-Board Battery Chargers Market AnalysisEV On-Board Battery Chargers Market Dynamics

The major factors that have impacted the growth of EV On-Board Battery Chargers Market are as follows:

Drivers:

Ø  Expansion of Charging Infrastructure

Growth in home, workplace, and public charging networks. Investments in smart grid integration for efficient charging. Development of fast-charging stations complementing on-board chargers. Shift from 3.3 kW and 6.6 kW chargers to 11 kW and above for faster charging. Growing need for high-power charging in commercial EVs and long-range passenger EVs. Increasing adoption of electric taxis, buses, and delivery fleets driving demand for efficient on-board chargers and expansion of ride-hailing services like Uber and Lyft transitioning to EV fleets.

Restraint:

  • High Initial Cost of On-Board Chargers

Advanced on-board battery chargers (especially high-power models) involve expensive semiconductor materials like silicon carbide (SiC) and gallium nitride (GaN). Integration of bidirectional charging and smart grid connectivity further increases costs. On-board chargers must operate efficiently within limited vehicle space, leading to thermal management issues and power conversion losses can impact battery performance and vehicle range and developing countries have limited public charging networks, reducing the need for advanced on-board chargers.

Opportunity:

⮚     Wireless On-Board Charging Technologies

Advancements in inductive (wireless) charging for EVs eliminate the need for physical connectors. Automakers collaborating with tech firms to develop integrated wireless on-board chargers for seamless user experience. AI-driven and IoT-enabled on-board chargers optimize charging based on energy demand and grid conditions. Integration with mobile apps and cloud platforms enables remote monitoring and scheduling of charging. Subsidies for energy-efficient charging solutions boost R&D and innovation in on-board chargers and tax benefits and incentives for EV manufacturers promoting the development of integrated charging systems.

EV On-Board Battery Chargers Market Segment Overview

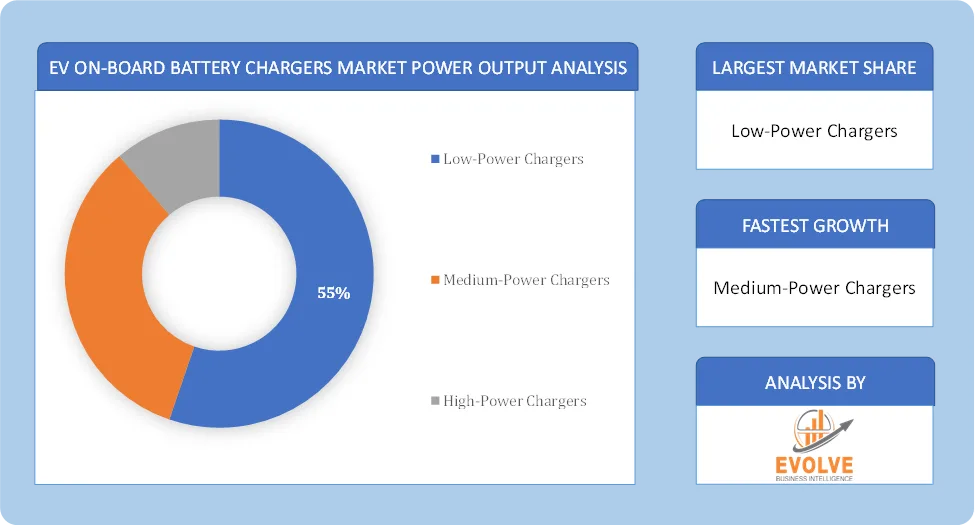
EV On-Board Battery Chargers Market Power Output AnalysisBy Power Output

Based on Power Output, the market is segmented based on Low-Power Chargers, Medium-Power Chargers, High-Power Chargers. The Low-Power Chargers segment dominant the market. Home charging remains the primary use case, with government support boosting adoption and the shift towards higher-power chargers (11+ kW) in long-range EVs could impact the growth of this segment.

By Propulsion Type

Based on Propulsion Type, the market segment has been divided into Battery Electric Vehicles (BEVs), Plug-in Hybrid Electric Vehicles (PHEVs). The Battery Electric Vehicles segment dominant the market. BEVs are witnessing higher demand than Plug-in Hybrid Electric Vehicles (PHEVs) due to government policies promoting full electrification. More BEVs will feature Vehicle-to-Grid (V2G) & Vehicle-to-Home (V2H) support, allowing energy sharing and grid stabilization.

By Vehicle Type

Based on Vehicle Type, the market segment has been divided into Passenger Cars, Commercial Vehicles. The Passenger Cars segment dominant the market. Global EV sales surged due to government incentives, lower battery costs, and improved charging infrastructure. Integration of bidirectional charging (Vehicle-to-Grid, Vehicle-to-Home) in passenger EVs is increasing demand for advanced OBCs.

By End User

Based on End User, the market segment has been divided into OEMs (Original Equipment Manufacturers) and Aftermarket. The OEMs segment dominant the market. Rising sales of Battery Electric Vehicles (BEVs) and Plug-in Hybrid Electric Vehicles (PHEVs) globally and Governments offering incentives and tax credits to boost EV adoption. Increase in residential EV ownership driving demand for efficient OBCs and Integration with solar power and AI-based smart charging solutions.

Global EV On-Board Battery Chargers Market Regional Analysis

Based on region, the global EV On-Board Battery Chargers Market has been divided into North America, Europe, Asia-Pacific, the Middle East & Africa, and Latin America. North America is projected to dominate the use of the EV On-Board Battery Chargers Market followed by the Asia-Pacific and Europe regions.
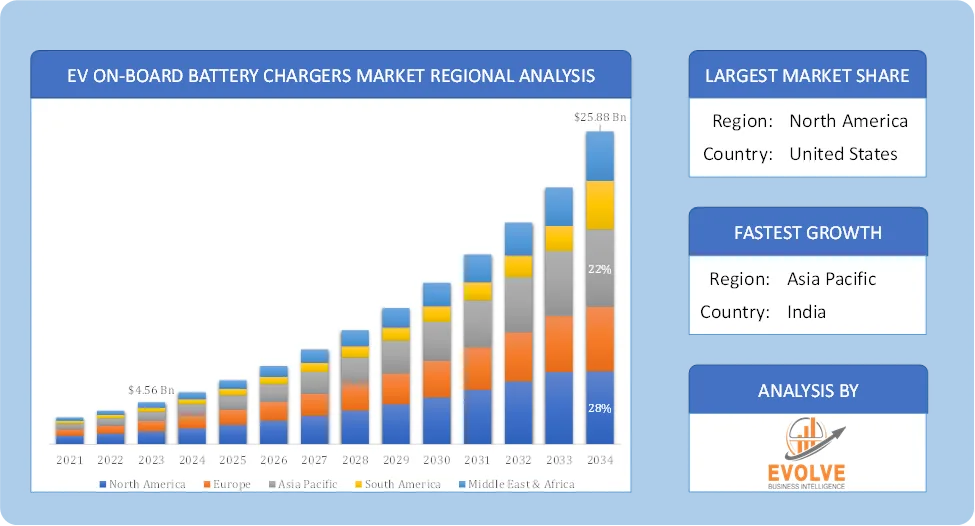
Global EV On-Board Battery Chargers Market Regional AnalysisNorth America EV On-Board Battery Chargers Market

North America holds a dominant position in the EV On-Board Battery Chargers Market. EV sales are steadily increasing in North America, driven by growing environmental awareness and the availability of new EV models. Increasing deployment of home and workplace charging stations and growth in fast-charging on-board chargers (11 kW and above) for longer-range EV and Increasing interest in faster charging solutions and higher power OBCs.

Asia-Pacific EV On-Board Battery Chargers Market

The Asia-Pacific region has indeed emerged as the fastest-growing market for the EV On-Board Battery Chargers Market industry. China is the world’s leading EV hub and holds the maximum market share in this region and countries like China, Japan, South Korea, and India are witnessing rapid growth in EV adoption, fueled by government incentives, urbanization, and increasing environmental awareness. Asia Pacific is a major manufacturing hub for both vehicles and electronic components, providing a strong supply chain for OBCs.

Competitive Landscape

The global EV On-Board Battery Chargers Market is highly competitive, with numerous players offering a wide range of software solutions. The competitive landscape is characterized by the presence of established companies, as well as emerging startups and niche players. To increase their market position and attract a wide consumer base, the businesses are employing various strategies, such as product launches, and strategic alliances.

Prominent Players:

  • Tesla
  • Delta electronics
  • ABB
  • Valeo
  • WallBox
  • Charge Point
  • Fortum
  • Tata Power
  • Ather Energy
  • BP Pulse.

Scope of the Report

Global EV On-Board Battery Chargers Market, by Power Output
  • Low-Power Chargers
  • Medium-Power Chargers
  • High-Power Chargers
Global EV On-Board Battery Chargers Market, by Propulsion Type
  • Battery Electric Vehicles (BEVs)
  • Plug-in Hybrid Electric Vehicles (PHEVs)
Global EV On-Board Battery Chargers Market, by Vehicle Type
  • Passenger Cars
  • Commercial Vehicles
Global EV On-Board Battery Chargers Market, by End User
  • OEMs (Original Equipment Manufacturers)
  • Aftermarket
Global EV On-Board Battery Chargers Market, by Region
  • North America
    • US
    • Canada
    • Mexico
  • Europe
    • UK
    • Germany
    • France
    • Italy
    • Spain
    • Benelux
    • Nordic
    • Rest of Europe
  • Asia Pacific
    • China
    • Japan
    • South Korea
    • Indonesia
    • Austalia
    • Malaysia
    • India
    • Rest of Asia Pacific
  • South America
    • Brazil
    • Argentina
    • Rest of South America
  • Middle East & Africa
    • Saudi Arabia
    • UAE
    • Egypt
    • South Africa
    • Rest of Middle East & Africa


Parameters Indicators
Market Size 2034: USD 25.88 Billion
CAGR (2024-2034) 18.21%
Base year 2022
Forecast Period 2024-2034
Historical Data 2021 (2017 to 2020 On Demand)
Report Coverage Revenue Forecast, Competitive Landscape, Growth Factors, and Trends
Key Segmentations Power Output, Propulsion Type, Vehicle Type, End User
Geographies Covered North America, Europe, Asia-Pacific, South America, Middle East, Africa
Key Vendors Tesla, Delta electronics, ABB, Valeo, WallBox, Charge Point, Fortum, Tata Power, Ather Energy and BP Pulse.
Key Market Opportunities ·        Wireless On-Board Charging Technologies

·        Growing Demand for Smart & Connected Charging Solutions

Key Market Drivers ·       Expansion of Charging Infrastructure

·       Rising Demand for High-Power On-Board Chargers


REPORT CONTENT BRIEF:

  • High-level analysis of the current and future EV On-Board Battery Chargers Market trends and opportunities
  • Detailed analysis of current market drivers, restraining factors, and opportunities in the future
  • EV On-Board Battery Chargers Market historical market size for the year 2021, and forecast from 2023 to 2033
  • EV On-Board Battery Chargers Market share analysis at each product level
  • Competitor analysis with detailed insight into its product segment, Government & Defense strength, and strategies adopted.
  • Identifies key strategies adopted including product launches and developments, mergers and acquisitions, joint ventures, collaborations, and partnerships as well as funding taken and investment done, among others.
  • To identify and understand the various factors involved in the global EV On-Board Battery Chargers Market affected by the pandemic
  • To provide a detailed insight into the major companies operating in the market. The profiling will include the Government & Defense health of the company’s past 2-3 years with segmental and regional revenue breakup, product offering, recent developments, SWOT analysis, and key strategies.

Frequently Asked Questions (FAQ)

The global EV On-Board Battery Chargers Market is growing at a CAGR of 18.21% over the next 10 years

Asia Pacific is expected to register the highest CAGR during 2024-2034

Tesla, Delta electronics, ABB, Valeo, WallBox, Charge Point, Fortum, Tata Power, Ather Energy and BP Pulse. are the major companies operating in the market.

Yes, we offer 16 hours of analyst support to solve the queries

Yes, we provide regional as well as country-level reports. Other than this we also provide a sectional report. Please get in contact with our sales representatives.

For more details mail us at

Ask a question / additional requirement

Table of Content

Table of Content

CHAPTER 1.         Executive Summary

CHAPTER 2.         Scope of the Study

2.1.       Market Definition

2.2.       Market Scope & Segmentation

2.2.1.        Objective of Report

CHAPTER 3.         Evolve BI Methodology

3.1.       Data Collection & Validation Approach

3.2.       Market Size Estimation and Forecast

CHAPTER 4.         Exclusive Analysis

4.1.       Market Opportunity Score

4.1.1.        Power Output Segement – Market Opportunity Score

4.1.2.        Propulsion Type Segment – Market Opportunity Score

4.1.3.        Vehicle Type Segment – Market Opportunity Score

4.1.4.        End User Segment – Market Opportunity Score

4.2.       Key Market Influencing Indicators

CHAPTER 5.         Market Insights and Trends

5.1.       Value Chain Analysis

5.1.1.        Raw Material

5.1.2.        Manufacturing Process

5.1.3.        Distribution Channel

5.1.4.        End User

5.2.       Porter’s Five Forces Analysis

5.2.1.        Bargaining Power of Buyers

5.2.2.        Bargaining Power of Suppliers

5.2.3.        Threat of New Entrant

5.2.4.        Threat of Substitute

5.2.5.        Industry Rivalry

5.3.       COVID-19 Impact and Post COVID Scenario on EV On-Board Battery Chargers Market

5.3.1.        Impact of COVID-19

5.3.2.        Government Support and Industry Revival Policies

5.3.3.        Measures Taken by Companies to Mitigate Negative Impact

5.3.4.        Post COVID Trend

CHAPTER 6.         MArket Dynamics

6.1.       Introduction

6.2.       Drivers

6.2.1.        Driver 1

6.2.2.        Driver 2

6.2.3.        Driver 3

6.3.       Restraints

6.3.1.        Restraint 1

6.3.2.        Restraint 2

6.4.       Opportunity

6.4.1.        Opportunity 1

CHAPTER 7.         EV On-Board Battery Chargers Market, By  Power Output

7.1.       Introduction

 7.1.1. Low-Power Chargers

 7.1.2.  Medium-Power Chargers

 7.1.3.   High-Power Chargers

CHAPTER 8.               EV On-Board Battery Chargers Market, By Propulsion Type

8.1.       Introduction

8.1.1.  Battery Electric Vehicles (BEVs)

8.1.2.  Plug-in Hybrid Electric Vehicles (PHEVs)

CHAPTER 9.         EV On-Board Battery Chargers Market, By Vehicle Type

9.1.       Introduction

      9.1.1.  Passenger Cars

      9.1.2.  Commercial Vehicles

CHAPTER 10.    EV On-Board Battery Chargers Market, By End User

10.1.Introduction

10.1.1.  OEMs (Original Equipment Manufacturers)

10.1.2.  Aftermarket

CHAPTER 11.             EV On-Board Battery Chargers Market, By Region

11.1.     Introduction

11.2.     NORTH AMERICA

11.2.1.      North America: Market Size and Forecast, By Country, 2024 – 2034  ($ Million)

11.2.2.      North America: Market Size and Forecast, By Power Output, 2024 – 2034  ($ Million)

11.2.3.      North America: Market Size and Forecast, By Propulsion Type, 2024 – 2034  ($ Million)

11.2.4.      North America: Market Size and Forecast, By Vehicle Type, 2024 – 2034  ($ Million)

11.2.5.      North America: Market Size and Forecast, By End User, 2024 – 2034  ($ Million)

11.2.6.      US

11.2.6.1.       US: Market Size and Forecast, By Power Output, 2024 – 2034  ($ Million)

11.2.6.2.       US: Market Size and Forecast, By Propulsion Type, 2024 – 2034  ($ Million)

11.2.6.3.       US: Market Size and Forecast, By Vehicle Type, 2024 – 2034  ($ Million)

11.2.6.4.       US: Market Size and Forecast, By End User, 2024 – 2034  ($ Million)

11.2.7.      CANADA

11.2.7.1.       Canada: Market Size and Forecast, By Power Output, 2024 – 2034  ($ Million)

11.2.7.2.       Canada: Market Size and Forecast, By Propulsion Type, 2024 – 2034  ($ Million)

11.2.7.3.       Canada: Market Size and Forecast, By Vehicle Type, 2024 – 2034  ($ Million)

11.2.7.4.       Canada: Market Size and Forecast, By End User, 2024 – 2034  ($ Million)

11.2.8.      MEXICO

11.2.8.1.       Mexico: Market Size and Forecast, By Power Output, 2024 – 2034  ($ Million)

11.2.8.2.       Mexico: Market Size and Forecast, By Propulsion Type, 2024 – 2034  ($ Million)

11.2.8.3.       Mexico: Market Size and Forecast, By Vehicle Type, 2024 – 2034  ($ Million)

11.2.8.4.       Mexico: Market Size and Forecast, By End User, 2024 – 2034  ($ Million)

11.3.     Europe

11.3.1.      Europe: Market Size and Forecast, By Country, 2024 – 2034  ($ Million)

11.3.2.      Europe: Market Size and Forecast, By Power Output, 2024 – 2034  ($ Million)

11.3.3.      Europe: Market Size and Forecast, By Propulsion Type, 2024 – 2034  ($ Million)

11.3.4.      Europe: Market Size and Forecast, By Vehicle Type, 2024 – 2034  ($ Million)

11.3.5.      Europe: Market Size and Forecast, By End User, 2024 – 2034  ($ Million)

11.3.6.      U.K.

11.3.6.1.       U.K.: Market Size and Forecast, By Power Output, 2024 – 2034  ($ Million)

11.3.6.2.       U.K.: Market Size and Forecast, By Propulsion Type, 2024 – 2034  ($ Million)

11.3.6.3.       U.K.: Market Size and Forecast, By Vehicle Type, 2024 – 2034  ($ Million)

11.3.6.4.       U.K.: Market Size and Forecast, By End User, 2024 – 2034  ($ Million)

11.3.7.      GERMANY

11.3.7.1.       Germany: Market Size and Forecast, By Power Output, 2024 – 2034  ($ Million)

11.3.7.2.       Germany: Market Size and Forecast, By Propulsion Type, 2024 – 2034  ($ Million)

11.3.7.3.       Germany: Market Size and Forecast, By Vehicle Type, 2024 – 2034  ($ Million)

11.3.7.4.       Germany: Market Size and Forecast, By End User, 2024 – 2034  ($ Million)

11.3.8.      FRANCE

11.3.8.1.       France: Market Size and Forecast, By Power Output, 2024 – 2034  ($ Million)

11.3.8.2.       France: Market Size and Forecast, By Propulsion Type, 2024 – 2034  ($ Million)

11.3.8.3.       France: Market Size and Forecast, By Vehicle Type, 2024 – 2034  ($ Million)

11.3.8.4.       France: Market Size and Forecast, By End User, 2024 – 2034  ($ Million)

11.3.9.      ITALY

11.3.9.1.       Italy: Market Size and Forecast, By Power Output, 2024 – 2034  ($ Million)

11.3.9.2.       Italy: Market Size and Forecast, By Propulsion Type, 2024 – 2034  ($ Million)

11.3.9.3.       Italy: Market Size and Forecast, By Vehicle Type, 2024 – 2034  ($ Million)

11.3.9.4.       Italy: Market Size and Forecast, By End User, 2024 – 2034  ($ Million)

11.3.10.        SPAIN

11.3.10.1.    Spain: Market Size and Forecast, By Power Output, 2024 – 2034  ($ Million)

11.3.10.2.    Spain: Market Size and Forecast, By Propulsion Type, 2024 – 2034  ($ Million)

11.3.10.3.    Spain: Market Size and Forecast, By Vehicle Type, 2024 – 2034  ($ Million)

11.3.10.4.    Spain: Market Size and Forecast, By End User, 2024 – 2034  ($ Million)

11.3.11.        BENELUX

11.3.11.1.    BeNeLux: Market Size and Forecast, By Power Output, 2024 – 2034  ($ Million)

11.3.11.2.    BeNeLux: Market Size and Forecast, By Propulsion Type, 2024 – 2034  ($ Million)

11.3.11.3.    BeNeLux: Market Size and Forecast, By Vehicle Type, 2024 – 2034  ($ Million)

11.3.11.4.    BeNeLux: Market Size and Forecast, By End User, 2024 – 2034  ($ Million)

11.3.12.        RUSSIA

11.3.12.1.    Russia: Market Size and Forecast, By Power Output, 2024 – 2034  ($ Million)

11.3.12.2.    Russia: Market Size and Forecast, By Propulsion Type, 2024 – 2034  ($ Million)

11.3.12.3.    Russia: Market Size and Forecast, By Vehicle Type, 2024 – 2034  ($ Million)

11.3.12.4.    Russia: Market Size and Forecast, By End User, 2024 – 2034  ($ Million)

11.3.13.        REST OF EUROPE

11.3.13.1.    Rest of Europe: Market Size and Forecast, By Power Output, 2024 – 2034  ($ Million)

11.3.13.2.    Rest of Europe: Market Size and Forecast, By Propulsion Type, 2024 – 2034  ($ Million)

11.3.13.3.    Rest of Europe: Market Size and Forecast, By Vehicle Type, 2024 – 2034  ($ Million)

11.3.13.4.    Rest of Europe: Market Size and Forecast, By End User, 2024 – 2034  ($ Million)

11.4.     Asia Pacific

11.4.1.      Asia Pacific: Market Size and Forecast, By Country, 2024 – 2034  ($ Million)

11.4.2.      Asia Pacific: Market Size and Forecast, By Power Output, 2024 – 2034  ($ Million)

11.4.3.      Asia Pacific: Market Size and Forecast, By Propulsion Type, 2024 – 2034  ($ Million)

11.4.4.      Asia Pacific: Market Size and Forecast, By Vehicle Type, 2024 – 2034  ($ Million)

11.4.5.      Asia Pacific: Market Size and Forecast, By End User, 2024 – 2034  ($ Million)

11.4.6.      CHINA

11.4.6.1.       China: Market Size and Forecast, By Power Output, 2024 – 2034  ($ Million)

11.4.6.2.       China: Market Size and Forecast, By Propulsion Type, 2024 – 2034  ($ Million)

11.4.6.3.       China: Market Size and Forecast, By Vehicle Type, 2024 – 2034  ($ Million)

11.4.6.4.       China: Market Size and Forecast, By End User, 2024 – 2034  ($ Million)

11.4.7.      JAPAN

11.4.7.1.       Japan: Market Size and Forecast, By Power Output, 2024 – 2034  ($ Million)

11.4.7.2.       Japan: Market Size and Forecast, By Propulsion Type, 2024 – 2034  ($ Million)

11.4.7.3.       Japan: Market Size and Forecast, By Vehicle Type, 2024 – 2034  ($ Million)

11.4.7.4.       Japan: Market Size and Forecast, By End User, 2024 – 2034  ($ Million)

11.4.8.      INDIA

11.4.8.1.       India: Market Size and Forecast, By Power Output, 2024 – 2034  ($ Million)

11.4.8.2.       India: Market Size and Forecast, By Propulsion Type, 2024 – 2034  ($ Million)

11.4.8.3.       India: Market Size and Forecast, By Vehicle Type, 2024 – 2034  ($ Million)

11.4.8.4.       India: Market Size and Forecast, By End User, 2024 – 2034  ($ Million)

11.4.9.      SOUTH KOREA

11.4.9.1.       South Korea: Market Size and Forecast, By Power Output, 2024 – 2034  ($ Million)

11.4.9.2.       South Korea: Market Size and Forecast, By Propulsion Type, 2024 – 2034  ($ Million)

11.4.9.3.       South Korea: Market Size and Forecast, By Vehicle Type, 2024 – 2034  ($ Million)

11.4.9.4.       South Korea: Market Size and Forecast, By End User, 2024 – 2034  ($ Million)

11.4.10.        THAILAND

11.4.10.1.    Thailand: Market Size and Forecast, By Power Output, 2024 – 2034  ($ Million)

11.4.10.2.    Thailand: Market Size and Forecast, By Propulsion Type, 2024 – 2034  ($ Million)

11.4.10.3.    Thailand: Market Size and Forecast, By Vehicle Type, 2024 – 2034  ($ Million)

11.4.10.4.    Thailand: Market Size and Forecast, By End User, 2024 – 2034  ($ Million)

11.4.11.        INDONESIA

11.4.11.1.    Indonesia: Market Size and Forecast, By Power Output, 2024 – 2034  ($ Million)

11.4.11.2.    Indonesia: Market Size and Forecast, By Propulsion Type, 2024 – 2034  ($ Million)

11.4.11.3.    Indonesia: Market Size and Forecast, By Vehicle Type, 2024 – 2034  ($ Million)

11.4.11.4.    Indonesia: Market Size and Forecast, By End User, 2024 – 2034  ($ Million)

11.4.12.        MALAYSIA

11.4.12.1.    Malaysia: Market Size and Forecast, By Power Output, 2024 – 2034  ($ Million)

11.4.12.2.    Malaysia: Market Size and Forecast, By Propulsion Type, 2024 – 2034  ($ Million)

11.4.12.3.    Malaysia: Market Size and Forecast, By Vehicle Type, 2024 – 2034  ($ Million)

11.4.12.4.    Malaysia: Market Size and Forecast, By End User, 2024 – 2034  ($ Million)

11.4.13.        AUSTRALIA

11.4.13.1.    Australia: Market Size and Forecast, By Power Output, 2024 – 2034  ($ Million)

11.4.13.2.    Australia: Market Size and Forecast, By Propulsion Type, 2024 – 2034  ($ Million)

11.4.13.3.    Australia: Market Size and Forecast, By Vehicle Type, 2024 – 2034  ($ Million)

11.4.13.4.    Australia: Market Size and Forecast, By End User, 2024 – 2034  ($ Million)

11.4.14.        REST FO ASIA PACIFIC

11.4.14.1.    Rest fo Asia Pacific: Market Size and Forecast, By Power Output, 2024 – 2034  ($ Million)

11.4.14.2.    Rest fo Asia Pacific: Market Size and Forecast, By Propulsion Type, 2024 – 2034  ($ Million)

11.4.14.3.    Rest fo Asia Pacific: Market Size and Forecast, By Vehicle Type, 2024 – 2034  ($ Million)

11.4.14.4.    Rest fo Asia Pacific: Market Size and Forecast, By End User, 2024 – 2034  ($ Million)

11.5.     South America

11.5.1.      South America: Market Size and Forecast, By Country, 2024 – 2034  ($ Million)

11.5.2.      South America: Market Size and Forecast, By Power Output, 2024 – 2034  ($ Million)

11.5.3.      South America: Market Size and Forecast, By Propulsion Type, 2024 – 2034  ($ Million)

11.5.4.      South America: Market Size and Forecast, By Vehicle Type, 2024 – 2034  ($ Million)

11.5.5.      South America: Market Size and Forecast, By End User, 2024 – 2034  ($ Million)

11.5.6.      BRAZIL

11.5.6.1.       Brazil: Market Size and Forecast, By Power Output, 2024 – 2034  ($ Million)

11.5.6.2.       Brazil: Market Size and Forecast, By Propulsion Type, 2024 – 2034  ($ Million)

11.5.6.3.       Brazil: Market Size and Forecast, By Vehicle Type, 2024 – 2034  ($ Million)

11.5.6.4.       Brazil: Market Size and Forecast, By End User, 2024 – 2034  ($ Million)

11.5.7.      ARGENTINA

11.5.7.1.       Argentina: Market Size and Forecast, By Power Output, 2024 – 2034  ($ Million)

11.5.7.2.       Argentina: Market Size and Forecast, By Propulsion Type, 2024 – 2034  ($ Million)

11.5.7.3.       Argentina: Market Size and Forecast, By Vehicle Type, 2024 – 2034  ($ Million)

11.5.7.4.       Argentina: Market Size and Forecast, By End User, 2024 – 2034  ($ Million)

11.5.8.      REST OF SOUTH AMERICA

11.5.8.1.       Rest of South America: Market Size and Forecast, By Power Output, 2024 – 2034  ($ Million)

11.5.8.2.       Rest of South America: Market Size and Forecast, By Propulsion Type, 2024 – 2034  ($ Million)

11.5.8.3.       Rest of South America: Market Size and Forecast, By Vehicle Type, 2024 – 2034  ($ Million)

11.5.8.4.       Rest of South America: Market Size and Forecast, By End User, 2024 – 2034  ($ Million)

11.6.     Middle East & Africa

11.6.1.      Middle East & Africa: Market Size and Forecast, By Country, 2024 – 2034  ($ Million)

11.6.2.      Middle East & Africa: Market Size and Forecast, By Power Output, 2024 – 2034  ($ Million)

11.6.3.      Middle East & Africa: Market Size and Forecast, By Propulsion Type, 2024 – 2034  ($ Million)

11.6.4.      Middle East & Africa: Market Size and Forecast, By Vehicle Type, 2024 – 2034  ($ Million)

11.6.5.      Middle East & Africa: Market Size and Forecast, By End User, 2024 – 2034  ($ Million)

11.6.6.      SAUDI ARABIA

11.6.6.1.       Saudi Arabia: Market Size and Forecast, By Power Output, 2024 – 2034  ($ Million)

11.6.6.2.       Saudi Arabia: Market Size and Forecast, By Propulsion Type, 2024 – 2034  ($ Million)

11.6.6.3.       Saudi Arabia: Market Size and Forecast, By Vehicle Type, 2024 – 2034  ($ Million)

11.6.6.4.       Saudi Arabia: Market Size and Forecast, By End User, 2024 – 2034  ($ Million)

11.6.7.      UAE

11.6.7.1.       UAE: Market Size and Forecast, By Power Output, 2024 – 2034  ($ Million)

11.6.7.2.       UAE: Market Size and Forecast, By Propulsion Type, 2024 – 2034  ($ Million)

11.6.7.3.       UAE: Market Size and Forecast, By Vehicle Type, 2024 – 2034  ($ Million)

11.6.7.4.       UAE: Market Size and Forecast, By End User, 2024 – 2034  ($ Million)

11.6.8.      EGYPT

11.6.8.1.       Egypt: Market Size and Forecast, By Power Output, 2024 – 2034  ($ Million)

11.6.8.2.       Egypt: Market Size and Forecast, By Propulsion Type, 2024 – 2034  ($ Million)

11.6.8.3.       Egypt: Market Size and Forecast, By Vehicle Type, 2024 – 2034  ($ Million)

11.6.8.4.       Egypt: Market Size and Forecast, By End User, 2024 – 2034  ($ Million)

11.6.9.      SOUTH AFRICA

11.6.9.1.       South Africa: Market Size and Forecast, By Power Output, 2024 – 2034  ($ Million)

11.6.9.2.       South Africa: Market Size and Forecast, By Propulsion Type, 2024 – 2034  ($ Million)

11.6.9.3.       South Africa: Market Size and Forecast, By Vehicle Type, 2024 – 2034  ($ Million)

11.6.9.4.       South Africa: Market Size and Forecast, By End User, 2024 – 2034  ($ Million)

11.6.10.        REST OF MIDDLE EAST & AFRICA

11.6.10.1.    Rest of Middle East & Africa: Market Size and Forecast, By Power Output, 2024 – 2034  ($ Million)

11.6.10.2.    Rest of Middle East & Africa: Market Size and Forecast, By Propulsion Type, 2024 – 2034  ($ Million)

11.6.10.3.    Rest of Middle East & Africa: Market Size and Forecast, By Vehicle Type, 2024 – 2034  ($ Million)

11.6.10.4.    Rest of Middle East & Africa: Market Size and Forecast, By End User, 2024 – 2034  ($ Million)

CHAPTER 12.       Competitive Landscape

12.1.     Competitior Benchmarking 2024

12.2.     Market Share Analysis

12.3.     Key Developments Analysis By Top 5 Companies

12.4.     Market Share Acquisition Strategies: Analysis of Key Approaches Employed by Top Players

CHAPTER 13.       Company Profiles

13.1.     Tesla

13.1.1. Business Overview

13.1.2. Financial Analysis

13.1.2.1. Business Segment Revenue, 2018, 2019, 2020, $ Million

13.1.2.2. Geographic Revenue Mix, 2020 (% Share)

13.1.3. Product Portfolio

13.1.4. Recent Development and Strategies Adopted

13.1.5. SWOT Analysis

13.2.     Delta electronics

13.3.     ABB

13.4.    Valeo

13.5.     WallBox

13.6.    Charge Point

13.7.     Fortum

13.8.     Tata Power

13.9.    Ather Energy

13.10.  BP Pulse.


Connect to Analyst

Connect to Analyst

Research Methodology

Research Methodology