Cross-border E-commerce Logistics Market Analysis and Global Forecast 2024-2034
$ 1,390.00 – $ 5,520.00
Cross-border E-commerce Logistics Market Research Report: Information By Logistics Mode (Air Freight, Ocean Freight, Road Freight, Railway Freight, Third Party Logistics), By Delivery Type (Standard Delivery, Same-day Delivery), End Use (Apparels, Consumer Electronics, Automotive, Healthcare, Food and Beverage, Others), and by Region — Forecast till 2034
Page: 165
Cross-border E-commerce Logistics Market Overview
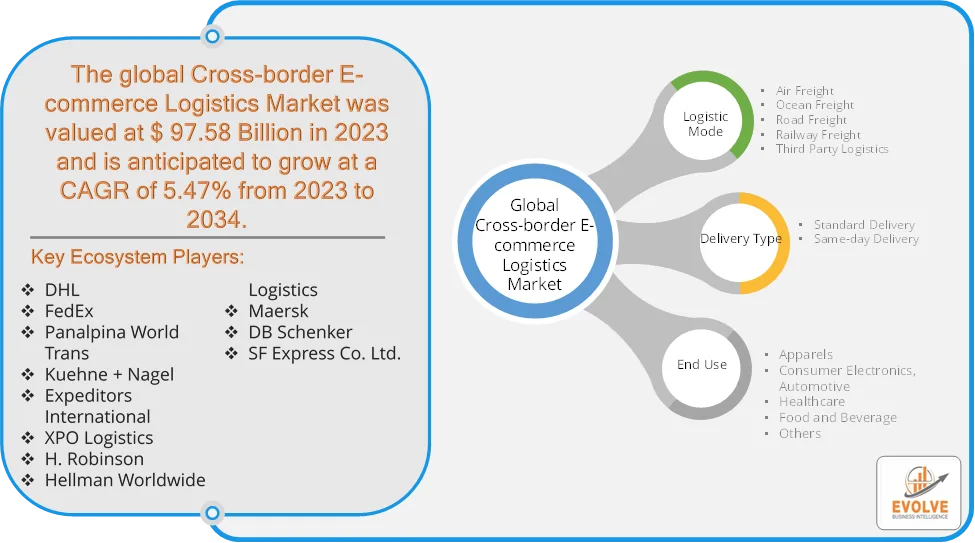
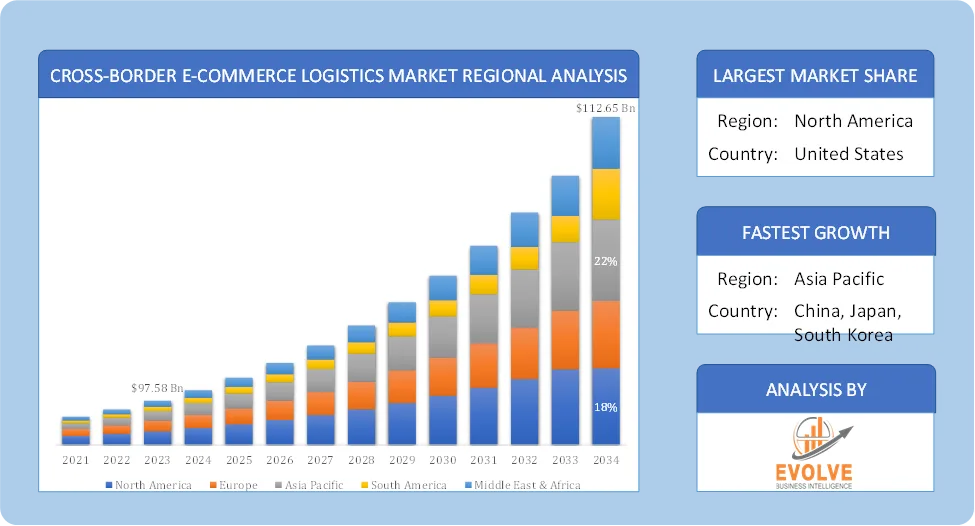
The Cross-border E-commerce Logistics Market size accounted for USD 97.58 Billion in 2023 and is estimated to account for 102.36 Billion in 2024. The Market is expected to reach USD 112.65 Billion by 2034 growing at a compound annual growth rate (CAGR) of 5.47% from 2024 to 2034. The cross-border e-commerce logistics market is experiencing significant growth, driven by the increasing popularity of online shopping and the desire of consumers to access a wider range of products from international markets. This necessitates sophisticated logistics networks to manage the complexities of international shipments, including transportation, warehousing, customs clearance, and last-mile delivery.
The cross-border e-commerce logistics market is dynamic and continues to evolve rapidly. Businesses that can effectively navigate the complexities and leverage emerging trends will be well-positioned to capitalize on the significant growth opportunities in this global marketplace.
Global Cross-border E-commerce Logistics Market Synopsis
Cross-border E-commerce Logistics Market Dynamics
The major factors that have impacted the growth of Cross-border E-commerce Logistics Market are as follows:
Drivers:
Ø Global Expansion of E-commerce
The rapid increase in online shopping worldwide has heightened the demand for efficient international logistics solutions. Consumers are increasingly purchasing products from overseas retailers, necessitating robust cross-border shipping and delivery services. Innovations such as blockchain technology, artificial intelligence (AI), and automation have enhanced supply chain efficiency and transparency. These technologies enable logistics providers to streamline operations, reduce costs, and improve delivery times. Enhancements in shipping options, such as faster air cargo services and efficient customs clearance procedures, have reduced delivery times and costs. These improvements make cross-border purchases more appealing to consumers and support the expansion of international e-commerce.
Restraint:
- High Logistics Costs and Infrastructure Limitations
International shipping often incurs higher expenses than domestic deliveries due to longer distances, multiple transportation modes, and additional fees like customs duties and value-added taxes (VAT). These costs can significantly impact e-commerce businesses’ profitability and lead to higher prices for consumers. Inadequate delivery infrastructure in certain regions can cause delays and inefficiencies in cross-border e-commerce logistics. Poor roads, limited connectivity, and congested ports or airports hinder the timely movement of goods, affecting customer satisfaction and increasing operational costs.
Opportunity:
⮚ Infrastructure Development
The integration of technologies such as blockchain, Internet of Things (IoT), and artificial intelligence (AI) is revolutionizing logistics operations. These innovations enhance supply chain transparency, improve tracking systems, and optimize delivery routes, leading to cost reductions and heightened customer satisfaction. Investments in logistics infrastructure, including warehouses, distribution centers, and transportation networks, are crucial to support the escalating demand in cross-border e-commerce.
Cross-border E-commerce Logistics Market Segment Overview
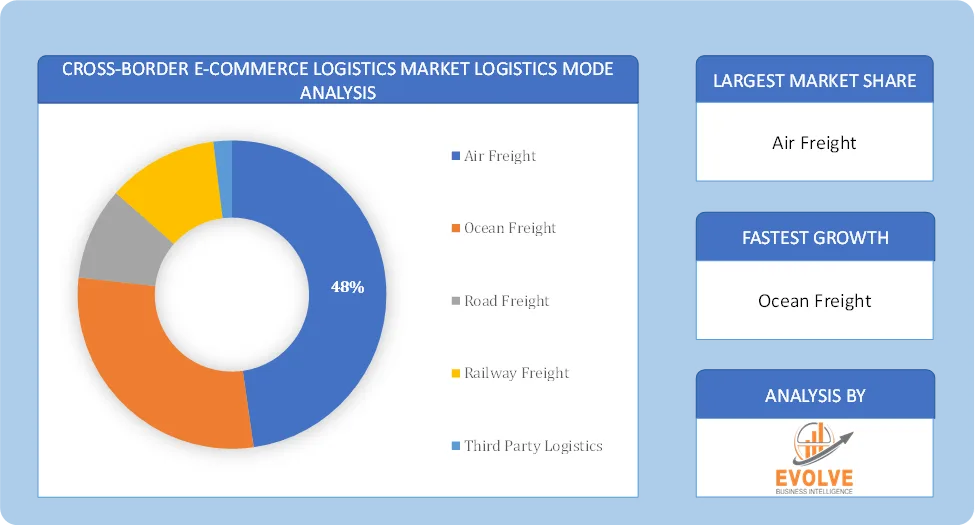
Based on Logistics Mode, the market is segmented based on Air Freight, Ocean Freight, Road Freight, Railway Freight, Third Party Logistics. The Ocean Freight segment dominant the market. Ocean freight is generally more economical than air freight, making it suitable for shipping large volumes of goods where transit time is less critical. Freight forwarders are leveraging technology to optimize operations, offering value-added services like real-time tracking and inventory management to improve efficiency and customer satisfaction.
By Delivery Type
Based on Delivery Type, the market segment has been divided into Standard Delivery, Same-day Delivery. The Standard Delivery segment dominant the market. Standard delivery remains the most common option in cross-border e-commerce logistics, primarily due to its cost-effectiveness. The rise of online marketplaces has bolstered the standard delivery segment. Platforms like Amazon, Alibaba, and eBay have made it easier for sellers to reach international customers, who opt for standard delivery due to its affordability.
By End Use
Based on End Use, the market segment has been divided into Apparels, Consumer Electronics, Automotive, Healthcare, Food and Beverage, Others. The rapid spread of fashion trends across borders has fueled the demand for international apparel brands. Social media platforms and influencers play a significant role in promoting these trends, driving consumers to seek products from different parts of the world. Advanced technologies like AI and big data are enhancing the consumer shopping experience by offering personalized recommendations and seamless cross-border transactions.
Global Cross-border E-commerce Logistics Market Regional Analysis
Based on region, the global Cross-border E-commerce Logistics Market has been divided into North America, Europe, Asia-Pacific, the Middle East & Africa, and Latin America. North America is projected to dominate the use of the Cross-border E-commerce Logistics Market followed by the Asia-Pacific and Europe regions.
North America Cross-border E-commerce Logistics Market
North America holds a dominant position in the Cross-border E-commerce Logistics Market. The headquarters of global e-commerce giants like Amazon and eBay in North America contribute significantly to cross-border trade and logistics activities. The region boasts a well-established and advanced logistics infrastructure, facilitating efficient cross-border transportation and delivery and Consumers in North America often seek out unique or competitively priced products from overseas markets.
Asia-Pacific Cross-border E-commerce Logistics Market
The Asia-Pacific region has indeed emerged as the fastest-growing market for the Cross-border E-commerce Logistics Market industry. China as the world’s largest e-commerce market, China is a major driver of cross-border logistics in the region, with significant import and export volumes and With a rapidly growing internet user base and increasing adoption of online shopping, India presents a substantial growth opportunity for cross-border e-commerce logistics. Growing economic prosperity, particularly in countries like China and India, increases consumers’ purchasing power and their willingness to buy international goods.
Competitive Landscape
The global Cross-border E-commerce Logistics Market is highly competitive, with numerous players offering a wide range of software solutions. The competitive landscape is characterized by the presence of established companies, as well as emerging startups and niche players. To increase their market position and attract a wide consumer base, the businesses are employing various strategies, such as product launches, and strategic alliances.
Prominent Players:
- DHL
- FedEx
- Panalpina World Trans
- Kuehne + Nagel
- Expeditors International
- XPO Logistics
- Robinson
- Hellman Worldwide Logistics
- Maersk
- DB Schenker
- SF Express Co. Ltd.
Scope of the Report
Global Cross-border E-commerce Logistics Market, by Logistics Mode
- Air Freight
- Ocean Freight
- Road Freight
- Railway Freight
- Third Party Logistics
Global Cross-border E-commerce Logistics Market, by Delivery Type
- Standard Delivery
- Same-day Delivery
Global Cross-border E-commerce Logistics Market, by End Use
- Apparels
- Consumer Electronics
- Automotive
- Healthcare
- Food and Beverage
- Others
Global Cross-border E-commerce Logistics Market, by Region
- North America
- US
- Canada
- Mexico
- Europe
- UK
- Germany
- France
- Italy
- Spain
- Benelux
- Nordic
- Rest of Europe
- Asia Pacific
- China
- Japan
- South Korea
- Indonesia
- Austalia
- Malaysia
- India
- Rest of Asia Pacific
- South America
- Brazil
- Argentina
- Rest of South America
- Middle East & Africa
- Saudi Arabia
- UAE
- Egypt
- South Africa
- Rest of Middle East & Africa
Parameters | Indicators |
---|---|
Market Size | 2034: USD 112.65 Billion |
CAGR (2024-2034) | 5.47% |
Base year | 2022 |
Forecast Period | 2024-2034 |
Historical Data | 2021 (2017 to 2020 On Demand) |
Report Coverage | Revenue Forecast, Competitive Landscape, Growth Factors, and Trends |
Key Segmentations | Logistics Mode, Delivery Type, End Use |
Geographies Covered | North America, Europe, Asia-Pacific, South America, Middle East, Africa |
Key Vendors | DHL, FedEx, Panalpina World Trans, Kuehne + Nagel, Expeditors International, XPO Logistics, H. Robinson, Hellman Worldwide Logistics, Maersk, DB Schenker and SF Express Co. Ltd. |
Key Market Opportunities | · Infrastructure Development |
Key Market Drivers | · Global Expansion of E-commerce
· Technological Advancements |
REPORT CONTENT BRIEF:
- High-level analysis of the current and future Cross-border E-commerce Logistics Market trends and opportunities
- Detailed analysis of current market drivers, restraining factors, and opportunities in the future
- Cross-border E-commerce Logistics Market historical market size for the year 2021, and forecast from 2023 to 2033
- Cross-border E-commerce Logistics Market share analysis at each product level
- Competitor analysis with detailed insight into its product segment, Government & Defense strength, and strategies adopted.
- Identifies key strategies adopted including product launches and developments, mergers and acquisitions, joint ventures, collaborations, and partnerships as well as funding taken and investment done, among others.
- To identify and understand the various factors involved in the global Cross-border E-commerce Logistics Market affected by the pandemic
- To provide a detailed insight into the major companies operating in the market. The profiling will include the Government & Defense health of the company’s past 2-3 years with segmental and regional revenue breakup, product offering, recent developments, SWOT analysis, and key strategies.
Frequently Asked Questions (FAQ)
What is the study period of this market?
The study period of the global Cross-border E-commerce Logistics Market is 2021- 2033
What is the growth rate of the global Cross-border E-commerce Logistics Market?
The global Cross-border E-commerce Logistics Market is growing at a CAGR of 5.47% over the next 10 years
Which region has the highest growth rate in the market of Cross-border E-commerce Logistics Market?
Asia Pacific is expected to register the highest CAGR during 2024-2034
Which region has the largest share of the global Cross-border E-commerce Logistics Market?
North America holds the largest share in 2022
Who are the key players in the global Cross-border E-commerce Logistics Market?
DHL, FedEx, Panalpina World Trans, Kuehne + Nagel, Expeditors International, XPO Logistics, H. Robinson, Hellman Worldwide Logistics, Maersk, DB Schenker and SF Express Co. Ltd. are the major companies operating in the market.
Do you offer Post Sale Support?
Yes, we offer 16 hours of analyst support to solve the queries
Do you sell particular sections of a report?
Yes, we provide regional as well as country-level reports. Other than this we also provide a sectional report. Please get in contact with our sales representatives.
Press Release
Cross-border E-commerce Logistics Market to Reach USD 112.65 Billion by 2034
Basic Silicone Market to Reach USD 28.74 Billion by 2034
Active Insulation Market to Reach USD 5.88 Billion by 2034
Procurement Management Services Market to Reach USD 16.21 Billion by 2034
Antiseptic Soaps Market to Reach USD 5.87 Billion by 2034
Adventure Sports Travel Insurance Market to Reach USD 14.35 Billion by 2034
Pet Care Market to Reach USD 325.65 Billion by 2034
International Legal Services Market to Reach USD 4235.56 Billion by 2034
Global Business Process Automation Software Market Forecast to Reach USD 23.88 Billion by 2034, Growing at an 11.85% CAGR
Global Aviation Carbon Fiber Market Forecast to Reach USD 8.41 Billion by 2034, Growing at an 11.93% CAGR
Table of Content
CHAPTER 1. Executive Summary
CHAPTER 2. Scope of the Study
2.1. Market Definition
2.2. Market Scope & Segmentation
2.2.1. Objective of Report
CHAPTER 3. Evolve BI Methodology
3.1. Data Collection & Validation Approach
3.2. Market Size Estimation and Forecast
CHAPTER 4. Exclusive Analysis
4.1. Market Opportunity Score
4.1.1. Logistics Mode Segement – Market Opportunity Score
4.1.2. Delivery Type Segment – Market Opportunity Score
4.1.3. End Use Segment – Market Opportunity Score
4.2. Key Market Influencing Indicators
CHAPTER 5. Market Insights and Trends
5.1. Value Chain Analysis
5.1.1. Raw Material
5.1.2. Manufacturing Process
5.1.3. Distribution Channel
5.1.4. End User
5.2. Porter’s Five Forces Analysis
5.2.1. Bargaining Power of Buyers
5.2.2. Bargaining Power of Suppliers
5.2.3. Threat of New Entrant
5.2.4. Threat of Substitute
5.2.5. Industry Rivalry
5.3. COVID-19 Impact and Post COVID Scenario on Cross-border E-commerce Logistics Market Market
5.3.1. Impact of COVID-19
5.3.2. Government Support and Industry Revival Policies
5.3.3. Measures Taken by Companies to Mitigate Negative Impact
5.3.4. Post COVID Trend
CHAPTER 6. Market Dynamics
6.1. Introduction
6.2. Drivers
6.2.1. Driver 1
6.2.2. Driver 2
6.2.3. Driver 3
6.3. Restraints
6.3.1. Restraint 1
6.3.2. Restraint 2
6.4. Opportunity
6.4.1. Opportunity 1
CHAPTER 7. Cross-border E-commerce Logistics Market Market, By Logistics Mode
7.1. Introduction
7.1.1. Air Freight
7.1.2 Ocean Freight
7.1.3. Road Freight
7.1.4. Railway Freight
7.1.5. Third Party Logistics
CHAPTER 8 Cross-border E-commerce Logistics Market Market, By Delivery Type
8.1. Introduction
8.1.1. Standard Delivery
8.1.2. Same-day Delivery
CHAPTER 9. Cross-border E-commerce Logistics Market Market, By End Use
9.1. Introduction
9.1.1. Apparels
9.1.2. Consumer Electronics
9.1.3. Automotive
9.1.4. Healthcare
9.1.5. Food and Beverage
9.1.6. Others
CHAPTER 10. Cross-border E-commerce Logistics Market Market, By Region
10.1. Introduction
10.2. NORTH AMERICA
10.2.1. North America: Market Size and Forecast, By Country, 2024 – 2034($ Million)
10.2.2. North America: Market Size and Forecast, By Logistics Mode, 2024 – 2034($ Million)
10.2.3. North America: Market Size and Forecast, By Delivery Type, 2024 – 2034($ Million)
10.2.4. North America: Market Size and Forecast, By End Use, 2024 – 2034($ Million)
10.2.5. US
10.2.5.1. US: Market Size and Forecast, By Logistics Mode, 2024 – 2034($ Million)
10.2.5.2. US: Market Size and Forecast, By Delivery Type, 2024 – 2034($ Million)
10.2.5.3. US: Market Size and Forecast, By End Use, 2024 – 2034($ Million)
10.2.6. CANADA
10.2.6.1. Canada: Market Size and Forecast, By Logistics Mode, 2024 – 2034($ Million)
10.2.6.2. Canada: Market Size and Forecast, By Delivery Type, 2024 – 2034($ Million)
10.2.6.3. Canada: Market Size and Forecast, By End Use, 2024 – 2034($ Million)
10.2.7. MEXICO
10.2.7.1. Mexico: Market Size and Forecast, By Logistics Mode, 2024 – 2034($ Million)
10.2.7.2. Mexico: Market Size and Forecast, By Delivery Type, 2024 – 2034($ Million)
10.2.7.3. Mexico: Market Size and Forecast, By End Use, 2024 – 2034($ Million)
10.3. Europe
10.3.1. Europe: Market Size and Forecast, By Country, 2024 – 2034($ Million)
10.3.2. Europe: Market Size and Forecast, By Logistics Mode, 2024 – 2034($ Million)
10.3.3. Europe: Market Size and Forecast, By Delivery Type, 2024 – 2034($ Million)
10.3.4. Europe: Market Size and Forecast, By End Use, 2024 – 2034($ Million)
10.3.5. U.K.
10.3.5.1. U.K.: Market Size and Forecast, By Logistics Mode, 2024 – 2034($ Million)
10.3.5.2. U.K.: Market Size and Forecast, By Delivery Type, 2024 – 2034($ Million)
10.3.5.3. U.K.: Market Size and Forecast, By End Use, 2024 – 2034($ Million)
10.3.6. GERMANY
10.3.6.1. Germany: Market Size and Forecast, By Logistics Mode, 2024 – 2034($ Million)
10.3.6.2. Germany: Market Size and Forecast, By Delivery Type, 2024 – 2034($ Million)
10.3.6.3. Germany: Market Size and Forecast, By End Use, 2024 – 2034($ Million)
10.3.7. FRANCE
10.3.7.1. France: Market Size and Forecast, By Logistics Mode, 2024 – 2034($ Million)
10.3.7.2. France: Market Size and Forecast, By Delivery Type, 2024 – 2034($ Million)
10.3.7.3. France: Market Size and Forecast, By End Use, 2024 – 2034($ Million)
10.3.8. ITALY
10.3.8.1. Italy: Market Size and Forecast, By Logistics Mode, 2024 – 2034($ Million)
10.3.8.2. Italy: Market Size and Forecast, By Delivery Type, 2024 – 2034($ Million)
10.3.8.3. Italy: Market Size and Forecast, By End Use, 2024 – 2034($ Million)
10.3.9. SPAIN
10.3.9.1. Spain: Market Size and Forecast, By Logistics Mode, 2024 – 2034($ Million)
10.3.9.2. Spain: Market Size and Forecast, By Delivery Type, 2024 – 2034($ Million)
10.3.9.3. Spain: Market Size and Forecast, By End Use, 2024 – 2034($ Million)
10.3.10. BENELUX
10.3.10.1. BeNeLux: Market Size and Forecast, By Logistics Mode, 2024 – 2034($ Million)
10.3.10.2. BeNeLux: Market Size and Forecast, By Delivery Type, 2024 – 2034($ Million)
10.3.10.3. BeNeLux: Market Size and Forecast, By End Use, 2024 – 2034($ Million)
10.3.11. RUSSIA
10.3.11.1. Russia: Market Size and Forecast, By Logistics Mode, 2024 – 2034($ Million)
10.3.11.2. Russia: Market Size and Forecast, By Delivery Type, 2024 – 2034($ Million)
10.3.11.3. Russia: Market Size and Forecast, By End Use, 2024 – 2034($ Million)
10.3.12. REST OF EUROPE
10.3.12.1. Rest of Europe: Market Size and Forecast, By Logistics Mode, 2024 – 2034($ Million)
10.3.12.2. Rest of Europe: Market Size and Forecast, By Delivery Type, 2024 – 2034($ Million)
10.3.12.3. Rest of Europe: Market Size and Forecast, By End Use, 2024 – 2034($ Million)
10.4. Asia Pacific
10.4.1. Asia Pacific: Market Size and Forecast, By Country, 2024 – 2034($ Million)
10.4.2. Asia Pacific: Market Size and Forecast, By Logistics Mode, 2024 – 2034($ Million)
10.4.3. Asia Pacific: Market Size and Forecast, By Delivery Type, 2024 – 2034($ Million)
10.4.4. Asia Pacific: Market Size and Forecast, By End Use, 2024 – 2034($ Million)
10.4.5. CHINA
10.4.5.1. China: Market Size and Forecast, By Logistics Mode, 2024 – 2034($ Million)
10.4.5.2. China: Market Size and Forecast, By Delivery Type, 2024 – 2034($ Million)
10.4.5.3. China: Market Size and Forecast, By End Use, 2024 – 2034($ Million)
10.4.6. JAPAN
10.4.6.1. Japan: Market Size and Forecast, By Logistics Mode, 2024 – 2034($ Million)
10.4.6.2. Japan: Market Size and Forecast, By Delivery Type, 2024 – 2034($ Million)
10.4.6.3. Japan: Market Size and Forecast, By End Use, 2024 – 2034($ Million)
10.4.7. INDIA
10.4.7.1. India: Market Size and Forecast, By Logistics Mode, 2024 – 2034($ Million)
10.4.7.2. India: Market Size and Forecast, By Delivery Type, 2024 – 2034($ Million)
10.4.7.3. India: Market Size and Forecast, By End Use, 2024 – 2034($ Million)
10.4.8. SOUTH KOREA
10.4.8.1. South Korea: Market Size and Forecast, By Logistics Mode, 2024 – 2034($ Million)
10.4.8.2. South Korea: Market Size and Forecast, By Delivery Type, 2024 – 2034($ Million)
10.4.8.3. South Korea: Market Size and Forecast, By End Use, 2024 – 2034($ Million)
10.4.9. THAILAND
10.4.9.1. Thailand: Market Size and Forecast, By Logistics Mode, 2024 – 2034($ Million)
10.4.9.2. Thailand: Market Size and Forecast, By Delivery Type, 2024 – 2034($ Million)
10.4.9.3. Thailand: Market Size and Forecast, By End Use, 2024 – 2034($ Million)
10.4.10. INDONESIA
10.4.10.1. Indonesia: Market Size and Forecast, By Logistics Mode, 2024 – 2034($ Million)
10.4.10.2. Indonesia: Market Size and Forecast, By Delivery Type, 2024 – 2034($ Million)
10.4.10.3. Indonesia: Market Size and Forecast, By End Use, 2024 – 2034($ Million)
10.4.11. MALAYSIA
10.4.11.1. Malaysia: Market Size and Forecast, By Logistics Mode, 2024 – 2034($ Million)
10.4.11.2. Malaysia: Market Size and Forecast, By Delivery Type, 2024 – 2034($ Million)
10.4.11.3. Malaysia: Market Size and Forecast, By End Use, 2024 – 2034($ Million)
10.4.12. AUSTRALIA
10.4.12.1. Australia: Market Size and Forecast, By Logistics Mode, 2024 – 2034($ Million)
10.4.12.2. Australia: Market Size and Forecast, By Delivery Type, 2024 – 2034($ Million)
10.4.12.3. Australia: Market Size and Forecast, By End Use, 2024 – 2034($ Million)
10.4.13. REST FO ASIA PACIFIC
10.4.13.1. Rest fo Asia Pacific: Market Size and Forecast, By Logistics Mode, 2024 – 2034($ Million)
10.4.13.2. Rest fo Asia Pacific: Market Size and Forecast, By Delivery Type, 2024 – 2034($ Million)
10.4.13.3. Rest fo Asia Pacific: Market Size and Forecast, By End Use, 2024 – 2034($ Million)
10.5. South America
10.5.1. South America: Market Size and Forecast, By Country, 2024 – 2034($ Million)
10.5.2. South America: Market Size and Forecast, By Logistics Mode, 2024 – 2034($ Million)
10.5.3. South America: Market Size and Forecast, By System, 2024 – 2034($ Million)
10.5.4. South America: Market Size and Forecast, By End Use, 2024 – 2034($ Million)
10.5.5. BRAZIL
10.5.5.1. Brazil: Market Size and Forecast, By Logistics Mode, 2024 – 2034($ Million)
10.5.5.2. Brazil: Market Size and Forecast, By Delivery Type, 2024 – 2034($ Million)
10.5.5.3. Brazil: Market Size and Forecast, By End Use, 2024 – 2034($ Million)
10.5.6. ARGENTINA
10.5.6.1. Argentina: Market Size and Forecast, By Logistics Mode, 2024 – 2034($ Million)
10.5.6.2. Argentina: Market Size and Forecast, By Delivery Type, 2024 – 2034($ Million)
10.5.6.3. Argentina: Market Size and Forecast, By End Use, 2024 – 2034($ Million)
10.5.7. REST OF SOUTH AMERICA
10.5.7.1. Rest of South America: Market Size and Forecast, By Logistics Mode, 2024 – 2034($ Million)
10.5.7.2. Rest of South America: Market Size and Forecast, By Delivery Type, 2024 – 2034($ Million)
10.5.7.3. Rest of South America: Market Size and Forecast, By End Use, 2024 – 2034($ Million)
10.6. Middle East & Africa
10.6.1. Middle East & Africa: Market Size and Forecast, By Country, 2024 – 2034($ Million)
10.6.2. Middle East & Africa: Market Size and Forecast, By Logistics Mode, 2024 – 2034($ Million)
10.6.3. Middle East & Africa: Market Size and Forecast, By Delivery Type, 2024 – 2034($ Million)
10.6.4. Middle East & Africa: Market Size and Forecast, By End Use, 2024 – 2034($ Million)
10.6.5. SAUDI ARABIA
10.6.5.1. Saudi Arabia: Market Size and Forecast, By Logistics Mode, 2024 – 2034($ Million)
10.6.5.2. Saudi Arabia: Market Size and Forecast, By Delivery Type, 2024 – 2034($ Million)
10.6.5.3. Saudi Arabia: Market Size and Forecast, By End Use, 2024 – 2034($ Million)
10.6.6. UAE
10.6.6.1. UAE: Market Size and Forecast, By Logistics Mode, 2024 – 2034($ Million)
10.6.6.2. UAE: Market Size and Forecast, By Delivery Type, 2024 – 2034($ Million)
10.6.6.3. UAE: Market Size and Forecast, By End Use, 2024 – 2034($ Million)
10.6.7. EGYPT
10.6.7.1. Egypt: Market Size and Forecast, By Logistics Mode, 2024 – 2034($ Million)
10.6.7.2. Egypt: Market Size and Forecast, By Delivery Type, 2024 – 2034($ Million)
10.6.7.3. Egypt: Market Size and Forecast, By End Use, 2024 – 2034($ Million)
10.6.8. SOUTH AFRICA
10.6.8.1. South Africa: Market Size and Forecast, By Logistics Mode, 2024 – 2034($ Million)
10.6.8.2. South Africa: Market Size and Forecast, By Delivery Type, 2024 – 2034($ Million)
10.6.8.3. South Africa: Market Size and Forecast, By End Use, 2024 – 2034($ Million)
10.6.9. REST OF MIDDLE EAST & AFRICA
10.6.9.1. Rest of Middle East & Africa: Market Size and Forecast, By Logistics Mode, 2024 – 2034($ Million)
10.6.9.2. Rest of Middle East & Africa: Market Size and Forecast, By Delivery Type, 2024 – 2034($ Million)
10.6.9.3.Rest of Middle East & Africa: Market Size and Forecast, By End Use, 2024 – 2034($ Million)
CHAPTER 12. Competitive Landscape
12.1. Competitior Benchmarking 2023-
12.2. Market Share Analysis
12.3. Key Developments Analysis By Top 5 Companies
12.4. Market Share Acquisition Strategies: Analysis of Key Approaches Employed by Top Players
CHAPTER 13. Company Profiles
13.1. DHL
13.1.1. Hanon Systems
13.1.2. Financial Analysis
13.1.2.1. Business Segment Revenue, 2020, 2021, 2022, $ Million
13.1.2.2. Geographic Revenue Mix, 2022 (% Share)
13.1.3. Product Portfolio
13.1.4. Recent Development and Strategies Adopted
13.1.5. SWOT Analysis
13.2. FedEx
13.3. Panalpina World Trans
13.4. Kuehne + Nagel
13.5. Expeditors International
13.6. XPO Logistics
13.7. H. Robinson
13.8. Hellman Worldwide Logistics
13.9 Maersk
13.10 DB Schenker