Evolve Business Intelligence has published a research report on the Global Atrial Fibrillation Drugs Market, 2024–2034. The global Atrial Fibrillation Drugs Market is projected to exhibit a CAGR of around 10.25% during the forecast period of 2024 to 2034.
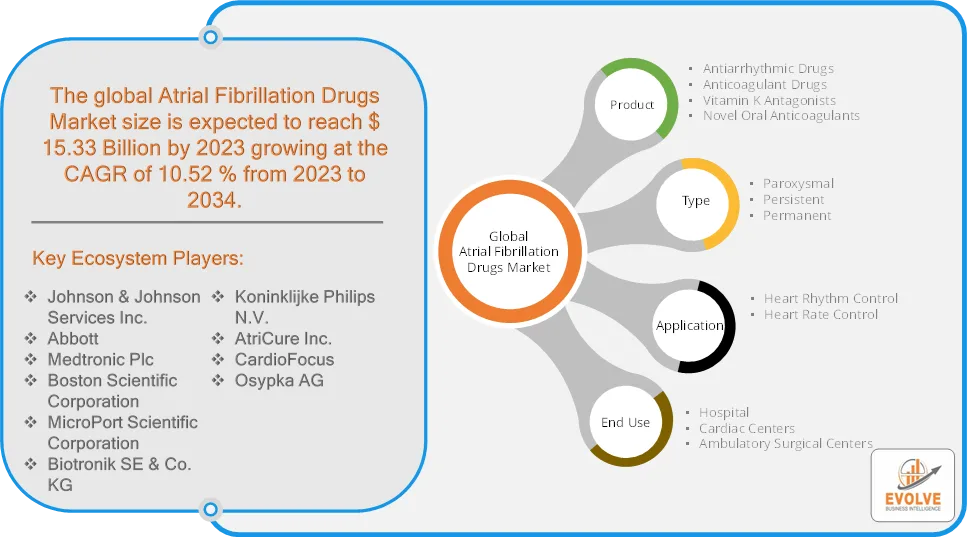
Evolve Business Intelligence has recognized the following companies as the key players in the global Atrial Fibrillation Drugs Market: Johnson & Johnson Services Inc., Abbott, Medtronic Plc, Boston Scientific Corporation, MicroPort Scientific Corporation, Biotronik SE & Co. KG, Koninklijke Philips N.V., AtriCure Inc., CardioFocus and Osypka AG.
 Market Highlights
The Global Atrial Fibrillation Drugs Market is projected to be valued at USD 21.36 Billion by 2034, recording a CAGR of around 10.25% during the forecast period. The Atrial Fibrillation (AF) Drugs Market focuses on pharmaceutical treatments designed to manage and treat atrial fibrillation, a common cardiac arrhythmia that increases the risk of stroke, heart failure, and other heart-related complications. The market is driven by the rising prevalence of AF due to aging populations, lifestyle-related risk factors, and increasing awareness about early diagnosis and treatment.
The Atrial Fibrillation Drugs Market is expected to continue growing with increasing AF cases, new drug innovations, and expanding access to healthcare worldwide.
Segmental Analysis
The global Atrial Fibrillation Drugs Market has been segmented based on Product, Type, Application and End Use.
Based on Product, the Atrial Fibrillation Drugs Market is segmented into Antiarrhythmic Drugs, Anticoagulant Drugs, Vitamin K Antagonists, Novel Oral Anticoagulants. The Anticoagulant Drugs segment is anticipated to dominate the market.
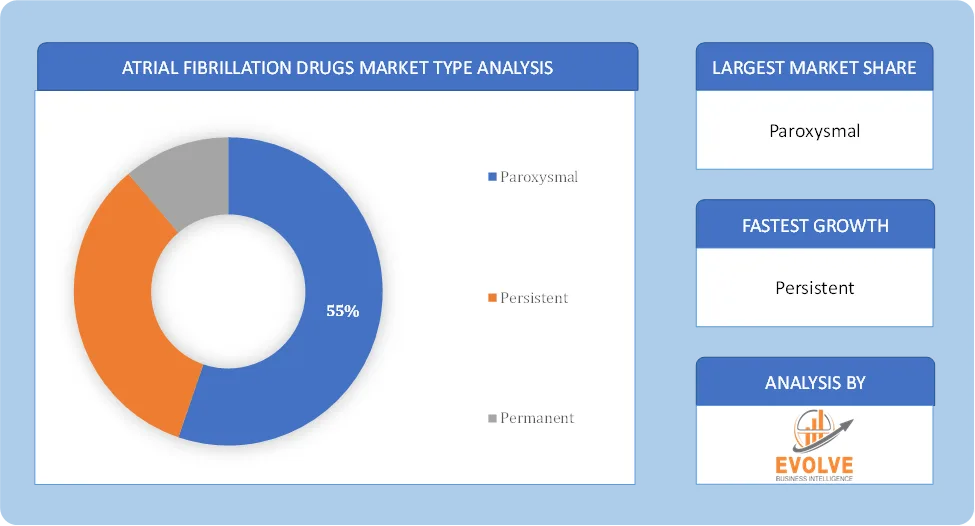
Based on Type, the global Atrial Fibrillation Drugs Market has been divided Paroxysmal, Persistent, Permanent. The Paroxysmal segment is anticipated to dominate the market.
Based on Application, the global Atrial Fibrillation Drugs Market has been divided into Heart Rhythm Control, Heart Rate Control. The Heart Rhythm Control segment is anticipated to dominate the market.
Based on End Use, the global Atrial Fibrillation Drugs Market has been divided into Hospital, Cardiac Centers, Ambulatory Surgical Centers. The Hospital segment is anticipated to dominate the market.
Regional Analysis
The Atrial Fibrillation Drugs Market is divided into five regions: North America, Europe, Asia-Pacific, South America, and the Middle East, & Africa. North America, particularly the United States, holds a significant share of the AFib drugs market and this is attributed to a high prevalence of AFib, a well-established healthcare system, and substantial healthcare expenditure. Europe also represents a substantial market due to its aging population and developed healthcare systems. Increasing government initiatives to improve cardiovascular health and growth of the geriatric population. The Asia Pacific region is expected to witness the fastest growth in the AFib drugs market. Rapidly aging population, particularly in countries like Japan and China. Improving healthcare infrastructure and increasing healthcare spending and Increasing adoption of Western treatment approaches and growing demand for affordable AFib drugs. In Latin America region, Increasing AF incidence due to lifestyle changes (obesity, smoking, hypertension) and government efforts to improve cardiac care in Brazil, Mexico, and Argentina. The Growth will depend on healthcare infrastructure improvements and better insurance coverage for NOACs. The MEA market is expected to grow steadily, driven by expanding healthcare infrastructure and increasing awareness of AF treatment options. Rising burden of cardiovascular diseases in Saudi Arabia, UAE, and South Africa and government focus on modernizing healthcare through initiatives like Saudi Vision 2030.